


Services on Demand
Article
 English (pdf)
 Article in xml format
 Article references
Indicators

Related links
-
 Cited by Google
 -
 Similars in Google
Share

 Permalink
Journal of the Southern African Institute of Mining and Metallurgy
On-line version ISSN 2411-9717
Print version ISSN 2225-6253
J. S. Afr. Inst. Min. Metall. vol.122 n.4 Johannesburg Apr. 2022
http://dx.doi.org/10.17159/2411-9717/1418/2022
PROFESSIONAL TECHNICAL AND SCIENTIFIC PAPERS
Preliminary assessment of coal blend quality combining gamma-ray spectrometry and magnetic susceptibility: A case study of the Sabinas Basin, Mexico
J.A. Batista-Rodríguez; F.J. López-Saucedo
Higher School of Engineering, University Autonomous of Coahuila, Saltillo, Mexico. ORCID: J. Alberto Batista: https://orcid.org/0000-0002-2222-2582; F. de Jesus López Saucedo: https://orcid.org/0000-0002-7920-9813
SYNOPSIS
A new methodology is proposed for the preliminary assessment of coal blend quality, which combines gamma-ray spectrometry and magnetic susceptibility measurements. This methodology does not replace the conventional methods of assessing coal quality, but can help to control the quality of the coal blending process, as well as reduce the amount of proximate analysis required and the determinations of calorific value and total sulphur. The methodology includes five steps. First, both geophysical measurements are made with handheld equipment. The samples with magnetic susceptibility < 1 x 10⁻³ SI are then separated. From these samples, those with total gamma intensity < 20 nGy/h are separated. These samples have a higher calorific value and lower ash and moisture content. To separate the samples of better quality and with lower total sulphur content, in step four the samples with total gamma intensity > 20 nGy/h are separated from those with magnetic susceptibility < 1 x 10⁻³ SI. This last group includes samples that will cause less total sulphur-related environmental pollution. In the final step, the quality of both radioactive sample groups is corroborated from the calorific value measurement and ash, moisture, and total sulphur contents in at least 10% of all coal blend samples from both groups. In this study, more than 1000 samples were analysed with this new methodology, and the results are remarkably similar to the ASTM classification of the Sabinas Basin coals.
Keywords: coal blend quality, gamma-ray spectrometry, magnetic susceptibility, Sabinas Basin.
Introduction
According to the Energy Information Administration (EIA, 2019), coal is an essential resource for the development of humanity, mainly as regards its use in electricity generation. The EIA (2019) indicates that the consumption of electrical energy will increase substantially in the coming years. This implies increased coal consumption and consequently a greater need to check the quality of the coal used for this purpose (Taole, Falcon, and Bada, 2015), in order to achieve higher efficiency in the process and to mitigate environmental pollution (North, Engelbrecht, and Oboirien, 2015; Jingchao, Kotani, and Saijo, 2019). Reducing the impact of coal burning implies reducing environmental pollution (Munawer, 2018), and therefore, decreasing the impact on the lungs, immune system, heart, reproductive system, brain, and DNA (Gasparotto and Da Boit Martinello, 2020). Increased coal consumption leads to the use of different coals, some of which are low-quality coal. Different coals may be blended to obtain a product with the minimum required quality. Blending is widely used in the coal industry to provide the best quality coals for a power plant so as to reduce energy production costs (Li et al., 2019).
Although Mexico is not among the chief coal-producing countries (EIA, 2010) this resource is intensively mined in the Sabinas Basin of northeastern Mexico and is mainly used in electricity generation (Corona-Esquivel et al., 2006). Generally, coal blends are used, spalling the coal in this basin ranges in rank from lignite to sub-bituminous with different quality characteristics (Corona-Esquivel et al., 2006). Coal blends are prepared to ensure the optimal efficiency of combustion and reduce the emission of pollutants to the environment (YorUkoglu, 2017). The quality of coal is ascertained by proximate analysis to determine the ash and moisture contents, and also from the calorific value and total sulphur content (Speight, 2005). Performing these analyses on a large volume of samples is time-consuming and requires various types of laboratory equipment, making it an expensive process (Acikkar and Sivrikaya, 2018).
In other regions of the world, some of these coal quality parameters have been estimated using geophysical logs, such as density, gamma-ray, and resistivity (Kayal and Das, 1981; Borsaru et al., 1985; Yusefi and Ramazi, 2019). The physical properties of geological materials depend on their mineralogy, texture, and structure (Schön, 2011). Therefore, geophysical measurements can be related to the properties of the samples determined in the laboratory (e.g., ash content, humidity, sulphur, calorific value).
Gamma-ray spectrometry (GS) and magnetic susceptibility (k) characterize the mineralogical composition, texture, and structure of the geological materials (Clark, 1997; Bäbek et al., 2010; Parzentny and Rog, 2019). Both these geophysical techniques can be performed with portable equipment, resulting in a relatively fast and inexpensive procedure (Hladil et al., 2006; Bäbek et al., 2010; Habib et al., 2018; Hassan et al., 2018; Martin et al., 2018; Lam et al., 2020). Magnetic susceptibility is a physical property directly related to the concentration, distribution, and grain size of magnetic minerals (Carmichael, 1989). In coal, these minerals are mainly oxides, sulphides, clays, and carbonates (Speight, 2005; Thomas, 2013).
From the GS measurements, the natural gamma radioactivity of geological materials is obtained. Radioactivity is expressed in terms of the content of potassium (K) in per cent, and uranium (U) and thorium (Th) in ppm. Such content is related to the mineralogical composition (Schön, 2011). Particularly in coal, the natural gamma radioactivity is related to its organic and mineral matter. Specifically, uranium may be associated with organic matter (Duan et al., 2018; Parzentny and Rog, 2019). Furthermore, uranium as well as Th and K, may be associated with minerals such as clays, monazite, zircon, rare earths, and phosphates (Swaine, 1990; Dai and Finkelman, 2017; Parzentny and Rog, 2019).
From measurements of k with portable equipment (e.g., KT-10 and SM-30), the magnetic mineralogy of soils has been characterized, and with it, contamination with heavy metal (Martin et al., 2018). Similarly, chemical processes in tailings, such as pyrite oxidation, have been studied (Lam et al., 2020). Also, in-situ gamma-ray spectrometry measurements have been performed to determine the concentration of radionuclides in soil (Habib et al., 2018; Hassan et al., 2018). Such measurements showed a strong correlation with laboratory measurements (Hassan et al., 2018). The gamma-ray spectrometry measurements in some soils around coal-based power plants show high radioactivity, which is related mainly to illite, kaolinite, monazite, rutile, and zircon (Habib et al., 2018). Combining in-situ measurements of magnetic susceptibility and gamma-ray readings, some carbonate, and carbonate-siliciclastic sequences have been characterized (Bäbek et al., 2010), and limestones impurities studied (Hladil et al., 2006).
In the specific case of coal, the data obtained by combining both geophysical techniques (k and GS) is related to the mineralogy and organic matter (Speight, 2005; Thomas, 2013; Habib et al., 2018; Parzentny and Rog, 2019). Therefore, such geophysical data is also related to the ash content, sulphur, calorific value, and moisture content. These last parameters are essential to assess the quality of the coal (Speight, 2005; Thomas, 2013).
In this paper we propose combining gamma-ray spectrometry and magnetic susceptibility as unconventional methods for the preliminary assessment of the quality of coal blends for electricity generation. To accomplish this objective, coal blend samples from the Sabinas Basin in Mexico are analysed. Both geophysical measurements are compared with proximate analysis, calorific value, and total sulphur. The geophysical data will provide information about the organic and mineral matter in the coal, and the possible carriers of magnetization and radioactivity.
Geological setting
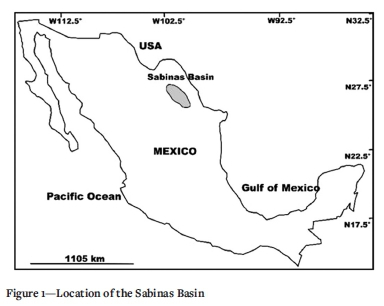
The Sabinas Basin is located in northeastern Mexico (Figure 1) and has a sedimentary filling of evaporitic, carbonate, and siliciclastic rocks, deposited from the Middle Jurassic to the present day (González-Sánchez et al., 2007). Within the stratigraphic sequence, the Olmos Formation is the main carrier of the coal beds mined in the region (Corona-Esquivel et al., 2006). This formation has a Middle Maastrichtian age and is mainly composed of sandstone (Padilla y Sánchez, 1986). The basin is subdivided into eight sub-basins (Rivera-Martínez and Alcocer-Valdés, 2003). According to MICARE (1982), the coal in the Sabinas Basin contains an average of 36.0% fixed carbon, 27.0% volatile matter, 37.0% ash, and 1.0% sulphur.
In the preparation of the coal blends from the Sabinas Basin, coals from either the same sub-basin or different sub-basins are used. Hence, coal blends with characteristics and qualities that differ from in-situ coal are obtained. It is therefore necessary to assess the quality of the coal blends to be used in the generation of electricity.
Materials and methods
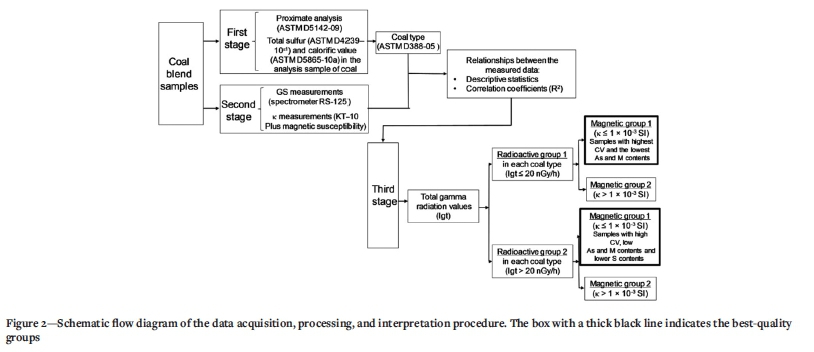
Analysis of the coal blend samples from the Sabinas Basin was carried out in several stages (Figure 2). In the first stage, 1004 coal blend samples were studied by proximate analysis, calorific value, and total sulphur determination. In the second stage, geophysical measurements (k and GS) were performed. Finally, the coal blend samples were classified based on the geophysical measurements. The coal blends were empirically prepared by the coal producers, and the coals used were obtained from both open pit mines and underground operations.
Proximate analysis, calorific value, and total sulphur
The proximate analyses and determinations of the calorific value and total sulphur of the coal blends were performed in the coal laboratory at the Higher Engineering School of the Autonomous University of Coahuila (Mexico). To perform these analyses, the samples were crushed, homogenized, and sieved to < 250 µm. A mass of 2 kg was obtained for each sample analysed. Moisture (M) and ash content were determined from the proximate analyses using the standards of ASTM D5142-09 (2009). Analyses of calorific value (CV) and total sulphur (S) were carried out according to the standards of ASTM D5865-10a (2010) and ASTM D4239-10e1 (2010), respectively. These analyses were carried out on a dry, mineral-matter-free basis.
GS and k measurements
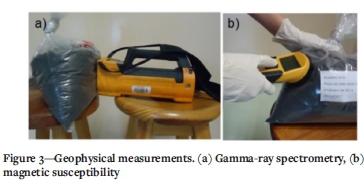
For the GS and k measurements, samples of about 2 kg were placed on a wood base with a height of 1 m. At least two measurements of GS and five of k were taken on each of the 1004 samples, resulting in a total of 2008 measurements of GS and 7715 of k (Figure 3). Magnetic susceptibility measurements were taken using a KT-10 Plus magnetic susceptibility meter manufactured by Terraplus Inc. This device was placed directly on a flat surface of the sample. Natural gamma radioactivity was measured by gamma-ray spectrometry using a portable NaI(Tl) g-ray spectrometer (RS-125) manufactured by Radiation Solution Inc. Measurements were taken with a count time of 120 seconds with the instrument placed directly on the sample surface. Both instruments (KT-10 and RS-125) had been factory-calibrated using specially designed test pads.
The spectrometer measures an effective thickness of approximately 25 cm with a radius of 1 m (IAEA, 2003). Total gamma radiation (Igt in nGy/h) measurements and the concentrations of K (%), U (ppm), and Th (ppm) are made using the spectrometer. Potassium concentrations are obtained from the peak of 40K, while uranium concentrations are estimated from the 238U and 235U peaks, and thorium concentrations from peaks of the 232Th series. For this reason, the term 'equivalent' or its abbreviation 'e' is used to indicate uranium and thorium concentrations (eU and eTh, respectively).
Processing and interpretation
Processing and interpretation were carried out in several stages (Figure 2), using statistics of central tendency and dispersion, such as arithmetic mean and standard deviation. Relationships between the measured data were also determined using a correlation analysis using the correlation coefficients (R2) and an associated level of significance (p) of 0.05. In the first stage, the coal type to which each coal blend sample belonged was determined. To this end, proximate analysis, calorific value, and total sulphur were used. In the second stage, the characteristics of radioactivity and magnetism of every coal type were obtained. This also included determining the relationships between coal parameters, gamma radioactivity, and magnetic susceptibility. In the third stage, the samples of every coal type were classified using a combination of GS and k. This classification was made to obtain a preliminary assessment of the quality of the blends. This assessment included organic and inorganic matter, expressed through GS. Specifically, regarding the inorganic matter, this geophysical measurement was related to detrital material. The assessment also included magnetic mineral content through the k data. The GS and k averages of each coal blend sample were used in this classification.
Using total gamma radiation values, specifically 20 nGy/h (Muñoz-González, 2015), every coal blend type was classified into one of two groups (first group: Igt < 20 nGy/h and second group: Igt > 20 nGy/h). Muñoz-González (2015) indicates that an Igt greater than 20 nGy/h is typical of samples with the highest ash content. Values lower than 20 nGy/h are related to coals with higher organic matter. Research in other regions of the world has also shown a direct relationship between radioactivity and ash content (Kayal and Das, 1981; Borsaru et al., 1985; Khalil, Islam, and Akon, 2011; Yusefi and Ramazi, 2019).
The two groups established by Igt in each coal type were subclassified using k values. into two magnetic groups (first group k < 1 x 10⁻³ SI; second group k > 1 x 10⁻³ SI). The limit of 1 x 10⁻³
SI was selected considering that the coal blend is a sedimentary material that can have a low or a high Fe content (Thomas, 2013). According to Clark (1997), a sedimentary rock with high iron content has k > 1 x 10⁻³ SI. Thus, the first group included coal samples with low magnetism, whereas the second group included samples with high magnetism. Subsequently, each of the groups was described and compared with the others, and then the groups with the best-quality coal blend samples were selected.
Results and discussion
Classification and analysis of coal blends from Sabinas Basin using proximate analysis, calorific value and total sulphur
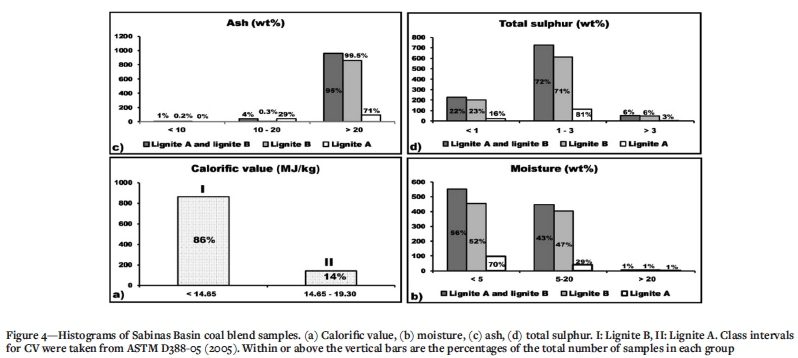
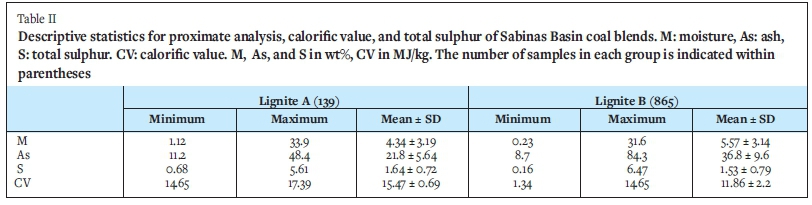
In the 1004 coal blend samples studied the CV ranges between 1.342 and 17.393 MJ/kg, with an arithmetic mean of 12.36 MJ/kg and a standard deviation of 2.442 MJ/kg (Table I). The range and standard deviation indicate variable quality across the samples (Speight, 2005; Thomas, 2013). According to ASTM D388-05 (2005), the coal blend samples can be classified as lignite A and B (Figure 4a). Eighty-six per cent of the samples analysed have a CV less than or equal to 14.653 MJ/kg and can be classified as lignite B. The remaining 14% have a CV greater than 14.653 MJ/kg and can be classified as lignite A. The reported CVs indicate that these coal blends can be used efficiently in electricity generation (Oney, 2020).
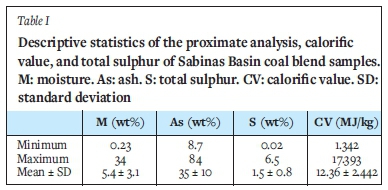
The samples studied have a moisture content between 0.23 and 34 wt%, with an arithmetic mean of 5.4 wt%. Furthermore, these samples have an ash content between 8.7 and 84 wt% (arithmetic mean 35 wt%), as well as a sulphur content between 0.02 and 6.5 wt% (arithmetic mean 1.5 wt%) (Table I). The low arithmetic mean and narrow standard deviation (3.1 wt%) of the moisture content indicate low moisture in most of the studied samples. Specifically, 56% of these samples have a moisture content below 5 wt%, 43% are between 5 and 20 wt%, and only 1% have a moisture content above 20 wt% (Figure 4b). Samples with a moisture content close to 34 wt% are located in the medium range of the coals, that is, from 5 to 70 wt% according to Rasheed et al. (2015). Such high moisture contents can reduce the CV and therefore constrain efficiency during the coal-burning process (Thomas, 1992).
The variation in ash content and its standard deviation (10 wt%; Table I) indicate great variability in the relationship between the organic matter and the mineral matter of the samples (Acikkar and Sivrikaya, 2018). An ash content close to 8.7 wt% (lower limit) should be related to samples of higher quality (Rasheed et al., 2015). Only 1% of the samples have an ash content below 10 wt% (Figure 4c). These samples are low in mineral matter, such as siliciclastic and authigenic minerals (Acikkar and Sivrikaya, 2018). According to Finkelman, Dai, and French (2019) and Liu et al. (2020), authigenic minerals predominate in coal with low ash content (8-10%). Ninety-five per cent of the analysed samples have an ash content greater than 20 wt%. These samples, and particularly those with an ash content close to 84 wt% (upper limit) must contain a low amount of organic matter and, therefore, a high content of mineral matter, mainly detrital minerals (Finkelman, Dai, and French, (2019); Liu et al., 2020). Such high ash contents adversely influence the quality of the coal and the efficiency of the combustion process (Thomas 1992), which can have a negative impact on the environment (Noble and Luttrell, 2015).
The variation in sulphur content indicates that some coal samples may contain up to 6.5 wt% total sulfphur (Table I), near to the sulphur content reported (10 wt%) in coals from other regions of the world (Benko et al., 2007; Ruan et al., 2018). Coal with a total sulphur content of more than 3 wt% is termed high-sulphur coal (Zhang, Peng, and Zou, 2013). Six per cent of the analysed samples have this characteristic (Figure 4d). Such high sulphur contents can present considerable environmental risks and pose significant problems in coal utilization (Marinov et al, 2005). When coal is burned, Si-Al, Fe, SO2, Ca, Na, and Mg are obtained, potentially polluting the atmosphere through acid rain (Benko et al, 2007). Twenty-two per cent of the samples have a sulphur content below 1 wt%, while 72% are between 1 and 3 wt% (Figure 4d). These last two ranges indicate low and medium sulphur content, respectively. Samples from both ranges have good characteristics for combustion (Kierczak and Chudy, 2014).
Table II indicates that samples classified as lignite A have lower moisture and ash contents, as well as a higher total sulphur content than the lignite B samples. Regarding, lignite A, 70% of the samples have a moisture content lower than 5 wt%. compared with 52% for lignite B. Furthermore, for lignite B, 47% of the samples have a moisture content between 5 and 20 wt% (Figure 4b). For lignite A, only 71% of the samples exceed 20 wt% ash content, unlike lignite B, in which 99.5% of the samples contain mire than 20 wt% ash (Figure 4c). Eighty-one per cent of lignite A samples have a sulphur content greater than 1 wt%, compared with 71% for lignite B (Figure 4d).
The characteristics described indicate that lignite A may be more suitable for electricity generation (Speight, 2005) and have a lesser environmental impact in terms of ash generated during combustion (Yorukoglu, 2017; Jingchao, Kotani, and Saijo, 2019). However, these samples would generate more sulphur-related pollution. The standard deviations of the four parameters indicate that lignite B is more heterogeneous in its CV and ash and sulphur contents (Table II). This characteristic suggests greater variability in the energy efficiency and environmental impact of lignite B compared to lignite A.
Radioactive and magnetic characteristics of coal blends (lignites A and B)
Given that the samples are made up of mixtures of different coal types from the Sabinas Basin, great variations can be expected in both geophysical measurements.
Gamma-ray spectrometry (GS) of lignite B
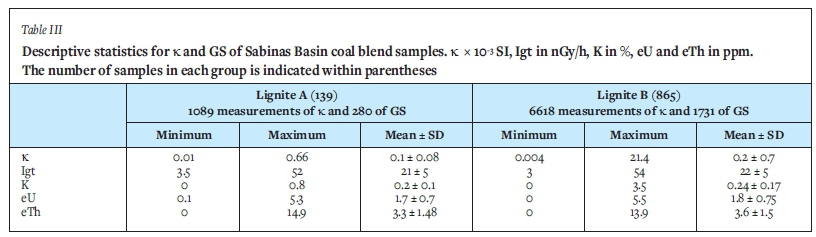
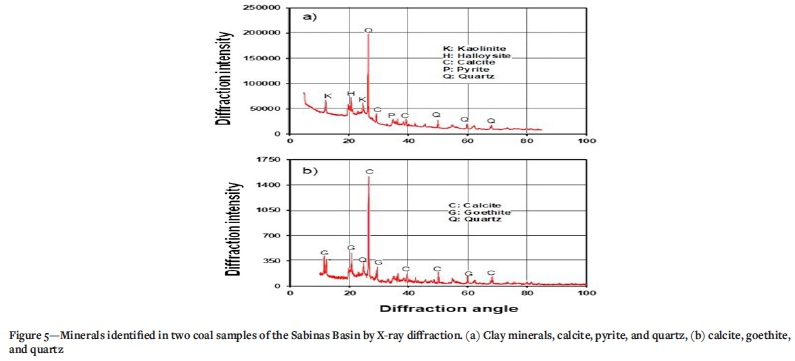
The Igt and K, eU, and eTh data show great variation in lignite B (Table III), suggesting large differences in the compositions of these samples. These differences depend on the relationship between organic matter and mineral matter, as well as on the mineral content. The detrital minerals in coal may include clays, silicates, sulphates, carbonates, oxides, and hydroxides of iron, may appear (Thomas, 2013). XRD analysis of the samples showed that kaolinite, halloysite, calcite, quartz, pyrite, and goethite are present (Figure 5). Generally, the considerable content of detrital material can result in high Igt values (Khalil, Islam, and Akon, 2011).
Magnetic susceptibility (k) of lignite B
In the coal samples classified as lignite B, the k values vary from 0.004 to 21.4 x 10⁻³ SI, with a mean of 0.2 x 10⁻³ SI and standard deviation of 0.7 x 10⁻³ SI (Table III). These statistical results show that this coal type exhibits highly varied magnetic properties, ranging from slightly paramagnetic to very ferromagnetic. The magnetism must be linked to the detrital and authigenic minerals. The X-ray diffraction analysis (Figure 5) suggests the presence of clays (kaolinite and halloysite), Fe sulphsides (pyrite) andoxides (goethite), carbonates (calcite), and quartz in both groups of minerals. Also, ferromagnetic minerals, such as magnetite, ilmenite, titanomagnetite, and pyrrhotite may be present (Thomas, 2013). Fe sulphides, particularly pyrite, can oxidize to form oxides such as magnetite (Hladil et al., 2006).
Relationship of coal parameters with gamma radioactivity and magnetic susceptibility of lignite B
In the lignite B coal samples, total gamma intensity is mainly related to eTh (R2 = 0.70) and eU (R2 = 0.59). Therefore, the natural gamma radioactivity is related to both mineral and organic matter (Parzentny and Rog, 2019). The eTh is related to mineral matter (Dai and Finkelman, 2017), whereas U may be related to both matter types and can occur in minerals such as zircon, rare earths, and phosphates (Hower, Dai, and Eskenazy, 2016). Since coals with rank from lignite to sub-bituminous were used to prepare the blends, the occurrence of U in minerals must be linked to high-ranking coals (Swaine, 1990). The CV shows a high negative correlation with ash content (R2 = -0.86) and is to a certain degree negatively correlated with moisture (R2 = -0.33). This relationship indicates that the variations in the CV are related to the ash and moisture content. An increase in the CV in these samples is subject to decreases in the content of both parameters. Moisture is to a certain degree correlated with ashs (R2 = 0.21), indicating that the former is mainly related to the mineral matter. The k shows a certain degree of positive correlation with ash (R2 = 0.25) and also a negative correlation with CV (R2 = -0.25). This suggests that there are magnetic minerals in the ash fraction, and therefore an increase in the ash content is accompanied by an increase in k and a decrease in the CV.
Gamma-ray spectrometry of lignite A
The coal samples classified as lignite A have lower levels of radioactivity than the lignite B samples. In the lignite A samples, the Igt as well as the K, eU, and eTh content are also varied, but less so than in lignite B (compare the standard deviations in Table III). This difference indicates greater radioactive homogeneity in lignite A. The radioactive characteristics of lignite A are related to the lower ash content and higher CV (Table II). Both parameters indicate a lower quantity of inorganic matter and, therefore, a higher quality in these samples. These samples contain fewer U- and Th-bearing minerals such as monazite and therefore emit less radioactive pollution to the environment when combusted (Hower, Dai, and Eskenazy, 2016; Parzentny and Rog, 2019).
Magnetic susceptibility of lignite A
The lignite A samples have lower k values than lignite B (Table III). In lignite A, k varies from 0.01 to 0.66 x 10⁻³ SI, with an arithmetic mean of 0.1 x 10⁻³ SI and standard deviation of 0.08 x 10⁻³ SI (Table III). These statistics also indicate that the lignite A samples are magnetically less heterogeneous than the lignite B samples. The magnetism of the lignite A sample is mainly linked to paramagnetic minerals such as clays, sulphides, carbonates, and iron silicates (Thomas, 2013).
Relationship of coal parameters with gamma radioactivity and magnetic susceptibility of lignite A
In the lignite A samples, some of the relationships between the measured data are similar to those evident in the lignite B samples. The radioactivity of lignite A is also related to both mineral and organic matter (Parzentny and Rog, 2019) because the Igt is mainly linked with eTh (R2 = 0.60) and eU (R2 = 0.51). Furthermore, in lignite A the CV shows strong a negative correlation with the ash content (R2 = -0.73), indicating that the increase in the CV is due to a decrease in the ash content. Similarly, the moisture content is to a certain degree correlated with the ash content (R2 = 0.37), indicating a relationship between moisture and coal mineral matter. k is to a certain degree correlated with the K content (R2 = 0.30). This relationship suggests that the low k of the lignite A samples is to a certain extent due to paramagnetic minerals (Babek et al., 2010) such as clays and micas (Thomas, 2013).
Classification of the coal blends according to the GS and k values
The variations in the proximate analysis parameters, CV, and total sulphur may indicate differences in the GS and k values, and therefore in the quality of the analysed coal samples. Samples with particularly high k values appear to contain iron-rich minerals such as oxides, sulphides, silicates, and carbonates (Speight, 2005; Thomas, 2013). These samples probably have considerable inorganic matter content. Organic-matter-rich samples may have high U-related radioactivity (Duan et al., 2018). Also, samples with a high clastic material content (siliciclastic) may have high radioactivity levels (Khalil, Islam, and Akon, 2011). We propose classifying the coal blend samples studied in terms of their k and GS values.
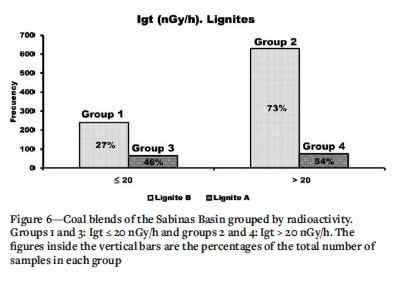
Classification of coal blends using GS Using natural gamma radioactivity, the coal types of the studied blends (lignites A and B) can be classified into two groups (groups 1 and 2 in lignite B; groups 3 and 4 in lignite A). The first group in each lignite type comprises coal blend samples with Igt < 20 nGy/h, and the second group, coal blends with Igt > 20 nGy/h (Figure 6). The first group of each coal type is considered to include the least radioactive and the highest quality coal blend samples relative to the second group. The first group of each coal type may have a high content of organic matter, assuming that in these samples radioactivity is mainly related to detrital material (Khalil, Islam, and Akon, 2011). Seventy-three per cent of the lignite B samples are located in radioactive group 2 (Figure 6), that is, in the lowest-quality group according to the radioactivity values. As regards lignite A, 54% of the samples belong to radioactive group 4.
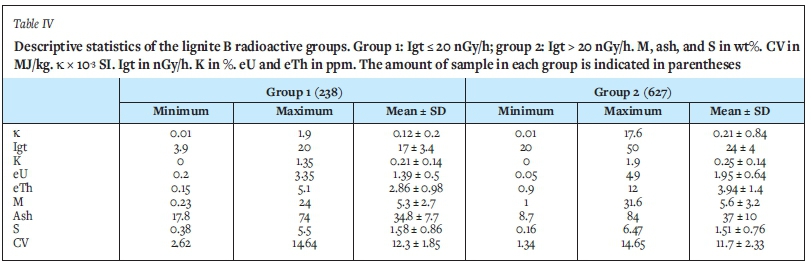
Analysis of lignite B radioactive groups (group 1 and 2)
The descriptive statistical results for each radioactive group of lignite B are shown in Table IV. Group 1 is less magnetic and radioactive than group 2. Also, group 1 has lower ash and moisture contents and a higher S content. This group is more homogeneous in its k and radioactivity, as well as in its ash content and CV. These characteristics suggest a lower content of detrital material and Fe-rich minerals in the group 1 coal blend samples.
In lignite B group 1, radioactivity is related to eTh (R2 = 0.63), eU (R2 = 0.36) and K (R2 = 0.33), and K also tends to correlate with eTh (R2 = 0.26). In group 2, radioactivity is related only to eTh (R2 = 0.67) and eU (R2 = 0.52). These relationships in both groups suggest that the radioactivity of the samples is related to both organic and mineral matter, mainly detrital minerals (Pehlivanli et al., 2014). The correlation between K and eTh reflects the concentration of siliciclastic components in the samples (Babek et al. 2010). In both groups, the CV has a negative correlation with k (group 3: R2 = -0.23; group 4: R2 = -0.26), the moisture content (group 3: R2 = -0.30; group 4: R2 = -0.34), and the ash content (group 3: R2 = -0.85; group 4: R2 = -0.85). These relationships are expected for coal samples because increases in ash, moisture, and Fe-rich mineral matter (Bolortuya et al, 2013) cause a decrease in the CV. In group 2, the ash content is positively related to k (R2 = 0.27) and moisture content (R2 = 0.22), confirming the previous approach.
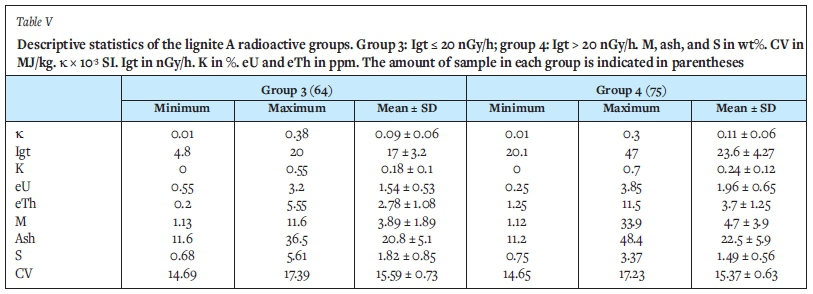
Analysis of lignite A radioactive groups (groups 3 and 4)
The radioactive groups 3 and 4 of lignite A have similar characteristics to groups 1 and 2 of lignite B (Tables IV and V). Lignite A group 3 has lower magnetic susceptibility and radioactivity than group 1, as well as a higher CV and sulphur content and a lower moisture and ash content. Therefore, group 3 includes the highest quality coal blend samples within lignite A.
In the group 3 coal blend samples, radioactivity is related to eTh (R2 = 0.45), K (R2 = 0.28), and eU (R2 = 0.23). eTh is positively related to K (R2 = 0.36) and negatively related to eU (R2 = -0.33). The CV has an expected negative relationship with ash (R2 = -0.80) and moisture content (R2 = -0.31). Both parameters are also positively related to each other (R2 = 0.30). Furthermore, the CV has a possible positive correlation with eU (R2 = 0.20). These relationships indicate radioactivity linked to organic and mineral matter. Organic matter may provide the highest U content, whereas clay minerals can provide the Th and K content.
In group 4, the lignite A samples have radioactivity related to eTh (R2 = 0.55) and eU (R2 = 0.51). The latter element tends to be negatively related to eTh and K (R2 = -0.23 and R2 = -0.26, respectively). This relationship indicates that radioactivity is also linked to the organic and mineral matter of the samples. Additionally, U is related to organic matter (Duan et al., 2018).
Furthermore, the CV has an expected negative relationship with the ash content (R2 = -0.68). Ash is also positively related to the moisture content (R2 = 0.39). The negative relationship between eTh and eU in both groups suggests a different origin of the two radioactive elements. The Th probably has a detrital origin and the U an organic origin (Dai and Finkelman, 2017).
Classification of coal blends using k
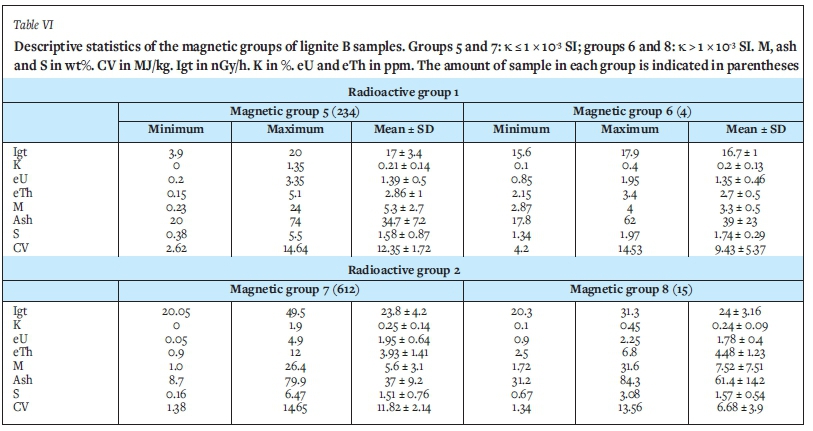
Each radioactive group is divided into two magnetic groups: a first magnetic group with k < 1 x 10⁻³ SI values and a second with k > 1 x 10⁻³ SI values. All coal blend samples for lignite A type have k < 1 x 10⁻³ SI, and therefore radioactive groups 3 and 4 are included within the first magnetic group (Table VI).
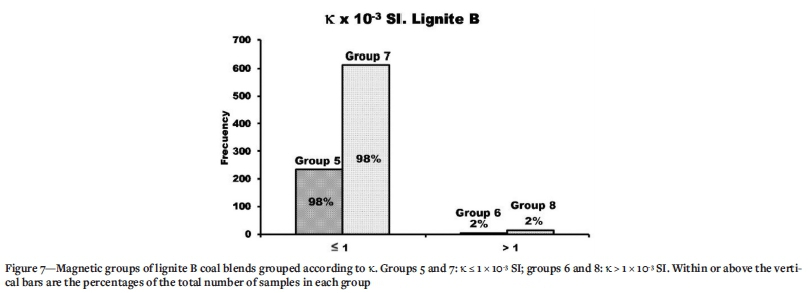
In lignite B, radioactive groups 1 and 2 are both divided into two magnetic groups. Radioactive group 1 is divided into magnetic groups 5 and 6, and radioactive group 2 into magnetic groups 7 and 8 (Figure 7). Magnetic groups 5 and 7 include 98% of the samples in each of the radioactive groups (group 1 and 2). This classification shows that most of the analysed coal blends have low levels of magnetic mineral content. Both magnetic groups include the highest-quality lignite B samples. Within radioactive group 1, magnetic group 5 has higher CV and lower ash and sulphur content than magnetic group 6 (Table VI). Also, the CV and as content have less variability in group 5. In radioactive group 2, magnetic group 7 also has a higher CV and lower ash and sulphur content than magnetic group 8. The CV and ash content are also lower in group 7.
In magnetic groups 5 and 7, radioactivity (Igt) is mainly related to eTh (R2 = 0.64 and R2 = 0.67, respectively) and eU (R2 = 0.36 and R2 = 0.52, respectively). In group 5, radioactivity is also related to K (R2 = 0.34). This latter element shows a tendency to positively correlate with eTh (R2 = 0.27). In group 7, K tends to correlate positively with eU (R2 = -0.26). These relationships in both magnetic groups indicate a link between radioactivity and both the organic and inorganic matter of the samples. The siliciclastic component of the samples provides the Th and K content. The U content must be provided by the organic matter and the siliciclastic material. In both groups, the CV shows expected negative relationships with the ash content (R2 = -0.84 in group 5; R2 = -0.85 in group 7) and the moisture content (R2 = -0.34 in group 5; R2 = -0.35 in group 7). In the most radioactive group (group 7), the moisture content is positively related to the ash content (R2 = 0.23), and therefore to the inorganic material in the samples.
Quality of coal blend groups
Analysis of radioactive groups 1 and 2 indicates that the first group is of higher quality according to its ash content and CV, as well as in terms of its radioactivity and magnetism. However, this group has the highest sulphur content, so combustion may have a greater negative impact on the environment. The statistical analysis shows that only 4% of the samples in this group have an S content greater than 3 wt%, hence the impact on the environment will be low (Marinov et al., 2005; Zhang, Peng, and Zou, 2013). The increase in S content in higher quality lignite B samples (i.e., those with higher CV) suggests that sulphur is mainly linked to organic matter (Olivella et al., 2002; Duan et al., 2018). Sulphur may be provided by pyrite of an organic origin.
In the lignite A samples, analysis of radioactive groups 3 and 4 indicates that group 3 contains the highest quality coal blend samples. Comparing these radioactive groups in both types of lignites (Tables IV and V), it is inferred that group 3 (lignite A) has lower k and K, eTh, moisture, and ash content, as well as higher U and S and a higher CV than group 1 (lignite B). These differences indicate that group 3 includes the highest quality samples, although with higher sulphur contents. A total of 4.7% of the group 3 samples have an S content greater than 3 wt%. In lignite B, only 4% of the group 1 samples exceed this S content. Therefore, the group 3 samples may pollute the environment more but generate less ash (Munawer, 2018), implying less risk of pollution and work in handling the ash. Group 4 (lignite A) also has lower k, radioactivity, and ash and moisture content than group 2 (lignite B). These characteristics and the higher CV indicate that group 4 has a higher quality than group 2. The lignite A group also has a lower sulphur content, suggesting a lower impact on the environment when the coal is combusted.
The characteristics of the lignite B magnetic groups indicate that the first magnetic groups within each radioactive group (groups 5 and 7 with k < 1 x 10⁻³ SI) are composed of the highest quality coal blend samples. Group 5 belongs to radioactive group 1 and is not only less radioactive than group 7, but also has higher a CV and sulphur content, and lower ash and moisture contents (Table VI). Furthermore, group 5 presents less variability in the CV and higher variability in sulphur content. Based on these characteristics, the group 5 coal blend samples are considered to be of higher quality than group 7 in terms of their suitability for energy generation. However, the higher sulphur content of group 5 can cause more environmental pollution during combustion. Group 7 has a very similar sulphur content to that of lignite A group 4. Therefore, the samples of both groups appear to present similar environmental behaviour regarding the sulphur content.
Out of the eight analysed groups, four can be regarded as containing the best-quality coal blend samples for energy generation: the two groups of lignite A (radioactive groups 3 and 4), and the magnetic groups 5 and 7 of lignite B. Group 3 has the highest quality, followed by group 4, group 5, and finally group 7. The group 3 coal blend samples can be identified as lignite type A coal with Igt values < 20 nGy/h. These samples have the highest CV and sulphur content, as well as the lowest ash and moisture content. The group 4 samples can be identified as lignite-type A coal with Igt values > 20 nGy/h. The samples of this last group and group 7 are characterized by the lowest sulphur content. The samples in group 5 can be identified as lignite type B coal with Igt < 20 nGy/h and k < 1 x 10⁻³ SI. Group 7 includes lignite type B coal samples, identified by Igt > 20 nGy/h and k < 1 x 10⁻³ SI.
Regarding the possible environmental pollution produced by the sulphur content of the coal, groups 4 and 7 are considered to have the best quality, followed by group 5, and finally group 3. Therefore, this analysis suggests obtaining coal blends that are included in these four groups, but preferably in groups 4 and 7, which would have high energy efficiency and cause minimum environmental pollution.
Proposal for preliminary selection of the best quality coal blends combining GS and k data
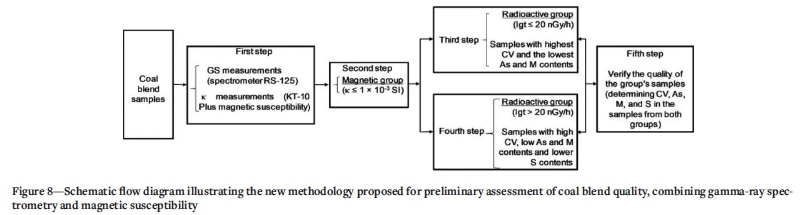
Based on this analysis and following the schematic flow diagram shown in Figure 2, a new methodology is proposed for preliminary selection of the best quality coal blends using only GS and k data. This methodology consists of five steps, proposed from the analysis of coal blend samples from the Sabinas Basin (Figure 8).
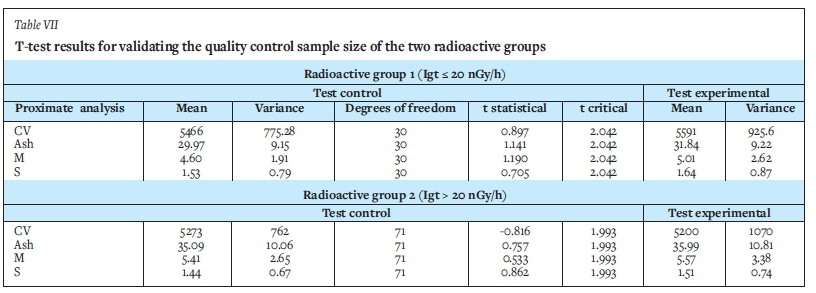
In the first step, GS and k measurements are made on coal blend samples using a handheld susceptibility meter and a spectrometer. The characteristics of the samples and the laboratory conditions described in the methodology section of this paper must be followed. In the second step, samples with k values < 1 x 10⁻³ SI are grouped (magnetic groups). This second step allowed a group with coal blend samples classified as lignite type A (groups 3 and 4) or lignite type B (groups 5 and 7) to be identified in the Sabinas Basin. In the third step, the magnetic group is classified using an Igt value < 20 nGy/h, and a new group is obtained which will be made up of only lignite A samples (group 3) and the best quality samples of lignite B (group 5) of the Sabinas Basin. Previous analyses indicate that the samples in this new group have the highest CVs and the lowest ash and moisture contents. In this basin, the samples classified as lignite A have CVs highest than 14, and ash and moisture contents less than 37 and 12 wt%, respectively. The lignite B samples have CVs greater than 2.5 and ash and moisture contents less than 74 and 24 wt%, respectively. In the fourth step, the last group is obtained, comprising the samples that not only have the described quality, but also the lowest sulphur content. The samples of this last group will have high energy efficiency, and the combustion process will cause less environmental pollution related to sulphur. To identify this last group, an Igt value > 20 nGy/h is applied to the sample group obtained in step two. This last group will be made up of lignite type A (group 4) and lignite type B samples (group 7) in such a basin. The lignite A samples have CVs higher than 14, andash, moisture, and sulphurS contents less than 49, 34, and 4 wt%, respectively. The lignite samples B have CVs greater than 1.38, andash, moisture, and sulphur contents less than 80, 27, and 7 wt%, respectively. To apply this methodology, the quality of both radioactive groups will be analysed (fifth step). This verifying is carried out by measuring CV, ash, moisture, and sulphur content in at least 10% of the total coal blend samples from both groups. The 10% is validated through the Student t-test (alpha= 0.5) in a control sample (see Table VII). For this verification, the samples must be classified as lignite A or B according to the CV. Subsequently, the CV and the ash, moisture, and sulpur contents are compared with the ranges previously established for the two radioactive groups. We suggest that the values from these four parameters should be within the ranges obtained in the Sabinas Basin.
Given that GS and k measurements with portable equipment are fast and cheap to make, with the help of this methodology it is possible to control the coal blending process. This can considerably reduce the amount of proximate analysis required and the determination of CV and total sulphur, but would not replace conventional methods that determine these parameters. Therefore, applying this methodology will have an economic impact because it will reduce the time and cost required for preliminary assessment of the quality of coal samples. Accordingly, it will have a significant impact on the conservation of the environment because it will allow sample groups that generate less ash and atmospheric pollution related to sulphur to be selected.
Conclusions
A new methodology is proposed for the preliminary assessment of the quality of coal blend samples' by combining gamma-ray spectrometry and magnetic susceptibility measurements using handheld equipment. Coal blend samples from the Sabinas Basin in Mexico were studied following the proposed method. From the radiometric and magnetic susceptibility data, sample groups with different quality ranges related toash, moisture, and total sulphur contents and CV values were obtained. These groups may have different combustion qualities during electricity generation, and a different environmental impact. Magnetic susceptibility values < 1 x 10⁻³ SI and total gamma intensity < 20 nGy/h group better-quality coal blend samples characterized by the highest CVs and lowest ash and moisture contents. Also, magnetic susceptibility values < 1 x 10⁻³ SI with total gamma intensity > 20 nGy/h group good-quality coal blend samples characterized by a low sulphur content. The samples from this group will generate less sulphur-related environmental pollution. This methodology does not replace the conventional methods of assessing coal quality but can help with quality control in the coal blending process. It can also contribute to reducing the volume of laboratory analysis.
Acknowledgements
We thank the Autonomous University of Coahuila, and particularly the Higher School of Engineering, for supporting this research.
References
Acikkar, M. and Sivrikaya, S. 2018. Prediction of gross calorific value of coal based on proximate analysis using multiple linear regression and artificial neural networks. Turkish Journal of Electrical Engineering and Computer Sciences, vol. 26, no. 5. pp. 2541-2552. doi: 10.3906/elk-1802-50 [ Links ]
ASTM D388-05. 2005. Standard classification of coals by rank. ASTM International, West Conshohocken, PA. [ Links ]
ASTM D5142-09. 2009. Standard test methods for proximate analysis of the analysis sample of coal and coke by instrumental procedures (withdrawn 2010). ASTM International, West Conshohocken, PA. [ Links ]
ASTM D5865-10a. 2010. Standard test method for gross calorific value of coal and coke. ASTM International, West Conshohocken, PA. [ Links ]
ASTM D4239-10e1. 2010. Standard test methods for sulfur in the analysis sample of coal and coke using high-temperature tube furnace combustion methods. ASTM International, West Conshohocken, PA. [ Links ]
Babek, O., Kalvoda, J., Aretz, M., Cossey, P.J., Devuyst, F., Herbig, H., and Sevastopulo, G. 2010. The correlation potential of magnetic susceptibility and outcrop gamma-ray logs at Tournaisian-Visean boundary sections in western Europe. Geologica Belgica, vol. 13. pp. 291-308. [ Links ]
Benko, T., Teichmann, C., Mizsey, P., and Jacob, D. 2007. Regional effects and efficiency of flue gas desulphurization in the Carpathian Basin. Atmospheric Environment, vol. 41, no. 38. pp. 8500-8510. doi: 10.1016/j.atmosenv.2007.07.018 [ Links ]
Bolortuya, D., Zusaan, P., Gustova, M.V., and Maslov, O.D. 2013. Study of the correlation between the coal calorific value and coal ash content using X-ray fluorescence analysis. Physics of Particles and Nuclei Letters, vol. 10, no. 7. pp. 723-726. doi: 10.1134/S1547477114010099 [ Links ]
Borsaru, M., Charbucinski, J., Eisler, P.L., and Youl, S.F. 1985. Determination of ash content in coal by borehole logging in dry boreholes using gamma-gamma ray. Geoexploration, vol. 23, no. 4. pp. 503-518. doi: 10.1016/0016-7142(85) 90077-8 [ Links ]
Carmichael, R.S. 1989. Practical Handbook of Physical Properties of Rocks and Minerals. 1st edn. CRC Press, Boca Raton, FL. [ Links ]
Clark, D.A. 1997. Magnetic petrophysics and magnetic petrology, aids to geological interpretation of magnetic surveys. AGSO Journal of Australian Geology & Geophysics, vol. 17, no. 2. pp. 83-103. [ Links ]
Corona-Esquivel, R., Tritilla, J., Benavides, M.E., Piedad-Sánchez, N., and Ferrusquí'a, I. 2006. Geología, estructura y composición de los principales yacimientos de carbón mineral en México. Boletín de la Sociedad Geológica Mexicana, vol. 57, no. 4. pp. 141-160. doi: 10.18268/bsgm2006v58nia5 [ Links ]
Dai, S. and Finkelman, R.B. 2017. Coal as a promising source of critical elements: Progress and future prospects. International Journal of Coal Geology, vol. 186. pp. 155-164. doi: 10.1016/j.coal.2017.06.005 [ Links ]
Duan, P., Wang, W., Sang, S., Tang, Y., Ma, M., Zhang, W., and Liang, B. 2018. Geochemistry of toxic elements and their removal via the preparation of high-uranium coal in southwestern China. Minerals, vol. 8, no. 3. doi: 10.3390/ min8030083 [ Links ]
Energy Information Administration (EIA). 2010. International Energy Outlook 2010. http://large.stanford.edu/courses/2010/ph240/riley2/docs/EIA-0484-2010.pdf [ Links ]
Energy Information Administration (EIA). 2019. International Energy Outlook 2019 with projections to 2050. https://www.eia.gov/outlooks/ieo/pdf/ieo2019.pdf [ Links ]
Finkelman, R.B., Dai, S., and French, D. 2019. The importance of minerals in coal as the hosts of chemical elements: A review. International Journal of Coal Geology, vol. 212. 103251. doi: 10.1016/j.coal.2019.103251 [ Links ]
Gasparotto, J. anD Da Boit Martinello, K. 2020. Coal as an energy source and its impacts on human health. Energy Geoscience, vol. 2, no. 2. pp. 113-130. doi: 10.1016/j.engeos.2020.07.003 [ Links ]
González-Sánchez, F., Puente-Solís, R., González-Partida, E., and Camprubi', A. 2007. Estratigrafía del Noreste de México y su relación con los yacimientos estratoligados de fluorita, barita, celestina y Zn-Pb. Boletín de la Sociedad Geológica Mexicana, vol. 59, no. 1. pp. 43-62. doi: 10.18268/bsgm2007v59n1a4 [ Links ]
Habib, Md.A., Basuki, T., Miyashita, S., Bekelesi, W., Nakashima, S., Phoungthong, K., Khan, R., Rashid, Md.B., Islam, Abu Reza, Md.T., and Techato, K. 2018. Distribution of naturally occurring radionuclides in soil around a coal-based power plant and their potential radiological risk assessment. Radiochimica Acta, vol. 107, no. 3. pp. 243-259. doi: 10.1515/ract-2018-3044 [ Links ]
Hassan, N.M., Kim, Y.J., Jang, J., Chang, B.U., and Chae, J.S. 2018. Comparative study of precise measurements of natural radionuclides and radiation dose using in-situ and laboratory g-ray spectroscopy techniques. Scientific Reports, vol. 8, 14115. doi: 10.1038/s41598-018-32220-9 [ Links ]
Hladil, J., Gersl, M., Strnad, L., Frana, J., Langrova, A., and Spisiak, J. 2006. Stratigraphic variation of complex impurities in platform limestones and possible significance of atmospheric dust: a study with emphasis on gamma-ray spectrometry and magnetic susceptibility outcrop logging (Eifelian-Frasnian, Moravia, Czech Republic). International Journal of Earth Sciences, vol. 95, no. 4. pp. 703-723. doi: 10.1007/s00531-005-0052-8 [ Links ]
Hower, J.C., Dai, S., and Eskenazy, G. 2016. Distribution of uranium and other radionuclides in coal and coal combustion products, with discussion of occurrences of combustion products in Kentucky power plants. Coal Combustion and Gasification Products, vol. 8. pp. 44-53. [ Links ]
International Atomic Energy Agency (IAEA). 2003. Guidelines for radioelement mapping using gamma ray spectrometry data. IAEA-TECDOC-1363. https://www-pub.iaea.org/mtcd/publications/pdf/te_1363_web.pdf [ Links ]
Jingchao, Z., Kotani, K., and Salto, T. 2019. Low-quality or high-quality coal? Household energy choice in rural Beijing. Energy Economics, vol. 78. pp. 81-90. doi: 10.1016/j.eneco.2018.11.005 [ Links ]
Kayal, J.R. and Das, L.K. 1981. A method of estimating ash content of coal from combined resistivity and gamma-ray logs. Geoexploration, vol. 19, no. 3, pp. 193-200. doi: 10.1016/0016-7142(81)90003-X [ Links ]
Khalil, I., Islam, F., and Akon, E. 2011. Nuclear geophysical logging for Gondwana coal exploration: a case study at Phulbari Coal Basin, northern part of Bangladesh. Arabian Journal of Geosciences, vol. 6, no. 5. pp. 1647-1655. doi: 10.1007/s12517-011-0484-3 [ Links ]
Kierczak, J. and Chüdy, K. 2014. Mineralogical, chemical, and leaching characteristics of coal combustion bottom ash from a power plant located in northern Poland. Polish Journal of Environmental Studies, vol. 23, no. 5. pp. 1627-1635. [ Links ]
Lam, E.J., Carle, R., González, R., Montofré, I.L., Veloso, E.A., Bernardo, A., Cánovas, M., and Alvarez, F. A. 2020. Methodology based on magnetic susceptibility to characterize copper mine tailings. Minerals, vol. 10. 939. doi: 10.3390/min10110939 [ Links ]
Li, Y., Zhang, J., Wang, G., Qiao, J., and Liang, W. 2019. Effect of coal blending on ash fusion behavior for blast furnace injection of high calcium bituminous coal. Energy Science & Engineering, vol. 7, no. 6. pp. 3332-3343. doi: 10.1002/ ese3.504 [ Links ]
Liu, B., Wang, J., He, H., Mishra, V., Li, Y., Wang, J., and Zhao, C. 2020. Geochemistry of Carboniferous coals from the Laoyaogou mine, Ningwu coalfield, Shanxi Province, northern China: Emphasis on the enrichment of valuable elements. Fuel, vol. 279. 118414. doi: 10.1016/j.fuel.2020.118414 [ Links ]
Marinov, S.P., Stefanova, M., Stamenova, V., Carleer, R., and Yperman, J. 2005. Sulphur functionality study of steam pyrolyzed "Mequinenza" lignite using reductive pyrolysis technique coupled with MS and GC/MS detection systems. Fuel Processing Technology, vol. 86, no. 5. pp. 523-534. doi: 10.1016/j. fuproc.2004.04.003 [ Links ]
Martin, A.P., Ohneiser, C., Turnbull, R.E., Strong, D.T., and Demler, S. 2018. Soil magnetic susceptibility mapping as a pollution and provenance tool: an example from southern New Zealand. Geophysical Journal International, vol. 212. pp. 1225-1236. doi: 10.1093/gji/ggx484 [ Links ]
Minera Carbonífera Río Escondido, S.A. de C.V. (Micare) 1982. Carbón mineral y electricidad en México. Dirección de Relaciones Publicas MICARE. Publicación Especial. 54 pp. [ Links ]
Munawer, M.E. 2018. Human health and environments impacts of coal combustion and post-combustion wastes. Journal of Sustainable Mining, vol. 17, no. 2. pp. 87-96. doi: 10.1016/j.jsm.2017.12.007 [ Links ]
Muñoz-González, A.V. 2015. Susceptibilidad magnética y radioactividad gamma natural en muestras de carbón de la Cuenca de Sabinas. Bachelor's thesis. Autonomous University of Coahuila. Mexico. [ Links ]
Noble, A., and Luttrell, G.H. 2015. A review of state-of-the-art processing operations in coal preparation. International Journal of Mining Science and Technology, vol. 25, no. 4. pp. 511-521. doi: 10.1016/j.ijmst.2015.05.001 [ Links ]
North, B., Engelbrecht, A., and Oboirien, B. 2015. Feasibility study of electricity generation from discard coal. Journal of the Southern African Institute of Mining and Metalurgy, vol. 115. pp. 573-580. doi: 10.17159/2411-9717/2015/v115n7a3 [ Links ]
Olivella, M.A., Palacios, J.M., Vairavamurthy, A., del Rio, J.C., and de las Heras, F.X.C. 2002. A study of sulphur functionalities in fossil fuels using destructive (ASTM and Py-GC-MS) and non-destructive (SEM-EDX, XANES and XPS) techniques. Fuel, vol. 81, no. 4. pp. 405-411. doi: 10.1016/S0016-2361(01)00198-3 [ Links ]
Oney, O. 2020. The significance of using lignite as a fuel in electricity generation in Turkey and its application facilities in clean coal technologies. Energy Sources, Part A: Recovery, Utilization, and Environmental Effects, vol. 42, no. 1. pp. 17-30. doi: 10.1080/15567036.2019.1587051 [ Links ]
Padilla y Sánchez, R.J. 1986. Post-Paleozoic tectonics of northeast Mexico and its role in the evolution of the Gulf of Mexico. Geofísica Internacional, vol. 25, no. 1. pp. 157-206. [ Links ]
Parzentny, H.R. and Róg, L. 2019. The role of mineral matter in concentring uranium and thorium in coal and combustion residues from power plants in Poland. Minerals, vol. 9. 312. doi: 10.3390/min9050312 [ Links ]
Pehlivanli, B.Y., Kog, ((., Sari, A., and Engin, H. 2014. Factors controlling low uranium and thorium concentrations in the ((ayirhan bituminous shales (((BS) in the Beypazari (Ankara) area, Turkey. Acta Geologica Sinica, vol. 88, no. 1. pp. 248-259. doi: 10.1111/1755-6724.12195 [ Links ]
Rasheed, M.A., Srinivasa-Rao, P.L., Boruah, A., Zaheer-Hasan, S., Patel, A., Velani, V., and Patel, K. 2015. Geochemical characterization of coals using proximate and ultimate analysis of Tadkeshwar coals, Gujarat. Geosciences, vol. 5, no. 4. pp. 113-119. doi: 10.5923/j.geo.20150504.01 [ Links ]
Rivera-Martínez, J.C. and Alcocer-Valdés, C. 2003. La situación actual del aprovechamiento del carbón en el estado de Coahuila. Boletín Técnico del Consejo de Recursos Minerales, vol. 9, no. 54. pp. 2-19. [ Links ]
Ruan, R., Tan, H., Wang, X., Li, Y., Li, S., Hu, Z., Wei, B., and Yang, T. 2018. Characteristics of fine particulate matter formation during combustion of lignite riched in AAEM (alkali and alkaline earth metals) and sulfur. Fuel, vol. 211. pp. 206-213. doi: 10.1016/j.fuel.2017.08.114 [ Links ]
Schon, J.H. 2011. Physical properties of rocks. Handbook of Petroleum Exploration and Production, vol. 8. 1st edn. Elsevier, Oxford, UK. [ Links ]
Speight, J.G. 2005. Handbook of Coal Analysis. 1st edn. Wiley, Hoboken, NJ. [ Links ]
Swaine, D.J. 1990. Trace Elements in Coal. 1st edn. Butterworths, London. doi: 10.1016/C2013-0-00949-8 [ Links ]
Taole, R.L., Falcon, R.M.S., and Bada, S.O. 2015. The impact of coal quality on the efficiency of a spreader stoker boiler. Journal of the Southern African Institute of Mining and Metalurgy, vol. 115. pp. 1159-1165. doi: 10.17159/2411-9717/2015/v115n12a3 [ Links ]
Thomas, L. 1992. Handbook of Practical Coal Geology. 1st edn. Wiley, New York. [ Links ]
Thomas, L. 2013. Coal Geology. 2nd edn. Wiley-Blackwell, Oxford, UK. [ Links ]
YorükoGlu, M. 2017. Coal blending for thermal power stations. Mining, vol. 56, no. 3. pp. 109-116. [ Links ]
Yusefi, A. and Ramazi, H.R. 2019. A programming method to estimate proximate parameters of coal beds from well-logging data using a sequential solving of linear equation systems. Journal of Mining sand Environment (JME), vol. 10, no. 3. pp. 633-647. doi: 10.22044/JME.2019.7702.1633 [ Links ]
Zhang, Z.P., Peng, J.L., and Zou, Z.Y. 2013. Determination of total sulfur in coal. Clean Coal Technology, vol. 19, no. 6. pp. 43-46. [ Links ]
 Correspondence:
J.A. Alberto Batista
Email: josebatista@uadec.edu.mx
Received: 5 Nov. 2020
Revised: 10 Feb. 2022
Accepted: 18 Feb. 2022
Published: April 2022

