


Services on Demand
Article
 English (pdf)
 Article in xml format
 Article references
Indicators

Related links
-
 Cited by Google
 -
 Similars in Google
Share

 Permalink
Journal of the Southern African Institute of Mining and Metallurgy
On-line version ISSN 2411-9717
Print version ISSN 2225-6253
J. S. Afr. Inst. Min. Metall. vol.122 n.4 Johannesburg Apr. 2022
http://dx.doi.org/10.17159/2411-9717/1509/2022
PROFESSIONAL TECHNICAL AND SCIENTIFIC PAPERS
An integrated approach to panel width, fleet size, and change-out time optimization in room-and-pillar mines
A. AnaniI; W. NyaabaII; E. CordovaIII
IDepartment of Mining and Geological Engineering, University of Arizona, Tucson, USA. https://orcid.org/0000-0001-9125-6877
IIChicago, Illinois, USA. https://orcid.org/0000-0002-8360-412X
IIIDepartment of Mining Engineering, Pontificia Universidad Católica de Chile, Santiago, Chile. https://orcid.org/0000-0002-9187-4461
SYNOPSIS
Optimization of panels, haulage fleet, and waiting area involves deterministic and low-fidelity methods and experiential knowledge. The process is challenging because coal recovery and operational capabilities must be considered in the solution. The approach in this manuscript comprises the development of an integrated stochastic simulation model of a coal room-and-pillar system that addresses these challenges. The decision variables evaluated are panel width, number of shuttle cars, and change-out time (COT). The results show that the mine should implement the shortest possible COT, decreasing the cycle time and thereby increasing productivity and continuous miner (CM) utilization. The highest productivity and CM utilization for a fleet size of three shuttle cars is found in the 15-entry panel width. For the evaluated fleet sizes, the 19-entry panel width is optimal for the four and five shuttle cars. Among the three variables studied, panel width and fleet size had the most significant effects (5% increase) on the CM productivity, cycle time, and utilization.
Keywords: Discrete event simulation. change-out time, panel width, room-and-pillar, fleet size, productivity.
Introduction
Optimization of operations involves reduction of the uncertainty surrounding measurable field parameters, which are especially important for mine-planning purposes. Current mine planning tools adapt decision-making for sections of the mine (spatially limited) without considering interactions with other sectors. In addition, there are limitations in intersecting short-, medium-, and long-term planning within these tools, which further limits their applicability. As a result, the need for integrated tools that optimize the decision-making process for the changing parameters in all sections of a mine is pertinent (Upadhyay and Askari-Nasab, 2018).
The complexity of most mining systems and computational limitations make creating an integrated tool close to impossible. For example, scheduling in continuous mining systems typically involves the definition of (i) the extraction sequence, (ii) the haulage equipment route given underground spatial restrictions, and (iii) the dumping operations which follow over time (Shishvan and Benndorf, 2019). Short-term planning should comply with strategic plans, meet the processing plant requirement for quality and quantity, and maximize the use of equipment. Maximizing equipment usage is an optimization problem involving other decision variables such as (i) travel distance/time, (ii) loading rate, (iii) availability, (iv) fleet size, (v) change-out time, (vi) panel dimensions, (vii) dumping schedules, and (viii) cutting sequence. Each of these factors has some effect on production. In room-and-pillar mining, shuttle cars and CMs depend heavily on one another. The travel time of the CM between cuts can account for 10% of the productive time, leaving shuttle cars idle during the transition period between cuts, therefore under-maximizing their utilization (Anani et al., 2019). In addition, the cut sequence and panel width significantly affect CM travel times (Mishra, Sugla, and Singha, 2013) as a sub-optimal sequence results in longer travel times. The interaction and sheer magnitude of parameters make the decision-making far from rudimentary.
The focus of this study comprises the integration of long-term planning - specifically panel dimension - with short-term scheduling by optimizing the CM cut sequence, panel width, waiting area design, and fleet size selection. The paper also presents the modelling techniques for a room-and-pillar production system with integrated cut sequence, haulage road network for different panel widths, and an external auxiliary systems interface for operational decisionmaking. A vital aspect of the model is its representation of variable panel widths based on cut sequence, haulage networks, distances, and cycle times. The authors built a discrete event simulation model of the room-and-pillar production system, evaluating these parameters and their effects on equipment utilization, cycle times, and production rate. This research
> Presents the first multiple-objective stochastic optimization approach that determines the optimal panel width, fleet size, and change-out time for coal room-and-pillar operations
> Combines the long-term planning of panel and fleet selection with cut sequencing, panel productivity, and equipment utilization
> Contributes to eliminating the lack of integrated decision-making tools for underground coal operations.
The succeeding sections cover the background, system description, input modelling, model construction, experimental analysis, and analysis of results.
Background
In room-and-pillar mining, the change-out time (COT) is an important operational parameter. COT is defined as the time required to move a loaded car away from the cut face and replace it with an empty car (Hirschi, 2012). The intersection where empty and loaded cars cross paths is known as the change-out point (COP). The distance between the COP and the cut face is known as the change-out distance (COD). Arguably, this is not the most accurate measure of the COD as the cars travel from the back of the CM and not the cut face; the back of the CM is a moving point. The COD is measured based on mining geometry, and as such, the authors use the COT in this paper for convenience and accuracy. The total COT for a cut depends on (i) cut volume, (ii) number of shuttle cars, and (iii) shuttle car capacity (Hirschi, 2012).
Given the travel restrictions of narrow haul roads, change-out delays are inherent. A change-out delay starts when a loaded car leaves the CM and lasts until the next empty car arrives to be loaded. The CM operator cuts the coal and fills the pan during the delay, and no loading occurs. Although delays cannot be eliminated, they can be minimized by the proximity of the COP to the face, maximizing shuttle car capacity, reducing panel dimension, changing the routing strategy of the shuttle cars, or spotting at the COP (Hirschi, 2012). Studies have shown that the capacity of the haulage unit has the most impact (up to 50% increase in production), which is expected since the haulage unit size directly affects the overall productivity of the system and equipment utilization (Chugh, 2003; Hirschi et al., 2004). Other factors such as ventilation barriers (curtains), road conditions, haulage car speed, and completion of crosscuts can significantly impact the change-out delay (Segopolo, 2015).
Crosscuts are used by haulage equipment to travel to and from the CM. Therefore, the completion of each crosscut creates a COP that is closer to the cut face, thereby reducing the CODs. The crosscut centres must be planned carefully as they establish the CODs. The completion of crosscuts in a panel ensures uniform advance, which minimizes CM travel distances between cuts. Therefore, it is recommended that cuts that deepen entries, rather than completing crosscuts, should be avoided. However, other studies have shown that the total time spent cutting by the CM, instead of travelling, can be increased by deepening the cut-out distance given geotechnical restrictions (Anani et al., 2019).
Very few studies can be found that consider COD as an important parameter in room-and-pillar mining. However, COD is important because moving the COP back by one crosscut results in a production loss of 3.5% for a mine operating with cable haulage units (Segopolo, 2015). For these operations, haulage units and routes are limited since a car cannot cross the cable. This restriction results in long change-out delays and 'wait-no-car' delays. This research demonstrates the importance of optimizing the COT alongside other operating parameters. Other researchers indicate that even in the optimum production systems, 15-25% of the production time available is lost to change-out delays, thus indicating the importance of minimizing this delay (Anani et al., 2019; Stefanko,i983; King and Suboleski,i99i).
A 'wait-no-car' delay occurs when no cars are available at the COP to be loaded (Segopolo, 2015). Most operations can eliminate this delay by maintaining enough shuttle cars in the system so that an empty car is always waiting at the COP. However, this does not always benefit the operation regarding equipment utilization (Anani, Awuah-Offei, and Hirschi, 2017). Other alternatives to minimize this delay include keeping the dump point close to the cut face to decrease haul distances, and optimizing mine planning in terms of entry spacing and the number of entries. The delay may be reduced by increasing the fleet size; however, this may result in congestion, long waiting times for haulage equipment, reduced utilization, and lower productivity (Anani, Awuah-Offei, and Hirschi, 2017). The 'wait-no-car' delay is modelled as part of the total COT in this study and is used to demonstrate the importance of fleet size selection in later sections of this paper.
Panel and barrier pillar design is an essential part of mine planning when adopting the room-and-pillar method. The shape and size of the panel depend on the support requirement of the overlying strata (Luo, 2015; Yu et al., 2017). The stability of the panel and the dimension of the pillars within it have received much attention over the years (Ghasemi, Ataei, and Shahriar, 2014; Napa-García, Câmara, and Torres, 2019; Tzalamarias et al., 2019). Research specifically considers the surface impact of room-and pillar-mining, such as surface subsidence. Surface subsidence occurs due to the gradual deterioration and settlement of the overlying rock mass caused by stress redistribution (Salmi, Nazem, and Karakus, 2017). However, there are very few works in the literature and in practice that use an integrated approach to determine the optimal panel width and other operational parameters to maximize production, equipment utilization, safety, and reduce cost. The panel width significantly impacts the CM cycle time and, consequently, productivity, with large panels incurring longer travel times, especially if the cut sequence is not optimized (Anani and Awuah-Offei, 2017). On the other hand, the size of the panel determines the optimal fleet size. Excessive haulage equipment in a small panel can result in longer wait times even if it eliminates the 'wait-no-car' delay. Conversely, a larger panel may result in longer travel times when a smaller fleet size is used (Anani, Awuah-Offei, and Hirschi, 2017). Mine operators are usually reluctant to implement certain panel dimensions due to the impact on coal recovery. Then again, they do not have access to an integrated tool that allows them to evaluate the effect of panel width on cost, productivity, and resource utilization in relation to recovery.
Case study
Data collection and input modelling
Stochastic simulation has been extensively used to evaluate the performance of complex systems in many applications (Dindarloo, Osanloo, and Frimpong 2015; Zeng, Baafi, and Walker, 2019). However, the modelling of overly complex systems can be very risky, especially when there is inadequate information about the system logic. An attempt to approximate the system logic and stochastic processes (through input modelling) can result in modelling risks (Zeng, Baafi, and Walker, 2019). Expert opinions are often used in mining to minimize this risk.
The mining system evaluated is of an underground room-and-pillar coal mine in Illinois, USA. The mine uses a super-section in which two CMs are deployed to mine a single panel. The coal is loaded with battery-operated shuttle cars, which haul the coal to a belt feeder. A time-and-motion study was performed at the mine for two days to collect the shuttle car cycle time data for the evaluated system. The shuttle cars did not have any internal data collection system to record the cycle time and payload data. Weekly summaries of the CM's unit production performance were obtained from the Joy Global Smart Service System and used as input data. The optimal production sequence of the CM for different panel widths is also incorporated as input data (Hirschi, 2012). The CM sequence used was generated based on ventilation and geotechnical requirements, the interaction of the CM with the roofbolting crew, and the total distance to be travelled within each panel. The haulage unit routing strategies for the different panel widths were also evaluated. The distance between each cut face and the feeder breaker in each sequence is different. Based on the routing rules provided by the mine, the geometric distance between each cut and the feeder was calculated. The travel time is thus presented as a function of the speed and distance travelled by the shuttle cars.
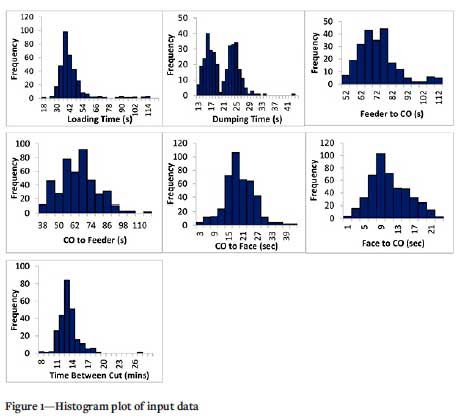
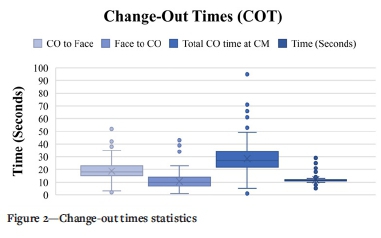
The total and accurate COT is used to account for the 'wait-no-car' delay in the COD analyses. This COT is measured from the time loading stops to the moment an empty car arrives at the face. Figure 1 shows histogram plots of the input data after outlier screening. The COTs were evaluated for their magnitude and range (Figure 2). For the studied mine, the COD is at most two crosscuts away from the active face. Thus, the COT from the cut face to the COP is less than thirty seconds on average. However, as indicated previously, the 'wait-no-car' delay will be considered part of the COT and illustrated as the total change-out time in the box and whisker plot shown in Figure 2. The analysis of the optimal fleet size for the system is enabled by incorporating the 'wait-no-car' delay.
Correlation testing
Input modelling in stochastic simulation is the selection of a probability distribution to capture the uncertainty surrounding a variable in a system. Researchers make two inherent assumptions when selecting a probability distribution (Que, Anani, and Awuah-Offei, 2016). The first assumption considers that a certain family of distributions, such as normal and Weibull distributions, can represent the uncertainty of a stochastic variable. In the second assumption, each observation of an input variable is independent of observations of other input variables and other observations of the same variable.
Historically, mining variables have been adequately represented by the existing library of probability distributions (such as the normal distribution).
Correlation testing is used to test independence between two or more variables. The most common methods of correlation testing include Pearson, Spearman, and Kendall correlation coefficients. The Spearman correlation test is used in place of the Pearson and Kendall tests that assume normality, linearity, and ordinality to account for the input correlation between variables. The Spearman correlation test enables the evaluation of monotonic relationships, which is typical of mine parameters.
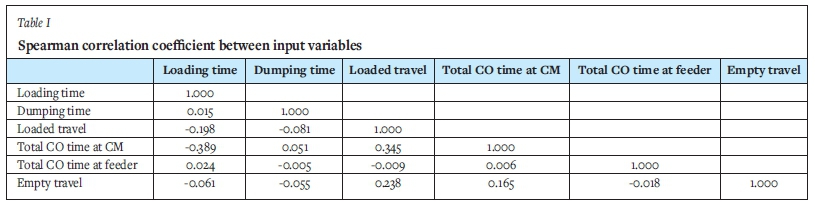
Since there is insufficient data for the payload, correlation testing is only done for the cycle time data. The independence testing uses Palisade @Risk software, which calculates the Spearman rank correlation coefficients. Table I shows the correlation coefficients between the input variables. From the results in Table I, there is no significant correlation (< 0.5) between the variables. The highest correlation coefficients are between the iotal COT at the CM with loading time and loaded travel time. It could be explained that higher loading times result in higher payloads, which inversely affects the shuttle car travel times. However, the correlation coefficient between the loading time and loaded travel time is only -0.198, and there is insufficient payload data to confirm this conclusion. Thus, the system's variables are modelled as independent of each other.
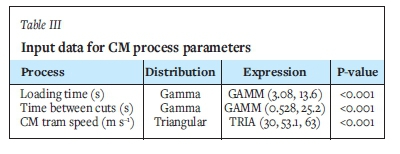
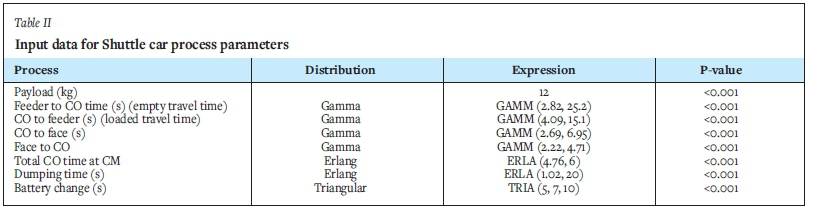
Goodness-of-fit tests such as the Anderson-Darling and Kolmogorov-Smirnov tests and plots such as the probability plots and density-histogram plots are standard methods for verifying how well a distribution captures the key properties of the input data. If the test can successfully find a theoretical distribution, the assumption is valid. Chi-squared goodness-of-fit tests and Kolmogorov-Smirnov tests are used (via Arena's Input Analyser) to fit theoretical distributions to the CM and shuttle cycle time (Tables II and III). These distributions are then used to describe stochastic processes in the Arena® simulation model (Arena, 2010). The variables are modelled with univariate distributions since the correlation is weak.
System description and model construction
The objective is to construct a discrete event simulation model representative of the production system of a room-and-pillar coal mine. The simulation comprises the CM cutting sequence, loading process, shuttle car routing, material haulage, and dumping. A process-oriented simulation approach is adopted and simulated using the Arena Rockwell® software. The approach is based on viewing the simulation in terms of the experience of entities that flow through a system.
Production across the entire panel width is evaluated with a depth of six crosscuts. The dimensions are selected based on the advancement of the production and auxiliary systems such as the conveyor belt. The conveyor belt feeder is moved forward three crosscuts after an advancement of six crosscuts. Thus, the shortest distance between the cut face and the belt feeder is three crosscuts. The mine adopts a traditional approach to extracting the panel by first extracting the centre 13 entries of the panel in a south to north direction and then mining the flanks of the panel perpendicular to the initial direction. The mine also implements a super-section approach in which a panel is mined with two CMs, each assigned a fleet of shuttle cars.
The haulage units are battery-operated shuttle cars. The batteries are changed once a shift, usually in turn, to ensure continuity of the extraction process. The CM operator must follow a predefined cut sequence to extract the coal. The optimal predefined cut sequence used in this model was developed by Hirschi (2012). The modelling is under the assumption that the operator always follows the sequence. During the transition between cuts, all excavations are halted in this part of the panel to move the CM
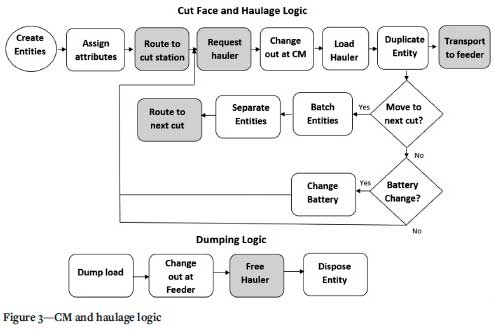
During the time and motion study of the production system at the mine, the most common delay observed was the pick change time for the CM. The authors did not have enough failure information to include the delay in the modelling construct. The conveyor belt failure was another aspect observed during the shift study. Figure 3 shows a simple logic used to construct the model. Once the data analysis and input modelling are complete, the Arena® interface is used to model the production system. In each cycle, Arena® implements the Linear Congruential Generator (Equation [1]) and built-in functions to generate random variates from distributions representative of each variable, assuming the variables are independent and identically distributed.
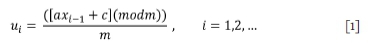
x1-1is the initial seed
a is a multiplier
c is an increment
m is the modulus, all of which are chosen carefully to ensure truly random numbers (u).
The Arena® simulation construct requires defining entities (objects that flow through the model) passing through processes, capturing resources, and implementing time delays. The coal loads are modelled as entities with defined attributes, parameters, and system variables. The Create module in Arena® is used to create a fixed number of entities (see 'Create Entities' node in Figure 3). The entity (coal load), once loaded, is transported to the feeder and then goes through the dumping logic to leave the system. The entity is duplicated (by the 'Duplicate Entity' node) using Arena's Duplicate module prior to transporting it to the feeder to ensure that coal loads are always available at the active cut face. Note that the duplicate entity has the same attributes as the original entity. The duplicate entity is routed back to the cut face to be loaded. If the amount of coal at the active cut face is exhausted, the duplicate entity is routed to the next cut (see 'Move to next cut?' node in Figure 3); otherwise, it is determined if a battery change is required before it gets routed to a cut face. The CM and feeder breaker are modelled as resources for loading and dumping processes, respectively. Each of the cut faces in the defined CM sequence is modelled as a station with a defined network and network links used by the CM to travel from cut to cut and from a cut to the feeder breaker. The shuttle cars are modelled as transporters for transporting the entities.
Three logics are implemented, including that of the CM on the left side of the panel, the CM on the right of the panel, and the feeder breaker logic to implement the production system along the entire panel width. For example, in the 13-entry panel width, the CM on the left cuts 116 cuts, and the CM on the right cuts 110 cuts across six crosscuts. All 226 cuts are defined as stations, and the distance between the cuts and the distance between each cut and feeder breaker is defined, resulting in 676 network links between stations for the 13-entry panel alone. The process is repeated for all panel widths evaluated. The model also implements a single battery change logic during an 8-hour shift. The shuttle cars are batched together and routed to the next cut station using the distance between cuts and the CM's travelling speed to ensure no loading occurs during the transition between cuts. The transfer of entities in the model uses Arena's Route and Transport modules. The system is modelled using a terminating simulation approach.
The built-in Linear Congruential Generator functionality of the Arena Rockwell® simulation software is used for the random number generation and Monte Carlo simulations in this study. The problem is an optimization problem that can be expressed mathematically as follows:
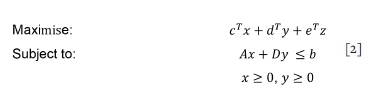
where x, y, z are vectors of decision variables (i.e., panel width represented by the number of entries, fleet size, and change-out distance/time), b, c, d, e are vectors of known coefficients, and A and D are known matrices of coefficients in the inequalities
The inequalities are constraints posed by the operation, such as the feasible panel dimensions, fleet size, and CODs, that can be evaluated given geotechnical, operational, and ventilation requirements. Given the complex nature of the production system, a numerical solution approach is ideal to avoid the need for oversimplifying assumptions.
Verification and validation
The constructed model is verified and validated with animations and multiple output variables. For model verification, the authors used a white and black box modelling construct based on the shifts studied and performed face validity and parameter verification testing. The authors also compared the number of cuts visited in an 8-hour shift in the simulation with that studied in the real system. An animation of all the cuts in the sequence was made, including the feeder breaker, which is also modelled as a station. The animation permitted the verification that the entities follow the defined sequence. Other verification initiatives included animating the batch module in Arena® to ensure the transfer of the entire haulage unit from cut to cut.
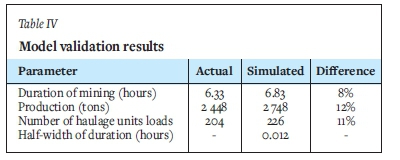
For the model validation, the authors also recorded the tonnage (in short tons) produced in each cut to ensure that it was within a reasonable range. The model was also validated using expert opinion and a trace-driven approach based on output data collected from the studied shifts. Table IV shows the results of the validation experiments. The model is deemed valid for further experimental analysis.
Experimental analysis
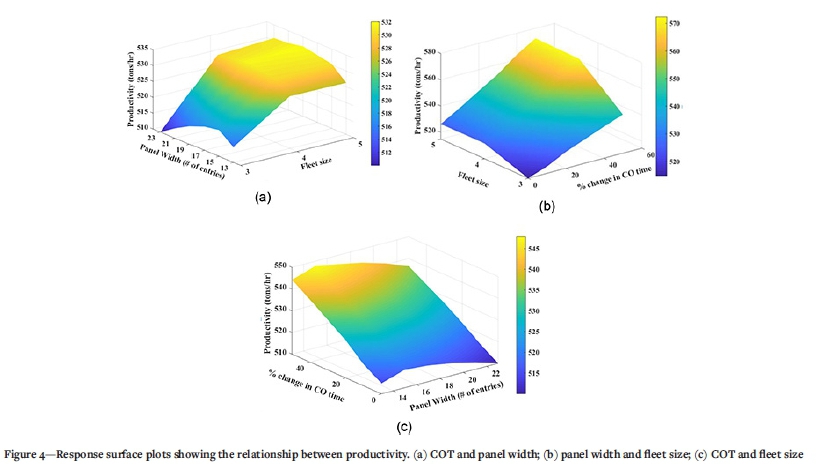
The design and analysis of simulation experiments involves trying different input parameter values to understand the output variables' behaviour. A response surface plot is used for preliminary experimental analysis to evaluate the sensitivity of the output variables to the input parameters and define each parameter's experimental level (Hunt, 1980). Figure 4 shows a three-dimensional response surface of productivity as a function of different combinations of COT, panel width, and fleet size. The plots are constructed using MATLAB's statistical toolbox. The relationship between the panel width and fleet size is evaluated for a 0% change in COT (Figure 4a). Secondly, the relationship between the fleet size and COT is evaluated for the 13-entry panel width (Figure 4b). Finally, the relationship between the panel width and COT is evaluated for a fleet size of three (Figure 4c).
From the plots, decreasing the fleet size beyond three and increasing it above five for the panel widths evaluated will not improve productivity (Figure 4a). It can also be noted that an optimal number of fleet sizes for each panel width exists (Figure 4a). The plot shows that a further decrease in the COT will likely continuously increase productivity regardless of the fleet size and panel width used (see Figures 4b and 4c). However, due to equipment congestion, productivity may decrease with a further decrease in COT, as shown in Figure 4b. A further decrease in COT is also limited by the practicality of the CO distance employed by the operation.
Based on the results and expert opinion (mine's personnel), the following levels (Table V) of each experimental factor are chosen. Although reducing the COT to half its value may not be practical for the modelled system, the authors included such extreme points to iterate the effect of COT on production rate and equipment utilization (sensitivity analysis). Six experimental levels are used for the COT and panel width. The levels of the COT are represented as the percentage decrease in the sampled parameter value. The COT is varied from the original value (0% decrease) to a 50% decrease. This represents bringing the COP closer to the cut face in practice. The minimum and maximum panel widths evaluated are that of 13 entries and 23 entries, respectively. The full width of the panel is mined in six crosscut increments. The larger panels (with widths greater than 13 entries) are mined by first advancing the centre of the panel ahead of its flanks.
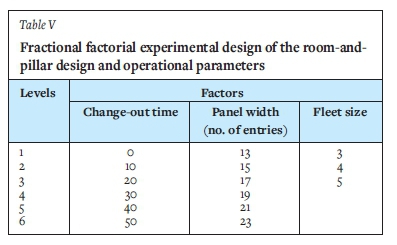
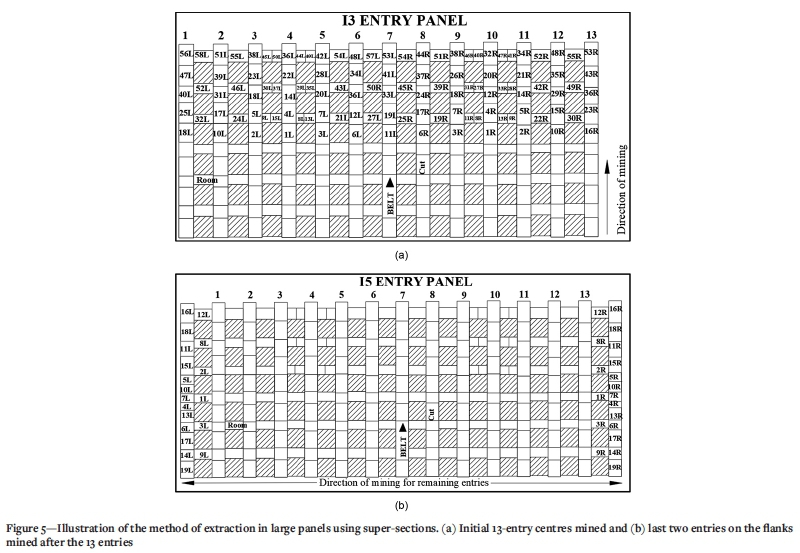
The mine has experimented with different panel widths and mining sequences. Currently, the strategy of advancing the central 13 entries before mining rooms on the flanks is the most common. Therefore, for the 15-entry panel, it first mines the centre 13 entries (Figure 5a) and then mines the remaining two entries on the flanks of the panel perpendicular to the direction of advance (Figure 5b). For a panel width of 23 entries, the centre 13 entries are initially mined across six crosscuts, followed by the remaining ten entries on its flanks. The model is developed based on the existing geotechnical mine plan and requirement, so geotechnical factors (panel dimensions and pillar design) were not varied as experimental factors. The selected factors were validated with the mine's engineers to ensure geotechnical and ventilation compliance. Only three levels of the fleet size are included in the experiment. These levels were selected based on the surface plot, opinions of the mine's personnel, and the current fleet size used. Overall, 108 (6 x 6 x 3) experimental runs are performed.
Results and discussion
Once the simulation experiment was completed, statistical analysis was performed to determine the optimal values of the decision variables given operational constraints. Around 108 experimental scenarios were evaluated, and each scenario ran 150 times. The number of replications is selected such that the half-width is less than 1% of the average value of the output variable. Figures 6-8 show the production (Figures 6a, 7a, and 8a), productivity (Figures 6b, 7b, and 8b), CM utilization (Figures 6c, 7c, and 8c), and shuttle car cycle times (Figures 6d, 7d, and 8d) for each scenario analysed. In each figure, the number of shuttle cars is held constant while the panel width and COT are varied.
The trends in Figures 6-8 are similar for each output variable. As expected, decreasing COT increases production and productivity significantly (Figures 6a-b, 7a-b, and 8a-b). This is because the overall cycle time is reduced, which is demonstrated by the cycle time plots (Figures 6c, 7c, and 8c). Figure 6 shows the results of mining the different panel widths with three shuttle cars and variable COTs on the output variables. It is clear from the results that the 15-entry panel width is optimal for each level of the COTs. The increase in CM utilization is more prominent as the COT decreases (Figure 6d), revealing a decrease in CM wait times. The results in Figure 6 suggest that the high cycle times and low productivity (8.4 minutes and 514.80 tons per hour, respectively) in the 13-entry panel may be caused by long shuttle car waiting times (Figures 6b and 6c). In contrast, productivity in larger panels such as the 21-entry and 23-entry (513.09 tons per hour and 510 tons per hour) panels is lower than that of the 13-entry panel due to longer travel distances (Figure 6b). This fact is illustrated further by the high cycle time and low CM utilization shown in Figures 6c-d.
In Figures 7 and 8, a similar trend is seen, with the 19-entry panel width yielding the highest productivity among all the panel widths. The longer travel distance in a larger panel width reduces with an increase in fleet size, thereby increasing the CM utilization (Figures 7d and 8d). For four and five shuttle cars, the productivity and CM utilization in larger panels surpass that in smaller panels, contrary to a fleet size of three (Figures 6, 7, and 8). It can be noted from Figures 6, 7, and 8 that the change in COT does not affect the choice of optimal panel width based on the output variables. Therefore, for a fleet size of three shuttle cars, a panel width of 15 entries yields the highest productivity (Figure 6b). Although this may be true for the mine studied, the changes in COTs are a matter of seconds (14 seconds on average for a 50% decrease). The COTs in the magnitude of minutes may have a more severe impact.
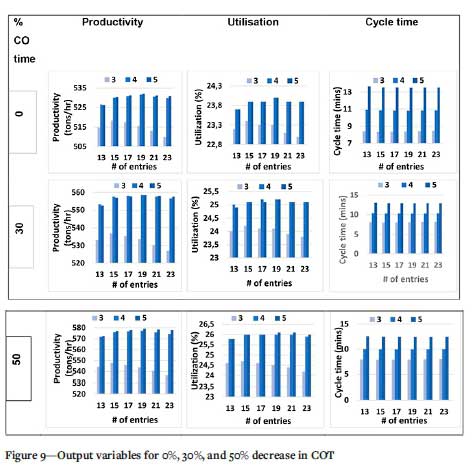
Further analysis was performed to evaluate the relationship between panel width and fleet size for different changes in COT (Figure 9). The results in Figure 9 show a significant difference in the output variables for a 0%, 30%, and 50% decrease in COT. The difference in cycle time among variable fleet sizes decreases with a further reduction in COT. There is a significant difference (up to 5%) in the output variables when the number of cars increases from three to four; however, there is hardly any difference (up to 0.6%) with an increase from four to five cars. The cycle time plot (Figure 9) shows a more distinct trend with varying COTs. Although cycle time decreases with decreasing COT as expected, the difference in cycle time for varying fleet sizes becomes more pronounced (compare 0% with 30%) as COTs change.
A Bonferroni (one-way ANOVA) test was performed to establish the statistical significance of the productivity variable (assuming normality) for all fleet sizes in the 13-entry panel. The null hypothesis was rejected because not all means are equal at a 0.05 significant level. Given the slight difference between the four and five shuttle car results, a t-test was also performed to compare the productivity variable. The mean productivity values for the four and five fleet sizes are equal at 0.05 significant level. Although this is true for a 0% decrease in COT, a very slight difference can be noted when the COT is decreased further by 30% and 50%.
The mine should also review the proposed changes with the geotechnical team to make sure these changes would not interfere with or cause an increase of any subsidence that might have been analysed before the optimization. While room-and-pillar mining is a supported mining method (supported by the inner pillars of rock left inside the footprint), subsidence originates in areas of higher extraction (Hunt, 1979). Modern room-and-pillar mines are designed to leave enough pillars to support the overburden and prevent subsidence. However, there is still the possibility of subsidence if a high-extraction retreat method is used, a method that tries to recover the coal in the pillars that were left behind (Hunt, 1980), thus decreasing the effective area of the pillars supporting the overburden and protecting the surface from subsidence. Ultimately the implementation of a higher retreat mining option could lead to the pillars being compressed at a faster rate than the pillar recovery operation (Zingano and Weiss, 2018), making the retreat impractical, with the possibility of pillars bursting, transfer of load to adjacent pillars, and leading to the collapse of an area of the mine, impacting subsidence by leaving a large area of the mining panel without any pillar support.
Conclusions
This study developed a discrete event simulation model of a room-and-pillar production system to determine the optimal values of panel width, fleet size, and change-out time (COT) that maximize productivity and CM utilization. The input data modelled is based on time and motion studies performed at an underground room-and-pillar coal mine in Illinois, USA. The input modelling included a degree of randomness defined via univariate probability distributions and correlation testing. The production system is modelled using the Arena Rockwell® simulation environment. The model is validated using a trace-driven approach based on the output data collected from the studied mine. The validated model is then used to perform simulation experiments of the system. Three experimental factors are considered: panel width, COT, and haulage equipment fleet size. Six experimental levels are considered in the case of the panel width and COT. The effect of COT on the output variables are evaluated using a percentage decrease in the observed value.
The results showed that the mine should implement the smallest possible COT (a function of change-out distance) as it decreases the overall cycle time, and consequently increases productivity and CM utilization. It is also observed that the highest productivity and CM utilization is achieved in the 15-entry panel width for a fleet size of three shuttle cars. On the other hand, the optimal panel width for fleet sizes of four and five shuttle cars is the 19-entry panel width. Among the three factors studied, panel width and fleet size had the most significant (up to 5%) effect on productivity, cycle time, and utilization. The changes in COT in seconds had a noticeable impact on the output variables; however, this impact might be more pronounced in operations with long change-out distances and times. The authors recommend that the mine increases its fleet size from three to four and uses a 19-entry panel width for coal production subject to the optimal CM cut sequence and haulage distances implemented in the model. Based on this recommendation, the mine will increase its productivity by at least 5% even with no changes in COT.
This research successfully presents the first multiple-objective stochastic optimization approach that determines the optimal panel width, fleet size, and COT for coal room-and-pillar operations. The model can be adapted to similar operations and used to answer questions about their production systems. The model also combines the long-term planning of panel width and fleet selection with cut sequencing, panel productivity, and equipment utilization.
Acknowledgements
The authors would like to acknowledge the mine personnel and Joseph Hirschi for their expertise and for providing the data that made this research possible.
Conflict of Interest
The authors declare that they have no conflict of interest.
References
Anani, A. and Awuah-Offei, K. 2017. Incorporating changing duty cycles in CM-shuttle car matching using discrete event simulation: a case study. International Journal of Mining and Mineral Engineering, vol. 8, no. 2. pp. 96-112. [ Links ]
Anani, a., Awuah-Offei, K., and Hirschi, J. 2017. Application of discrete event simulation in optimising coal mine room-and-pillar panel width: A case study. Mining Technology, vol. 126, no. 1. pp. 1-9 [ Links ]
Anani, a., Nyaaba, W., Hekmat, a., and Cordova, E. A. 2019. Optimising cut-out distance for maximum coal productivity. Simulation, vol. 95, no. 6. pp. 545-559. [ Links ]
Arena Rockwell Automation. Arena User's Guide. pp. 151-168. https://www.arenasimulation.com/ [ Links ]
Chugh, Y.P. 2003. Reduced underground production costs through enhanced face productivity. Final Technical Report, Illinois Clean Coal Institute Project #02-1/1.1A-1. Pordue University, West Lafayette, IN. [ Links ]
Dindarloo, S.R., Osanloo, M., and Frimpong, S. 2015. A stochastic simulation framework for truck and shovel selection and sizing in open pit mines. Journal of the Southern African Institute of Mining and Metallurgy, vol. 115, no. 3. pp. 209-219. [ Links ]
Ghasemi, E., Ataei, M., and Shahriar, K. 2014. An intelligent approach to predict pillar sizing in designing room and pillar coal mines. International Journal of Rock Mechanics and Mining Sciences, vol. 65. pp. 86-95. [ Links ]
Hirschi, J.C. 2012. A dynamic programming approach to identifying optimal mining sequences for continuous miner coal production systems. PhD dissertation, Southern Illinois University at Carbondale. [ Links ]
Hirschi, J.C., McGolden, M., Cushman, T., and Chugh, Y.P. 2004. Optimising unit shift productivity of continuous miner coal production systems. Proceedings of the 29th International Technical Conference on Coal Utilization and Fuel Systems, Clearwater, FL, 18-22 April. Paper #138. Coal Technology Association, Gaithersburg, MD. pp. 1323-1334. [ Links ]
Hunt, S.R. 1979. Characterisation of subsidence profiles over room-and-pillar coal mines in Illinois: Illinois State Geological Survey, Reprint 1979F. (Reprinted from Proceedings of the Illinois Mining Institute, 86th Annual Meeting, 1978. pp.50-65. [ Links ]
Hunt, S.R. 1980, Surface subsidence due to coal mining in Illinois: PhD. dissertation, University of Illinois, Urbana, IL. 129 pp. [ Links ]
King, R.H. and Suboleski, S.C. 1991. Opportunities for continuous mining productivity improvements. Mining Engineering, vol. 43, no. 10. pp. 1226-1231. [ Links ]
Kleijnen, J.P.C. 2015. Design and analysis of simulation experiments. Proceedings of the International Workshop on Simulation. Springer, Cham. [ Links ]
Luo, Y. 2015. Room-and-pillar panel design method to avoid surface subsidence. Mining Engineering, vol. 67, no. 7. pp. 105-110. [ Links ]
Mishra, D.P., Sugla, M., and Singha, P. 2013. Productivity improvement in underground coal mines-a case study. Journal of Sustainable Mining, vol. 12, no. 3.pp.48-53. [ Links ]
Napa-García, G.F., Câmara, T.R., and Torres, V.F.N. 2019. Optimisation of room-and-pillar dimensions using automated numerical models. International Journal of Mining Science and Technology, vol. 29, no. 5. pp. 797-801. https://doi.org/10.1016/j.ijmst.2019.02.003 [ Links ]
Que, S., Anani, A., and Awuah-Offei, K. 2016. Effect of ignoring input correlation on truck-shovel simulation. International Journal of Mining, Reclamation and Environment, vol. 30, no. 5. pp. 405-421. [ Links ]
Salmi, E.F., Nazem, M., and Karakus, M. 2017. The effect of rock mass gradual deterioration on the mechanism of post-mining subsidence over shallow abandoned coal mines. International Journal of Rock Mechanics and Mining Sciences, vol. 91. pp. 59-71. [ Links ]
Segopolo, P.R. 2015. Optimisation of shuttle car utilisation at an underground coal mine. Journal of the Southern African Institute of Mining and Metallurgy, vol. 115, no. 4. pp. 285-296. [ Links ]
Shishvan, M. and Benndorf, J. 2019. Simulation-based optimisation approach for material dispatching in continuous mining systems. European Journal of Operational Research, vol. 275, no. 3.1pp. 108-1125. [ Links ]
Stefanko, R. 1983. Coal Mining Technology: Theory and Practice. Society of Mining Engineers of the American Institute of Mining, Metallurgical, and Petroleum Engineers, Inc., New York. 45 pp. [ Links ]
Tzalamarias, M., Tzalamarias, I., Benardos, A., and Marinos, V. 2019. Room and pillar design and construction for underground coal mining in Greece. Geotechnical and Geological Engineering, vol. 37, no. 3. pp. 1729-1742. [ Links ]
Upadhyay, S.P. and Askari-Nasab, H. 2018. Simulation and optimisation approach for uncertainty-based short-term planning in open pit mines. International Journal of Mining Science and Technology, vol. 28, no. 2. pp. 153-166. [ Links ]
Wang, B., Zhang, Q., and Xie, W. 2019. Bayesian sequential data collection for stochastic simulation calibration. European Journal of Operational Research, vol. 277, no. 1. pp. 300-316. [ Links ]
Yu, Y., Chen, S.E., Deng, K.Z., and Fan, H.D. 2017. Long-term stability evaluation and pillar design criterion for room-and-pillar mines. Energies, vol. 10, no. 10. pp. 1644. [ Links ]
Zeng, W., Baafi, E., and Walker, D. 2019. A simulation model to study bunching effect of a truck-shovel system. International Journal of Mining, Reclamation and Environment, vol. 33, no. 2. pp. 102-117. [ Links ]
Zingano, A. and Weiss, A. 2018. Subsidence over room and pillar retreat mining in a low coal seam. International Journal of Mining Science and Technology, vol. 29, no. 1. pp. 51-57. [ Links ]
 Correspondence:
A. Anani
Email: angelina.anani@ing.puc.cl
Received: 8 Feb. 2021
Revised: 11 Mar. 2022
Accepted: 11 Mar. 2022
Published: April 2022

