


Services on Demand
Article
 English (pdf)
 Article in xml format
 Article references
Indicators

Related links
-
 Cited by Google
 -
 Similars in Google
Share

 Permalink
Journal of the Southern African Institute of Mining and Metallurgy
On-line version ISSN 2411-9717
Print version ISSN 2225-6253
J. S. Afr. Inst. Min. Metall. vol.122 n.4 Johannesburg Apr. 2022
http://dx.doi.org/10.17159/2411-9717/1766/2022
PROFESSIONAL TECHNICAL AND SCIENTIFIC PAPERS
Remote sensing of the decant pond of tailings dams: Insights from a South African case study
C. O'DonovanI; E. AdamII; L.A. Torres-CruzI
ISchool of Civil and Environmental Engineering, University of the Witwatersrand, South Africa
IISchool of Geography, Archaeology, and Environmental Studies, University of the Witwatersrand, South Africa
SYNOPSIS
High-profile failures of tailings dams illustrate the significant safety challenge they pose. The decant pond of such facilities plays an important role in their mechanical stability. This study investigates the feasibility of using public multispectral data collected by the Sentinel-2 satellite mission to monitor the area of the decant pond. The Sentinel-2 mission has a revisit time of 5 days and the data used herein has a spatial resolution of 10 m/pixel. We considered two water-detection metrics: the normalized difference water index (NDWI) and the near-infrared (NIR) reflectance. Implementation of the method at a South African platinum tailings dam illustrates the capabilities and limitations. Public, sub-metre resolution true-colour imagery served as validation data. There is good agreement between pond area measurements based on Sentinel-2 and the validation imagery. These results suggest the feasibility of using Sentinel-2 data to supplement the monitoring of the decant pond.
Keywords: tailings dam, decant pond, remote sensing, Sentinel-2.
Introduction
Tailings are the fine-grained mine waste or residue material that remains after the constituents of value have been extracted from the ore. Tailings are typically transported hydraulically and discharged as slurries for permanent, or long-term, containment in tailings dams that are raised concurrently with filling (Blight, 2010). Although there are other types of tailings storage facilities (TSFs) such as in-pit disposal and dry stacking, tailings dams remain the most common (Franks et al., 2021). Tailings dam disasters over the last decade, such as the Mount Polley, Fundão, and Feijão dam failures, highlighted the potential dangers associated with similar facilities and have heightened public and regulatory scrutiny of these structures (Church of England, 2020; Roche et al., 2017). Accordingly, there is a need to continue developing methods and technologies that can contribute to safer tailings disposal practices.
Reviews of past tailings dam incidents and failures show that the amount of water in tailings dams plays a critical role in the likelihood and consequences of failure (Blight, 2010; ICOLD, 2001; Roche et al., 2017; Santamarina, Torres-Cruz, and Bachus, 2019). For instance, the proximity of the decant pond to the perimeter wall contributed to the failure of the Merriespruit tailings dam in South Africa in 1994 (Blight, 2010). Additionally, although the Mount Polley tailings dam failure in Canada was caused by undetected weak foundation soils, the post-failure investigation noted that the significant volume of water in the facility enabled the large loss of solids that followed the failure (Morgenstern et al., 2015). Furthermore, large decant ponds also imply short beaches that may hinder solar desiccation processes that enhance the strength of the tailings (Blight, 2010; Santamarina, Torres-Cruz, and Bachus, 2019). As such, the timely monitoring of the pond area and an understanding of its historical behaviour can enhance the safety of tailings dams.
The use of satellite imagery to monitor the behaviour of tailings ponds has important precedents. For instance, analysis of multispectral imagery from the Landsat mission disclosed the position of the pond on the Merriespruit tailings dam prior to its failure and informed the investigation into the causes (Blight, 2010). More recently, several investigations into tailings dam failures used true-colour satellite imagery to assess the pre-failure behaviour of the pond (Morgenstern, Vick, and van Zyl, 2015; Morgenstern et al., 2016; Rana et al., 2021; Robertson et al., 2019). Additionally, multispectral satellite imagery is commonly used to monitor the surface area and associated volume of natural and artificial surface water bodies (Huang et al., 2018; Pekel et al., 2016). Given that tailings ponds typically have a significantly smaller area than conventional water reservoirs, the accuracy with which their areas can be measured using public multispectral satellite imagery requires careful consideration. However, there are no systematic investigations into the use of public multispectral satellite imagery to measure the surface area of tailings ponds. This study contributes to filling this gap in the literature.
We first describe the tailings dam on which pond area measurements were conducted. This is followed by the introduction of the normalized difference water index (NDWI) and the near-infrared (NIR) reflectance as indicators of surface water. We then present relevant aspects of the Sentinel-2 satellite mission, our chosen source of public satellite imagery. We also describe the data used to validate the pond area measurements based on the Sentinel-2 imagery. The results section presents measurements that informed initial estimates of the upper and lower bounds of the NIR and NDWI site-specific thresholds to identify surface water. Subsequently, we undertake a site-specific threshold selection process and present comparisons to the validation data. Our concluding remarks summarize the main findings.
Methods and data
Site
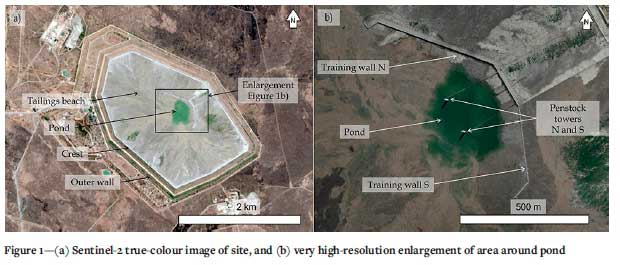
The site selected for this study is the Impala Platinum Dam 4, located in the platinum mining district of the North-West Province in South Africa (Figure 1). The site is an upstream tailings facility and was selected for analysis because of the regular pond location and the availability of very high-resolution satellite imagery on Google Earth Pro. The site has a pond area typically in the region of 100 000 m2 to 200 000 m2 with a minimum pond dimension of more than 300 m. Preliminary inspection of Sentinel-2 imagery indicated that the geometrical characteristics of the pond were likely to enable reasonable measurements of its area. Figure 1 highlights some of the features of the site including a twin penstock decant system and pond training wall. The penstock towers are concrete structures used to decant supernatant water from the pond. The training wall is a C-shaped causeway intended to partially enclose the pond and control its location (Blight, 2010).
Sentinel-2 data
Sentinel-2 is an optical satellite mission consisting of two identical satellites on the same orbital path separated by a phase of 180 degrees (ESA, 2015). The European Space Agency (ESA) manages the mission and the collected data is publicly accessible within a day of sensing. This characteristic, coupled with a relatively short revisit time of five days at the equator, makes Sentinel-2 a source of free data worth considering for the near-real-time monitoring of surface water on tailings dams.
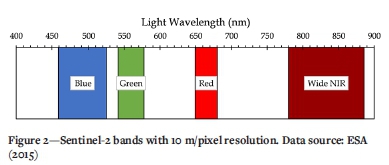
The Sentinel-2 satellites capture data in 13 spectral bands (ESA, 2015), of which this study uses four: blue, green, red, and wide NIR (Figure 2). The blue, green, and red bands allowed the construction of true-colour images useful for preliminary visual inspection of the site. Additionally, we used the green and NIR bands to quantify the area of the pond as explained below. All four of these bands have a 10 m/pixel spatial resolution.
Analyses that involve data collected at different times are ideally performed with imagery corrected for atmospheric effects (Song et al., 2001). Accordingly, we used Sentinel-2 Level 2A data that is orthorectified and atmospherically corrected by the ESA (ESA, 2015). Level 2A data is also referred to as surface reflectance (SR) data. Sentinel-2 SR coverage of Southern Africa began in late 2018 and continues to present day. The Google Earth Engine platform provided access to the Sentinel-2 data and enabled its processing (Gorelick et al., 2017).
Clouds and cloud shadows interfere with the quality of the data sensed by optical satellites such as Sentinel-2. To aid in the identification of the best-quality data, Sentinel-2 image tiles include quality metadata that informs the occurrence of clouds within each image (ESA, 2015). By using this data, supplemented with visual inspections, we ensured that all images used in this study were free of clouds or cloud shadows over the site of interest.
Validation data
Google Earth Pro provides access to true-colour historical satellite imagery with very high spatial resolution (sub-metre). These images provided a means to validate the pond area measurements based on the Sentinel-2 data. The area of the pond in these very high-resolution images was measured in Google Earth Pro by drawing a polygon around the pond of the tailings dam. Although the sub-metre resolution of these images is advantageous when estimating the pond area, the images have the disadvantage of not allowing access to the NIR band which, as discussed below, aids in water identification. This means that some uncertainty remains when assessing the area of the pond. Notwithstanding, the imagery enables useful and independent area measurements. Indeed, thorough geotechnical investigations into recent tailings dam failures have also used Google Earth Pro imagery to assess the historical behaviour of the pond (Morgenstern, Vick, and van Zyl, 2015; Morgenstern et al., 2016; Robertson et al., 2019).
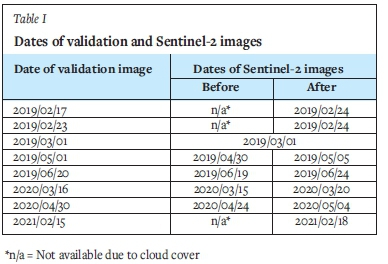
As mentioned above, Sentinel-2 surface reflectance imagery for Southern Africa is available starting from the end of 2018. There are eight very high-resolution images available from that date to the time at which the data capture for the present study was conducted (August 2021). All eight of these images were captured by Maxar Technologies' satellites. The earliest image was sensed on 17 February 2019 and the most recent one on 15 February 2021 (Table I). These dates thus defined the time-frame of our study.
Water detection metrics
This study uses two metrics to identify the presence of surface water atop tailings dams. One is the normalized difference water index (NDWI) (McFeeters, 1996) used to identify water bodies and which is a function of the radiance measured in the green and NIR regions of the spectrum (Figure 2). The NDWI is calculated on a pixel-wise basis as follows:

At any given pixel, NDWI varies between -1 and 1, and exhibits a direct correlation to moisture.
The second water detection metric used was the near-infrared (NIR) reflectance, which is the ratio of the NIR radiation that a body receives to the NIR radiation that it emits. As such, NIR reflectance varies between 0 and 1, although the Google Earth Engine platform multiplies these values by 104. As water absorbs solar radiation in the NIR portion of the electromagnetic spectrum, whereas dry land and vegetation reflect it, NIR reflectance alone aids in differentiating water bodies from vegetation and bare land (Rundquist et al., 1987; White, 1978; Work and Gilmer, 1976). That is, low NIR reflectance is a characteristic of surface water bodies. The NDWI is a more commonly adopted metric than NIR reflectance for water detection purposes. However, recent investigations suggest that NIR reflectance provides better water edge contrast than the NDWI (Mondejar and Toggco, 2019).
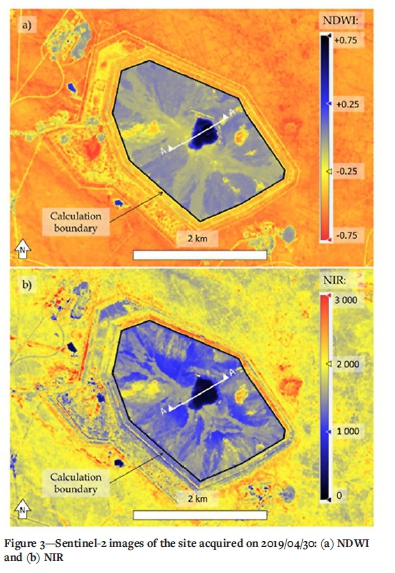
Figure 3 shows NDWI and NIR values at the site, computed from Sentinel-2 images, and illustrates the potential of both metrics to detect water. In both images, the pond is discernible near the centre of the dam. Notwithstanding, a particularity of the interpretation is that there are no universally applicable NDWI and NIR water-detection thresholds. That is, there are no unique values of NDWI or NIR that unequivocally distinguish surface water from other types of land cover. Instead, it is necessary to establish site-specific water-detection thresholds as explained next.
Data processing approach
Initial processing of the data aimed at determining reasonable upper and lower bounds of NDWI and NIR thresholds to identify water. To this end, the NIR and NDWI values along a transect line that extended over both beach and pond were measured for 12 images, one for each month of 2020. In this case, we used the transect line AA, shown in Figure 3. The purpose of covering 12 months was to capture any potential seasonal variability in the data.
Sentinel-2 images were then used to conduct pond area measurements that could be compared to the pond areas measured on the very high-resolution validation images. This required the definition of a calculation boundary along the crest of the dam (Figure 3). The area of the pond was calculated as the combined area of the pixels within the calculation boundary that had NDWI values above, or NIR reflectance values below, tentative water-detection thresholds.
For every tentative threshold, we quantified the discrepancy between the area based on the validation image and the area based on the Sentinel-2 image by computing the area mismatch (AM) as:

where AV and AS2 are the pond areas calculated from the validation image and the Sentinel-2 image, respectively. Minimization of the absolute AM guided the identification of site-specific NDWI and NIR thresholds.
Comparisons between the validation and Sentinel-2 images required temporal proximity. Ideally, the images being compared should correspond to the same day. When this was not possible, we linearly interpolated the area at the date of the validation image using Sentinel-2 images sensed before and after the validation image. When the Sentinel-2 images immediately before and after the validation image were cloudy, the next closest image was considered. If cloudiness persisted, then no Sentinel-2 image was selected. On three occasions this resulted in a comparison between a validation image and a single Sentinel-2 image sensed on a different date. Table I presents the dates of all the Sentinel-2 images that were compared to the validation images.
As a final step, we assessed the accuracy of the pond area estimates based on Sentinel-2 images by computing the pond areas using the site-specific thresholds and comparing them to the areas measured with the validation images.
Results
Upper and lower bound of NDWI and NIR thresholds
Figure 4 shows the 12 profiles of NDWI and NIR computed along transect AA (Figure 3). Inspection of true-colour images confirmed that the segment between the 500 and 900 m chainages predominantly corresponds to the pond. The NDWI and NIR response of the water is distinctly different from that of the tailings beach. Namely, NDWI peaks and NIR dips in response to water. The anomalous response of the August profile appears to be due to a low pond level and possible sandbanks observable in the true-colour image (not shown herein). Going forward, the August profile is ignored. However, we show it in Figure 4 to provide a more realistic range of possible responses.
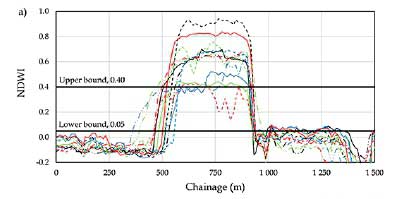

Figure 4a suggests that conservative estimates of the lower and upper bound of the NDWI threshold are 0.05 and 0.4. That is, ignoring the anomalous August profile, 0.05 is close to the maximum NDWI value observed outside of the pond, and 0.4 is close to the minimum NDWI value observed inside the pond. Similarly, Figure 4b suggests that conservative estimates of the lower and upper bound of the NIR threshold are 500 and 1000 (0.05 and 0.1 for native reflectance data).
Figure 4 shows that the profiles of both NDWI and NIR are steeper at the pond edge close to the 900 m chainage than at the edge close to the 500 m chainage. This is because the training wall imposes a quick change in pond depth near the 900 m chainage, whereas at the 500 m chainage, the gently sloping beach implies that pond depth changes more gradually.
NDWI and NIR water-detection thresholds
Figure 5 shows the polygons drawn around the pond on the very high-resolution imagery. Generally, the edge of the pond close to the training wall was more clearly distinguishable than the edge of the pond that bordered the beach. This is consistent with our earlier observation that the profiles in Figure 4 are steeper close to the 900 m chainage than close to the 500 m chainage.
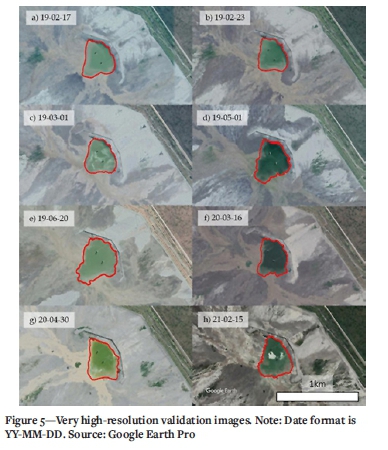
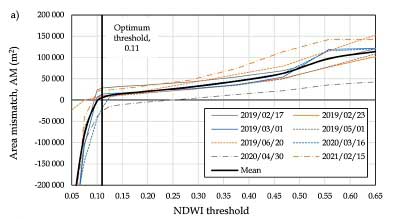
Figure 6 shows the variation in AM when considering a variety of tentative NDWI and NIR water-detection thresholds to process the Sentinel-2 data. The extent of the horizontal axes in Figure 6 corresponds to the upper and lower bounds identified in Figure 4. The graphs in Figure 6 present one curve for each of the eight validation images plus the mean line. The x-value at which each curve attains an AM of zero indicates the threshold that yielded the most accurate area estimate for any particular image. This optimum threshold varies from one image to another. Optimum NDWI thresholds varied from 0.03 to 0.25 and optimum NIR thresholds varied from 670 to 940. The x-value at which the mean line attains an AM of zero indicates the threshold best capable of yielding unbiased pond area estimates. That is, a threshold that compensates area overestimations in some images with area underestimations in others. This lack of bias is a desirable feature for the site-specific threshold. However, it is also important to consider the sensitivity of the AM to the chosen threshold. A low sensitivity of AM is also a desirable feature as it reduces the possibility of significant errors in pond area estimates. For the NDWI mean line (Figure 6a), AM is less sensitive (flatter slope) to thresholds that are greater than the threshold that corresponds to an AM of zero. Conversely, for the NIR mean line (Figure 6b), AM is less sensitive to thresholds that are smaller than the threshold that corresponds to an AM of zero. In line with these considerations, the adopted site-specific NDWI and NIR thresholds were 0.11 and 870, respectively. In the absence of additional testing data, further refinement of the thresholds would not guarantee improved pond area predictive ability.

Overall accuracy
Figure 7 compares the pond areas estimated from the validation images to the areas estimated from the Sentinel-2 images using the adopted site-specific NDWI and NIR thresholds. There is reasonable agreement between the very high-resolution validation imagery and the Sentinel-2 imagery. All but one of the area estimates based on Sentinel-2 data fall within ±20% of the validation areas, with half of the Sentinel-2 based estimates being within ±10% of the target. This level of agreement is encouraging, considering that the Sentinel-2 data is freely available and that there were also uncertainties involved in assessing the pond area from the validation images (Figure 5). The NIR-based measurements are in slightly better agreement with the validation imagery than the NDWI-based measurements. However, the results suggest that both NIR and NDWI-based pond area measurements are potentially useful.
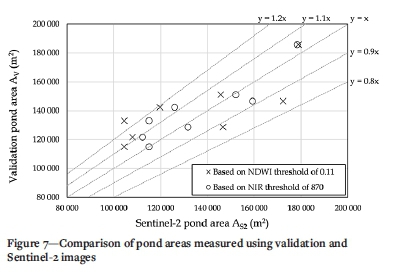
The vertical offset between the data points and the identity line (y=x) in Figure 7 indicates that area discrepancies can easily reach values of 20 000 m2. This potential discrepancy limits the minimum size of dams whose ponds can be monitored with Sentinel-2 data without exceeding reasonable errors. Fortunately, Sentinel-2 data is likely to be an appropriate monitoring tool at large tailings facilities with corresponding high consequences of failure.
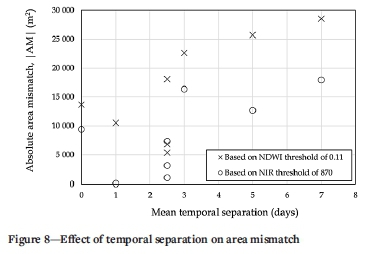
Figure 8 explores whether the temporal separation between the validation and Sentinel-2 images affected the absolute AM of the pond area estimates. When a validation image was compared to two Sentinel-2 images, the temporal separation computation used a weighted average. This accounted for the fact that the Sentinel-2 image closest to the validation image had a greater influence on the pond area estimate than the Sentinel-2 image that was more temporally distant. Figure 8 suggests that temporal separation contributed to the AMs observed in Figure 7. Comparisons involving temporal separations smaller than two days did not exceed absolute AMs of 20 000 m2.
Concluding remarks
Monitoring the extent of the decant pond of tailings dams is a prime concern in the management of these structures. This study presented measurements of the pond area of a platinum tailings dam based on surface reflectance imagery from the Sentinel-2 satellite programme. We used the Sentinel-2 data to extract two water-detection metrics: the normalized difference water index (NDWI) and the near-infrared (NIR) reflectance. Very high-resolution imagery provided validation data used to select a site-specific water-detection threshold for both NDWI and NIR. The area mismatch (AM) between the validation and the Sentinel-2 imagery, as well as the sensitivity of the mismatch to the selected threshold, guided the selection of the site-specific thresholds: 0.11 for NDWI and 870 for NIR.
Pond area measurements based on the site-specific thresholds where within ±20% of the validation data. Uncertainties involved in measuring the pond area in the very high-resolution validation imagery may have contributed to the errors. The temporal separation between the validation images and the Sentinel-2 images also appears to contribute to the errors. The accuracy of the pond area measurements, coupled with the high revisit cadence of the Sentinel-2 satellites (five days at the equator), highlights the potential of using data from the Sentinel-2 mission to supplement the monitoring of the decant pond of tailings dams. Typical absolute area measurement errors of ±20 000 m2 impose limits on the minimum size of the dams whose ponds can be effectively monitored with Sentinel-2 data. Importantly, Sentinel-2 data is likely to be useful in monitoring large facilities with corresponding high consequences of failure. We also note that while the measurement of the beach length of tailings dams falls beyond the scope of the current work, the potential of Sentinel-2 images to assist with such measurements is also worth exploring.
The approach described herein can be implemented at other suitably sized facilities to determine site-specific NDWI and NIR water-detection thresholds. The safety record of tailings dams suggests that we must make use of all data at our disposal to conduct a robust monitoring of these structures.
Ackowledgements
Fraser Alexander (Pty) Ltd generously sponsored this investigation. Jani van den Berg assisted with exploring Google Earth Engine functionality.
References
Blight, G.E. 2010. Geotechnical Engineering for Mine Waste Storage Facilities. Taylor & Francis, London. [ Links ]
Church of England. 2020. Investors voice support for first Global Tailings Review. https://www.churchofengland.org/news-and-media/news-and-statements/investors-voice-support-first-global-tailings-review [accessed 11 September 2021]. [ Links ]
European Space Agency (ESA). 2015. Sentinel User Handbook and Exploitation Tools (SUHET): Sentinel-2 User Handbook. European Commission. ESA Standard Document 24/07/2015 Issue 1 Rev. 2. [ Links ]
Franks, D.M., Stringer, M., Torres-Cruz, L.A., Baker, E., Valenta, R., Thygesen, K., Matthews, A., Howchin, J., and Barrie, S. 2021. Tailings facility disclosures reveal stability risks. Scientific Reports, vol. 11. 5353. https://doi.org/10.1038/s41598-021-84897-0 [ Links ]
Gorelick, N., Hancher, M., Dixon, M., Ilyushchenko, S., Thau, D., and Moore, R. 2017. Google Earth Engine: Planetary-scale geospatial analysis for everyone. Remote Sensing of Environment, vol. 202. pp. 18-27. https://doi.org/io.ioi6/j.rse.2017.06.031 [ Links ]
Huang, C., Chen, Y., Zhang, S., and Wu, J. 2018. Detecting, extracting, and monitoring surface water from space using optical sensors: A review. Reviews of Geophysics, vol. 56. pp. 333-360. https://doi.org/10.1029/2018RG000598 [ Links ]
International Commission on Large Dams (ICOLD). 2001. Tailings dams risk of dangerous occurrences: Lessons learnt from practical experiences. United Nations Environment Programme (UNEP), ICOLD Bulletin 121. [ Links ]
McFeeters, S.K. 1996. The use of the Normalized Difference Water Index (NDWI) in the delineation of open water features. International Journal of Remote Sensing, vol. 17. pp. 1425-1432. https://doi.org/10.1080/01431169608948714 [ Links ]
Morgenstern, N.R., Vick, S.G., and van Zyl, D. 2015. Report on Mount Polley tailings storage facility breach. Province of British Columbia. Mount Polley Independent Expert Engineering Investigation and Review Panel. https://www.mountpolleyreviewpanel.ca/sites/default/files/report/ReportonMountPolleyTailingsStorageFacilityBreach.pdf [accessed 25 February 2022]. [ Links ]
Morgenstern, N.R., Vick, S.G., Viotti, C.B., and Watts, B.D. 2016. Report on the immediate causes of the failure of the Fundão Dam. Fundão Tailings Dam Review Panel. https://pedlowski.files.wordpress.com/2016/08/fundao-finalreport.pdf [accessed 25 February 2022]. [ Links ]
Mondejar, J.P. and Tongco, A.F. 2019. Near infrared band of Landsat 8 as water index: A case study around Cordova and Lapu-Lapu City, Cebu, Philippines. Sustainable Environment Research, vol. 29, no. 16. https://doi.org/10.1186/s42834-019-0016-5 [ Links ]
Pekel, J.F., Cottam, A., Gorelick, N., and Belward, A.S. 2016. High-resolution mapping of global surface water and its long-term changes. Nature, vol. 540. pp. 418-422. https://doi.org/10.1038/nature20584 [ Links ]
Rana, N.M., Ghahramani, N., Evans, S.G., McDougall, S., Small, A., and Take, W.A. 2021. Catastrophic mass flows resulting from tailings impoundment failures. Engineering Geology, vol. 292. 106262. https://doi.org/10.1016/j.enggeo.2021.106262 [ Links ]
Robertson, P.K., Melo L., Williams D.J., and Wilson G.W. 2019. Report of the Expert Panel on the technical causes of the failure of Feijão Dam I. https://bdrb1investigationstacc.z15.web.core.windows.net/assets/Feijao-Dam-I-Expert-Panel-Report-ENG.pdf [accessed 25 February 2022]. [ Links ]
Roche, C., Thygesen, K., and Baker, E. (eds). 2017. Mine tailings storage: Safety is no accident (a rapid response assessment). GRID-Arendal, United Nations Environment Programme. https://url.grida.no/2ZE7G1N [ Links ]
Rundquist, D.C, Lawson, M.P., Queen, L.P., and Cerveny, R.S. 1987. The relationship between summer-season rainfall events and lake-surface area. Water Resources Bulletin, vol. 23. pp. 493-508. https://doi.org/10.1111/j.1752-1688.1987.tb00828.x [ Links ]
Santamarina, J.C., Torres-Cruz, L.A., and Bachus, R.C. 2019. Why coal ash and tailings dam disasters occur. Science, vol. 364. pp. 526-528. https://doi.org/10.1126/science.aax1927 [ Links ]
Song, C., Woodcock, C.E., Seto, K.C., Lenney, M.P., and Macomber, S.A. 2001. Classification and change detection using Landsat TM data: When and how to correct atmospheric effects? Remote Sensing of Environment, vol. 75. pp. 230-244. https://doi.org/10.1016/S0034-4257(00)00169-3 [ Links ]
White, M.E. 1978. Reservoir surface area from Landsat imagery. Photogrammetric Engineering and Remote Sensing, vol. 44. pp. 1421-1426. [ Links ]
Work, E.A. and Gilmer, D.S. 1976. Utilization of satellite data for inventorying prairie ponds and lakes. Photogrammetric Engineering and Remote Sensing, vol. 42. pp. 685-694. [ Links ]
 Correspondence:
L.A. Torres-Cruz
Email: LuisAlberto.TorresCruz@wits.ac.za
Received: 27 Sep. 2021
Revised: 27 Jan. 2022
Accepted: 11 Feb. 2022
Published: April 2022

