


Services on Demand
Article
 English (pdf)
 Article in xml format
 Article references
Indicators

Related links
-
 Cited by Google
 -
 Similars in Google
Share

 Permalink
Journal of the Southern African Institute of Mining and Metallurgy
On-line version ISSN 2411-9717
Print version ISSN 2225-6253
J. S. Afr. Inst. Min. Metall. vol.122 n.3 Johannesburg Mar. 2022
http://dx.doi.org/10.17159/2411-9717/1587/2022
PROFESSIONAL TECHNICAL AND SCIENTIFIC PAPERS
Predicting rock fragmentation based on drill monitoring: A case study from Malmberget mine, Sweden
S. ManzoorI; M. DanielssonII; E. SöderströmIII; H. SchunnessonI; A. GustafsonI; H. FredrikssonIII; D. JohanssonI
IDivision of Mining and Geotechnical Engineering, Lulea University of Technology, Sweden. ORCID: Sohail Manzoor: https://orcid.org/0000-0003-3791-4431
IIRamboll, Sweden
IIIAFRY, Sweden
SYNOPSIS
Fragmentation analysis is an essential part of the optimization process in any mining operation. The costs of loading, hauling, and crushing the rock are strongly influenced by the size distribution of the blasted rock. Several direct and indirect methods are used to analyse or predict fragmentation, but none is entirely applicable to fragmentation assessment in sublevel caving mines, mainly because of the limitations imposed by the underground environment and the lack of all the required data to adequately describe the rock mass. Over the past few years, measurement while drilling (MWD) data has emerged as a potential tool to provide more information about the in-situ rock mass. This research investigated if MWD can be used to predict rock fragmentation in sublevel caving. The MWD data obtained from a sublevel caving mine in northern Sweden were used to find the relationship between rock fragmentation and the nature of the rock mass. The loading operation of the mine was filmed for more than 12 months to capture images of loaded load-haul-dump (LHD) buckets. The blasted material in those buckets was classified into four categories based on the median particle size (X50). The results showed a stronger correlation for fine and medium fragmented material with rock type (MWD data) than coarser material. The paper presents a model for prediction of fragmentation, which concludes that it is possible to use MWD data for fragmentation prediction.
Keywords: rock fragmentation, measurement while drilling, quick rating system, partial least squares regression, sublevel caving.
Introduction
Rock fragmentation is defined as the size distribution of blasted rock. It is influenced by such factors as blast design, rock strength, and discontinuities already present in the rock mass (Hunter et al., 1990; Latham and Lu, 1999; Azimi et al., 2010). Fragmentation is a key indicator of blast performance and is significantly affected by the drilling and charging of the boreholes. Good fragmentation facilitates the loading and hauling operation as well as minimizes energy consumption in the comminution process (Silva, Amaya, and Basso, 2017). It plays an important role in controlling the costs of any mining operation (Monjezi, Rezaei, and Varjani, 2009; Faramarzi, Mansouri, and Ebrahimi Farsangi, 2013; Zhang et al., 2020). Fragmentation-related costs can be divided into pre-blast costs, z'.e., the costs related to drilling, charging, and blasting the rock mass, and post-blast costs, z'.e., the costs related with loading, hauling, and crushing the blasted rock. In general, reduced post-blast costs and increased pre-blast costs are the result of finer fragmentation, and the opposite for coarser fragmentation (Mackenzie, 1967 in Morin and Ficarazzo, 2006).
Fragmentation is a very important aspect of sublevel caving (SLC) as it affects the gravity flow of the blasted material, the loading at the drawpoints, the efficiency of load-haul-dump (LHD) operations, the orepass efficiency, and the energy requirements of crushers (Wimmer, 2010; Danielsson et al., 2017). Wimmer (2010) found that finer fragmentation increased the mobility of the material and resulted in more uniform gravity flow from the blasted ring. Meanwhile, coarser fragmentation, especially oversize fragments, hinders the material flow and may cause hangups in the ring, resulting in reduced ore recovery if the hangups cannot be released. An unsafe working environment is another possible consequence of coarse fragmentation and boulders (Danielsson et al., 2017). An oversize fragment is defined by Singh and Narendrual (2010) as 'any fragment produced from primary blasting, which cannot be adequately handled by the standard loading, hauling and crushing equipment used in an operation'.
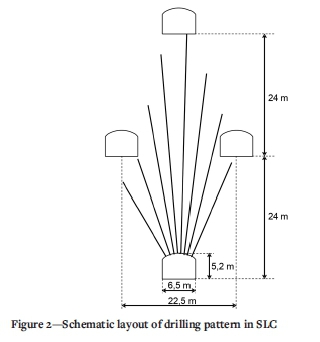
Fragmentation variation is an inherent characteristic of an SLC operation (Shekhar et al., 2016), depending on the design of the blast ring (Dustan and Power, 2011), the confined nature of blasting (Johansson, 2011), and the specific charge (Hustrulid and Kvapil, 2008). The design of the blast ring is important, as holes are concentrated at the bottom and more widely spread in the upper part of the ring (Dunstan and Power, 2011) (see example in Figure 2). The upward drilling of long holes will also increase the probability of borehole deviation in the upper part of the ring (Ghosh, Schunnesson, and Gustafson, 2017). This design of the blast ring and the probable borehole deviation lead to an uneven burden and specific charge, resulting in an uneven energy distribution along the boreholes. Consequently, variations in fragmentation are observed at different stages of material loading from the blasted ring (Power, 2004; Brunton, Fraser, and Hodgins, 2010; Wimmer, Nordqvist, and Ouchterlony, 2012). The chargeability of SLC rings is another key factor influencing fragmentation and boulder generation. The actual charged length of a borehole can be less than the planned one because of borehole collapse or other blockages. The actual vs planned charging length of a borehole can be defined as the chargeability (Ghosh, Gustafson, and Schunnesson, 2018). Danielsson et al. (2017) found that a decrease in chargeability will cause a lower local specific charge and, thus, coarser material. In a study at LKAB's Malmberget mine, Andersson (2016) found that chargeability, on average, was below 90%. However, individual areas had chargeability rates of approximately 70%, and individual rings in those areas occasionally had chargeability rates as low as 44%. Ghosh, Schunnesson, and Gustafson (2017) also showed that borehole stability is an important consideration when analysing fragmentation, as it is directly linked to the amount of explosives that can be charged into the borehole. If the borehole is blocked at some point by caving, it may not be possible to restore or re-drill the borehole, leading to insufficient charging to break the rock mass effectively (Lundin, 2020). Borehole instability is also likely to be worsened by high stress states, production blasting, rockbursts, or mine seismicity (Zhang, 2016).
The assessment of rock fragmentation has some practical limitations. There are several direct and indirect techniques for fragmentation assessment, including sieving, observational methods, and image-based analysis, but they are all limited in their ability to continuously monitor fragmentation, especially in an underground environment (Campbell and Thurley, 2017). Rock fragmentation is often estimated before blasting using different empirical formulae developed by various researchers. Ouchterlony and Sanchidrian (2019) presented a comprehensive review of these formulae. Fragmentation models help to target the required rock size distribution after blasting (Morin and Ficarazzo, 2006), but the uncertainty and even unavailability of correct rock properties causes errors. Another limitation of fragmentation models is their origin, i.e., they are mostly developed for surface mines (Ouchterlony and Sanchidrian, 2019) and lack application in underground environments. For example, they do not incorporate several essential factors relevant to fragmentation in SLC mining, such as the shape of the blast fan, confined nature of blasting, drilling accuracy, chargeability etc.
Application of modern technologies like laser scanning and borehole scanning in the mining industry is enabling the acquisition of more accurate rock mass data. One of these technologies is measurement while drilling (MWD), a method that monitors the drilling process. It does not require additional equipment like laser scanners or cameras to collect data, and it does not disturb the mining operation. During production drilling, it records various parameters, for example, depth of the hole, penetration rate, percussive pressure, feed pressure, rotation pressure, rotation speed, flushing pressure at specified intervals along the length of the borehole (Schunnesson, 1996; van Eldert et al., 2019). The MWD technique has been used to improve blast design (Leighton, 1982), assess the chargeability of boreholes (Ghosh, Gustafson, and Schunnesson2018; Navarro et al., 2019), estimate rock strength (Rodgers et al., 2018), estimate the blast sill thickness (Vezhapparambu and Ellefmo, 2020), and detect discontinuities in the rock mass (Schunnesson, 1996; Khorzoughi, 2013; Manzoor et al., 2020). MWD provides a fingerprint of the penetrated rock mass and increases the information available on the hidden volume of rock surrounding boreholes (Segui and Higgins, 2002; Khorzoughi, 2013). Ghosh, Zhang, and Nyberg (2015) have shown that MWD data can assist in estimating the borehole stability after a hole has been drilled.
In this paper, the possibility of using MWD data to predict fragmentation in sublevel caving is studied. MWD data and fragmentation data from two different orebodies in LKAB's Malmberget mine were collected and analysed. Correlation analysis and partial least squares (PLS) regression are used to identify the relationship between MWD-based rock mass characteristics and fragmentation.
Methodology
This research comprised a literature review, acquisition of MWD data from production drilling, and filming of the loading operation. Data processing involved MWD data filtering and extraction of relevant images from the filmed data. The data analysis involved the classification of rock mass based on MWD data, classification of fragmentation of the blasted material based on median fragment size, and the correlation of these data types.
Site description
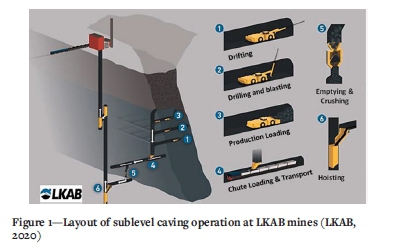
LKAB's Malmberget iron ore mine is located in Gallivare municipality in northern Sweden. The mine consists of around 20 orebodies which spread over a large underground area of 2.5 by 5 km (Lund, 2013). Of these, 13 are currently being mined (Shekhar, 2020). The annual production in 2019 was 16 Mt of ore. The mining operation is carried out from several main haulage levels located at 600 m, 815 m, 1000 m, and 1250 m. To achieve high productivity, large-scale sublevel caving is the current method of ore extraction. Blasted rock from the drawpoints is hauled by load-haul-dump (LHD) machines to orepasses that transfer the ore from the production level down to the haulage level. The ore is transported to underground crusher stations by trucks, and after primary crushing, the ore is hoisted to the processing plant at the surface. A general layout of the complete operation is shown in Figure 1. In the Malmberget mine, trucks are used instead of a train at stage four.
Data collection
The required data was collected from two orebodies of the mine: orebody A and orebody B. The selected drift from orebody A was drift 7870 at 1074 m level, and selected drifts from the orebody B were drifts 4960 and 4990 at 1052 m. In Malmberget mine, drilling is done in a fan-shaped pattern (Figure 2). The shortest holes are less than 20 m long, and the longest are close to 50 m. The number of boreholes is mostly eight per ring, but there can be nine or ten per ring especially near the footwall. The mine site uses a fixed blasting configuration with a borehole diameter of 115 mm and a ring-to-ring distance (burden) of 3.5 m. MWD data from 17 rings with a total of 141 boreholes, including a complete film record of all LHD buckets loaded from those rings, was used for this study.
Drill monitoring data was collected from Simba WL6C drill rigs used in the Malmberget mine. The recorded data included time (YYYY-MM-DD hh:mm:ss), depth (m), rotation pressure (bar), penetration rate (m/min), feed pressure (bar), and percussive pressure (water pressure measured in bar). The sampling interval along the borehole was set to 3 cm.
To monitor fragmentation, cameras were installed in the selected drifts to record each LHD bucket. Cameras were configured to record a short video whenever there was movement in the recording area. Filming underground in a production environment is always challenging. Commonly dust tends to reduce the quality of the recordings. To ensure better quality videos, cameras were assisted with good lighting. Another challenge during the recordings was that the headlights of the LHD machines sometimes distorted the frame pixels. The recordings took place during two time periods. During the first period, data was collected from orebody A; during the second period, from orebody B. The collected data cover more than 12 months.
Data processing
The data collected from drill monitoring and film data was processed prior to analysis. Drill monitoring or MWD data often contains data values that are out of range of what can be considered as normal drilling behaviour. An example of this is very high or negative values, e.g. a negative penetration rate that indicates an impossible backward movement of the drill string. Furthermore, the drilling process in itself may generate data that is not related to rock mass variations but rather to the drill or control system, such as data recorded during collaring or when a new rod is added to the drill string. These examples suggest that initial filtering of data is essential for the final outcome of the analysis. Therefore, a new filtering method was developed to potentially improve the quality of data. The developed filtering method was compared with a previously known filtering method (Ghosh, Gustafson, and Schunnesson 2018) to find the one best representing the characteristics of the rock. A brief description of both methods is given below.
MWD data filtering (method A)
This method of MWD data filtering is adopted from Ghosh, Gustafson, and Schunnesson (2018) and is based on frequency analysis and practical experience. The recorded samples are filtered using predefined intervals for each parameter. Outside these threshold limits the drilling is assumed unrealistic or faulty. The predefined intervals used in this study are given in Table I. Thus, all samples having any of the MWD parameters outside the corresponding filter limit were removed from the data-set.
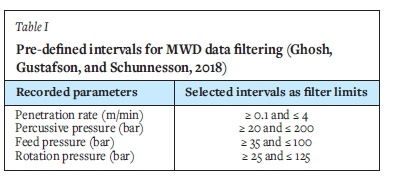
The lower limit of percussive pressure in Table I was adjusted from 5 bar, the limit used by Ghosh, Gustafson, and Schunnesson (2018) to 20 bar based on the data-set for the mining areas used in this study.
MWD data filtering (method B)
The second filtering method (B) is based on the time difference between the consecutive samples of MWD data. For normal drilling, with a logging interval of 3 cm, a new sample is recorded approximately every 2 to 3 seconds. Longer time intervals between samples will indicate irregularities in the drilling process such as rod changes or other types of stoppages. After such stoppages, the applied forces will only gradually regain their normal values and it will take some time before drilling is stable again. This means that several data-points surrounding stoppages are not reliable and should be removed from the data-set.
In Figure 3, the borehole depth vs the time between the samples is presented for a particular borehole. In this case, the drilling process stops for 50-60 seconds every time a new rod is added to the drill string (at every 2.1 m, which is the length of each rod).
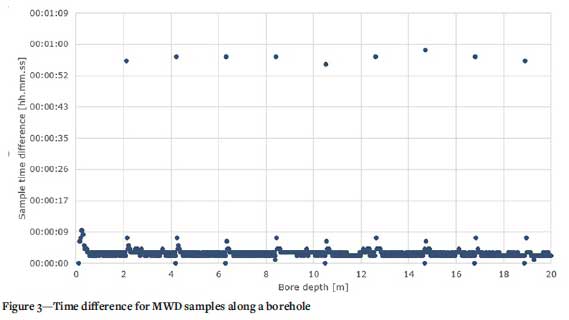
Table II shows the raw MWD data when a new rod is added. The rod addition occurs between samples 2 and 3 and has a time length of 57 seconds. In the table it can be seen that the percussive pressure is reduced after the rod addition to protect the drilling system. This will affect the penetration rate. Therefore, it is important to remove not only the data sample during rod addition, where penetration rate is zero, but also surroundings values which are influenced by the stoppage.
In this newly developed filtering method, the threshold time between two consecutive samples was set to 10 seconds to exclude both rod changes and other stoppages but include all normal drilling. For all identified stoppages the samples closest to the high time-step were assumed to be outliers and were removed.
To reconstruct a complete MWD log, the removed samples were replaced by interpolated values from samples before and after the stop, assuming similar rock characteristics before and after the stoppage. Practically, the removed sample parameters are replaced by linearly interpolated data based on two samples before and three samples after the removed samples. In Table III, an example of the data after filtering is shown.
After applying the time-based filtering method on the data-set, the threshold filter limits in Table I were applied to further refine the MWD data.
Rock mass classification based on MWD
After filtering the MWD data, the quality of the rock mass surrounding the boreholes was characterized using principle component analysis (PCA). As input to the PCA analysis, not only the recorded and filtered MWD parameters were used, but also the variability of penetration rate and rotation pressure, and a fracturing parameter which is calculated using the following equation developed by Schunnesson (1996):
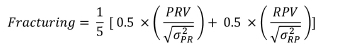
where PRV is penetration rate variability and RPV is rotation pressure variability, while g shows the variance of the corresponding parameter. A detailed description of the PCA calculations can be found in Ghosh, Schunnesson, and Gustafson, (2018).
Based on the PCA analysis the rock mass is classified into five categories, 'Solid', 'Slightly fractured', 'Highly fractured', 'Minor cavities', and 'Major cavities' (Ghosh, Schunnesson, and Gustafson, 2018). A similar rock mass classification based on MWD data was also used by Navarro et al. (2019) to assess chargeability in sublevel caving. Finally, the percentage of each category was calculated for every included ring.
Processing film data
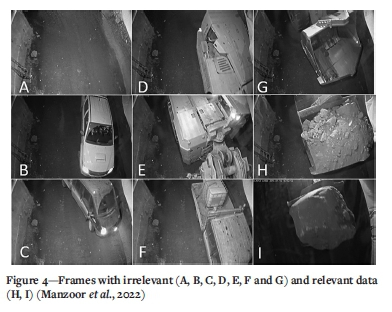
To monitor the fragmentation, HD surveillance cameras were utilized to collect videos of every passing bucket/loading sequence through built-in motion detection applications. The film data from the cameras was processed before the analysis to convert the raw video data into a usable form. Since the cameras were sensitive to motion, any movement in the filming area was recorded. Movements were caused by LHDs, personnel cars, drifters, water sprinklers, dozers etc., or by the oscillating ventilation duct during blasting activities. A MATLAB code was developed to extract the relevant images (frames) from the videos. From 500 to 1200 frames were extracted from each video depending on the length of the videos, yielding too many images. Most of the frames did not contain images of buckets with the blasted material. Instead, they showed different machine parts from when the machine was entering or leaving the filming area or no machines at all. Few of the extracted frames from each video (about 5-10 frames) contained LHD buckets filled with material. Some frames showed partial buckets as the videos were recorded during LHD motion. Only frames with full LHD buckets were forwarded to fragmentation analysis; all the rest were discarded. Figure 4 shows examples of frames with relevant and irrelevant data.
Quick rating system (QRS)
A total of 5908 images of LHD buckets filled with blasted rock were selected for fragmentation assessment. These types of images can be analysed using commercially available software, e.g., Split-Desktop® (Kemeny, 1994), WipFrag™ (Maerz, Palangio, and Franklin, 1996), GoldSize (Kleine and Cameron, 1996), FragScan (Schleifer and Tessier, 1996), TUCIPS (Havermann and Vogt, 1996), CIAS® (Downs and Kettunen, 1996), PowerSieve (Chung and Noy, 1996), IPACS (Dahlhielm, 1996), Fragalyst (Raina et al., 2002) etc. Image analysis using these software packages is normally time-consuming; for example, analysing a single image using Split-Desktop® can take two to three hours depending on the quality of the image (Petropoulos, 2015). Therefore, the analysis using commercial software was considered impractical, or even impossible considering the large number of images. The study used an observational method called quick rating system (QRS) as reported by Petropoulos (2015), Wimmer et al. (2015), Danielsson, Johansson, and Schunnesson (2019), and Danielsson et al. (2017) to assess the median fragment size, X50, of the material in the LHD buckets. In the QRS method, the actual images of fragmented rock are manually compared to reference fragmentation images (Wimmer et al., 2015). It is similar to the 'Compaphoto' method (Cunningham, 1996), but is here modified to estimate fragmentation in LHD buckets. Since QRS is an observational method, it can be significantly influenced by the observer's experience and bias and therefore carries a risk of low accuracy (Babaeian et al., 2019). However, similar and consistent results can be achieved as for Split-Desktop® if QRS classification is carried out carefully (Wimmer et al., 2015).
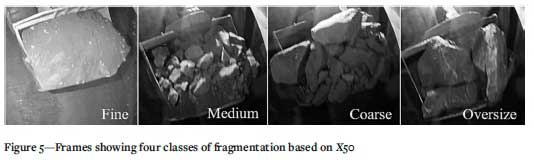
In this study, the fragmentation was categorized into four classes based on X50. Class 1 referred to fine fragmentation, X50 < 50 mm; class 2 was medium fragmentation, X50 = 50-400 mm; class 3 was coarse fragmentation, X50 = 400-1000 mm; class 4 was oversize fragmentation, X50 > 1000 mm. Malmberget mine defines oversize fragments as rock blocks bigger than 1 x 1 x 1 m (Gustafson et al., 2016; Danielsson et al., 2017). An example of the fragmentation classes is shown in Figure 5.
Correlation analysis
This study used correlation analysis to examine the relationship between rock mass quality determined from MWD data and the fragmentation estimated from QRS. Correlation analysis is a statistical approach used to assess the association between two variables e.g., independent and response variables, where the correlation coefficient 'R' quantifies the strength of the relationship (Franzese and Luliano, 2019). Values range from -1 to +1; in this rating system, -1 shows a perfect negative correlation, +1 a perfect positive correlation between the pair of variables, and 0 indicates a complete independence and absence of any correlation (Franzese and Luliano, 2019). The intermediate values from 0 to ±1 represent a partial correlation of variables; the correlation can be significant or weak (Franzese and Luliano, 2019). In practical applications visible correlations can have a value as small as ±0.4 (Kleinbaum et al., 1998).
In this study, multivariate regression analysis was used to model the relationship between rock mass types and fragmentation categories. Multivariate regression has the ability to handle multiple variables and consider all the associations between variables simultaneously (GeiB and Einax, 1996). Some of the most commonly used multivariate methods are PCA, discriminant analysis (DA), multiple regression analysis, factor analysis, logistic regression, PLS regression, cluster analysis, log-linear models, and multivariate analysis of variance. This study used PLS because of its minimal demands on measurement scales and sample size, as well as its ability to suggest where relationships might or might not exist. PLS helps to build models predicting more than one dependent variable (Lorber, Wangen, and Kowalsk, 1987). PLS regression was introduced by Wold in 1966; it generalizes and combines features from PCA and multiple regression (Colombani et al., 2012). It is particularly useful when it is needed to predict a set of dependent variables from a large set of independent variables (Colombani et al., 2012). PLS does not assume that the predictors are fixed, unlike multiple regression; this means the predictors can be measured with error, making PLS more robust to measurement uncertainty (Cramer, 1993). A detailed description of the strengths and weaknesses of the PLS method is given by Cramer (1993).
Results and discussion
Correlation tests - filtering methods
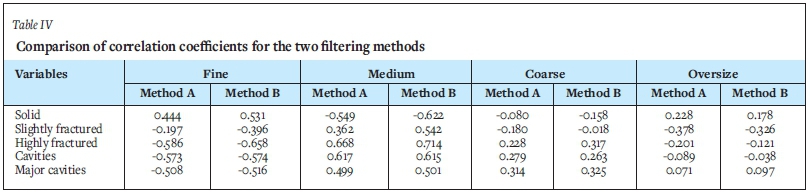
To evaluate any quality differences between filtering methods A and B, the correlation coefficients for the two methods were compared (see Table IV).
Since the correlation coefficients generally are higher for filtering method B, this method is selected for the following analysis.
Correlation tests - rock mass type vs fragmentation
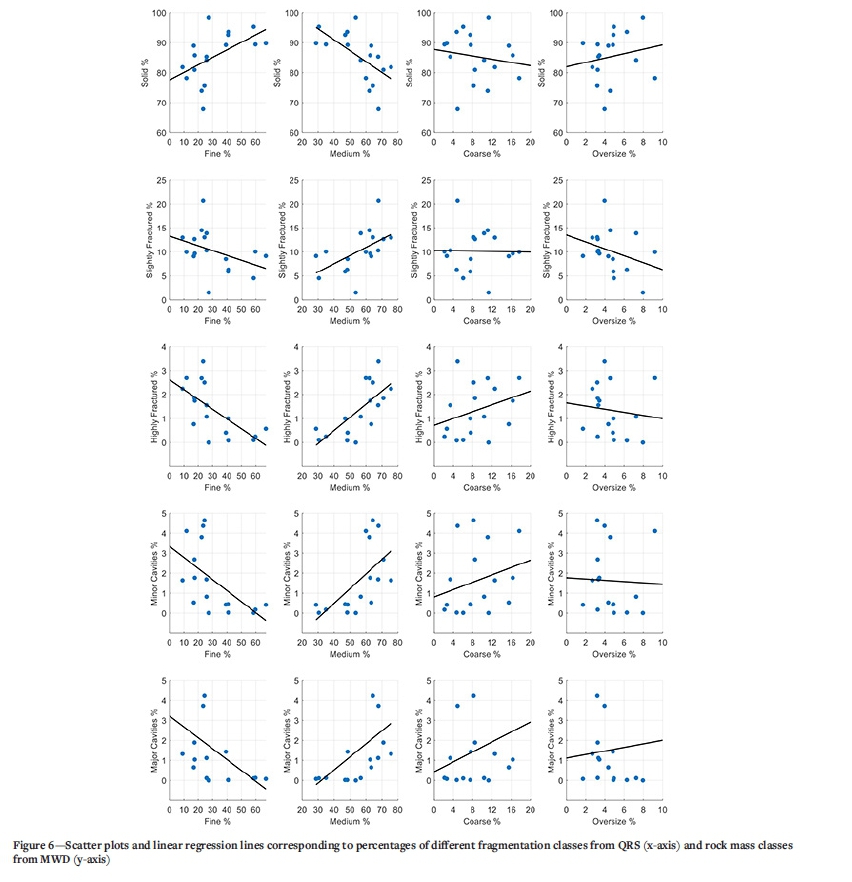
To initially study the relationship between rock mass classes (from MWD) and fragmentation (from QRS), scatter plots with linear regression lines are presented for each category (Figure 6). Each data-point in the figure represents one ring. In most cases a clear visible correlation can be seen, but the scatter is higher for coarse and oversize fragmentation than for fine and medium fragmentation. The amount of fine material increases when the percentage of solid rock mass increases, and decreases for all other rock mass types. Similarly, medium sized rock fragments decrease when solid rock mass increases and increase for all other rock mass types.
Correlation tests - linear or monotonic relationship
To further investigate the relationship between rock mass and fragmentation, Pearson and Spearman correlation coefficients were calculated and analysed. Initially, the Pearson correlation coefficients (R), p-values, and coefficients of determination (R2) were calculated (shown in Table V). The null hypothesis in this study states there is no relationship between the variables under observation, while the alternative hypothesis states there is a relationship. A significance level of 0.05 is used to reject the null hypothesis, z'.e., a p-value less than 0.05 (typically < 0.05) demonstrates strong evidence against the null hypothesis, as there is a probability lower than 5% that the null hypothesis is correct (and the results are random). R2 shows the amount of variability captured by the model and represents the goodness of fit for the model. Dogruoz, Rostami, and Keles (2017) reported R2 values as low as 0.40 in rock engineering applications.
The p-value for fine and medium fragmentation is <0.05 (with one exception) which means that the null hypothesis can be rejected and that there could be a correlation between the MWD readings and the fine and medium fragmented rock. For coarse and oversize material, the p-value suggests a statistically non-significant correlation. The values of R, p-value, and R2 for fine and medium categories indicate a better correlation between fragmentation and rock type than for coarse and oversize categories.
A Pearson correlation coefficient measures the extent to which two variables tend to change together, i.e., linearly. If the relationship is not strictly linear, the Spearman correlation coefficient can be used (Hauke and Kossowski, 2011). The Spearman correlation evaluates the monotonic relationship between two continuous or ordinal variables. In a monotonic relationship, the variables tend to change together, but not necessarily at a constant rate. Table VI lists a comparison of Pearson and Spearman correlation coefficients. It indicates a higher correlation for Spearman than for the Pearson correlation coefficient. This suggests a monotonic relationship between the variables under observation. More importantly, both coefficients suggest the same relationship, i.e., fine and medium categories have better correlation than coarse and oversize fragmentation categories.
Partial least-squares regression
The rock mass categories extracted from MWD analysis are not independent variables but relates to each other, so if some category is bigger, the other one is reduced. The parameters from the fragmentation analysis have a similar relationship. That means that multicollinearity exists between the explanatory and the response variables. Therefore, PLS regression was used since it has the ability to handle multiple variables and consider all the associations between variables simultaneously as well as deal with multicollinearity. The PLS components are linear combinations of the explanatory (MWD) variables that maximize their covariance with response (QRS) variables.
Figure 7 illustrates the quality indices of the PLS regression model for the first two model components. The figure shows the Q2 cumulative index, which represents the global goodness of fit and predictive quality of the model. R2Y cumulative and R2X cumulative measure the cumulative fraction of the variation of the Y (QRS) and X (MWD) variables, respectively. The cumulative Q2 has a relatively low value, suggesting the quality of fit is weak. The R2X for comp. 1, however, shows a very high value (88.2%) that indicates that the variance in the explanatory variables (MWD) is well captured by the first component and the second component increases the explained variance to 97.5%.
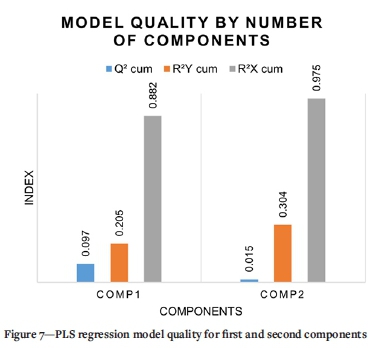
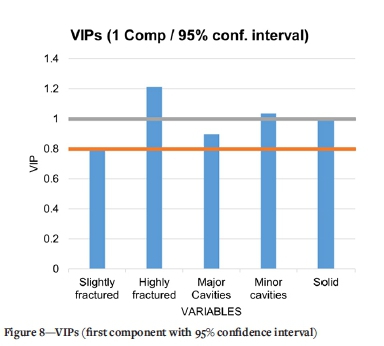
Figure 8 shows the variable importance projection (VIP) for each independent variable for the first component. Values above or close to unity are considered important and therefore those variables cannot be excluded from the model. Values significantly less than unity are less important and the corresponding variables can be excluded from the model. It can be seen in the figure that all variables are above or relatively close to unity and can therefore be considered as important for the model.
In order to predict fragmentation, four regression models were made in PLS. The model parameters are presented in Table VII together with the R2 values for the respective models. R2 values for the models of fine and medium fragmentation suggest a better model fit compared to coarse and oversize fragmentation, which supports the results from the Pearson and Spearman correlation tests. That concludes that fine and medium rock fragmentation can be better predicted than coarse and oversize fragmentation.
The four regression models defined in Table VII are visualized in Figure 9, where the comparison of actual versus predicted fragmentation values for different categories is shown.
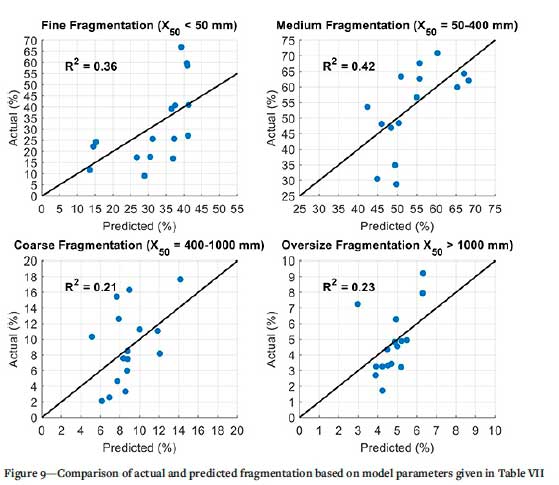
Figure 9 shows a more visible correlation for fine and medium fragmentation than for coarse and oversize fragmentation. This agrees with the correlation results, that solid rock tends to produce more fine fragmentation. In solid rock and rock with low fracturing the charging and blasting procedures face fewer challenges and uncertainties. Hence, the corresponding fragmentation will be better predicted for such rock mass types. This agrees with Akbari et al. (2018), who showed a positive correlation between discontinuities and fragmentation size, which means that an increase in fractures or discontinuities spacing, increases fragmentation size.
This study shows that it is possible to predict fragmentation in an SLC mine using MWD data, which can therefore be a very useful tool for mine productivity improvement. The model may be further improved using chargeability data, which is known to have a major impact on the blasting result.
Conclusions
Drilling is an integral part of sublevel caving operations, and it is done before the rock mass is charged and blasted. This means that MWD data is available for interpretation purposes well before charging and blasting take place. The correlation test results presented in this paper shows that MWD data can be used to predict fragmentation in an SLC mine and can therefore be a very useful tool for fragmentation control and in the material handling processes.
The study showed that a solid rock mass tends to produce more fine fragmentation. This may be explained by better and more optimal charging and blasting conditions in solid rock. In a disturbed rock mass, however, the analysis shows that less fines can be expected. In this case, poor rock conditions that may cause charging and blasting problems can be expected to result in coarsely fragmented material.
Compared to traditional MWD filtration based on fixed threshold limits, the newly developed filtering method based on time series was, in the correlation analysis, found to better reject unrealistic drilling behaviour and therefore better represent the true characteristics of the rock mass.
Acknowledgments
The authors acknowledge LKAB and the staff and management of Malmberget mine for their valuable input and support during field studies. Vinnova, the Swedish Energy Agency and Formas are acknowledged for financing this project through the SIP-STRIM programme. Finally, the authors would like to acknowledge the support from the Centre for Advanced Mining and Metallurgy (CAMM2), Sweden and the illuMINEation project funded by the European Union's Horizon 2020 research and innovation programme under the grant agreement no. 869379.
References
Akbari, M., Lashkaripour, G., Yarahamdi, B.A., and Ghafoori, M. 2015, Blastability evaluation for rock mass fragmentation in Iran central iron ore mines. International Journal of Mining Science and Technology, vol. 25. pp. 59-66. [ Links ]
Andersson, F. 2016. Laddbarhet i rasborrhál i Malmbergsgruvan. Luleá University of Technology, Luleá, Sweden. [ Links ]
Azimi, Y., Osanloo, M., Aakbarpour-Shirazi, M., and Aghajani, B.A. 2010. Prediction of the blastability designation of rock masses using fuzzy sets. Internation Journal of Rock Mechanics and Mining Sciences, vol. 47, no. 7 pp. 1126-1140, [ Links ]
Babaeian, M., Ataei, M., Sereshki, F., Sotoudeh, F., and Mohammadi, S., 2019. A new framework for evaluation of rock fragmentation in open pit mines. Journal of Rock Mechanics and Geotechnical Engineering, vol. 11. pp. 325-336 [ Links ]
Brunton, I.D., Fraser, S J., and Hodgins, J.H. 2010. Parameters influencing full scale sublevel caving material recorvery at the ridgeway gold mine. International Journal of Rock Mechanics and Mining Sciences, vol. 47, no. 4. pp. 647-656. [ Links ]
Campbell, A.D. and Thurley, M.J. 2017. Application of laser scanning to measure fragmentation in underground mines. Transactions of the Institutions of Mining and Metallurgy: Section A, Mining Technology, vol. 126, no. 4. pp. 240-247 [ Links ]
Chung, S.H. and Noy, M.J. 1996. Experience in fragmentation control. Measurement of Blast Fragmentation: Proceedings of the Fragblast-5 Workshop, Montreal, Quebec, Canada, 23-24 August 1996. Franklin, J.A. and Katsabanis, P.D. (eds). Balkema, Rotterdam. pp. 247-252. [ Links ]
Colombani, C., Croiseau, P., Fritz, S., Guillaume, F., Legarra, A., Ducrocq, V., and Robert-Granie, C. 2012. A comparison of partial least squares (PLS) and sparse PLS regressions in genomic selection in French dairy cattle. Journal of Dairy Science, vol. 95, no. 4. pp. 2120-2131. [ Links ]
Cramer, R.D. 1993. Partial least squares (PLS): Its strengths and limitations. Perspectives in Drug Discovery and Design, vol. 1. pp. 269-278. [ Links ]
Cunningham, C. 1996. Lessons from the Compaphoto technique of fragmentation measurement. Measurement of Blast Fragmentation. Balkema, Rotterdam. [ Links ]
Dahlhielm, S. 1996. Industrial applications of image analysis - The IPACS System. Measurement of Blast Fragmentation: Proceedings of the Fragblast-5 Workshop, Montreal, Quebec, Canada, 23-24 August 1996. Franklin, J.A. and and Katsabanis, P.D. (eds). Balkema, Rotterdam. pp. 67-71., s.n. [ Links ]
Danielsson, M., Ghosh, R., Navarro, M.J., and Jojannson, D. 2017. Utilizing production data to predict operational disturbances in sublevel caving. Proceedings of the International Symposium on Mine Planning & Equipment Selection (MPES2017), Lulea, Sweden, 29-31 August 2017. Lulea University of Technology. pp. 139-144. [ Links ]
Danielsson, M., Johansson, D. and Schunnesson, H. 2019. The impact of segregation effects on fragmentation measurements in LHD buckets. Blasting and Fragmentation, vol. 13, no. 1. pp. 47-56. [ Links ]
Dogruoz, C., Rostami, J., and Keles, S. 2017. Study of correlation between specific energy of cutting and physical properties of rock and prediction of excavation rate for lignite mines in Cayirhan area, Turkey. Bulletin of Engineering Geology and the Environmeny. doi:10.1007/s10064-017-1124-2 [ Links ]
Downs, D.C. and Kettunen, B.E. 1996. On-line fragmentation measurement utilizing the CIAS system. Measurement of Blast Fragmentation: Proceedings of the Fragblast-5 Workshop on Measurement of Blast Fragmentation, Montreal, Quebec, Canada, 23-24 August 1996. Franklin, J.A. and Katsabanis, P.D. (eds). Balkema, Rotterdam. pp. 79-82., s.n. [ Links ]
Dunstan, G. and Power, G. 2011. Sublevel caving. SME Mining Engineering Handbook. 3rd edn. Darlin, P. (ed.). Society for Mining, Metallurgy and Exploration, Littleton, CO. pp. 1417-1437. [ Links ]
Faramarzi, F., Mansouri, H., and Ebrahimi Farsangi, M.A. 2013. A rock engineering systems based model to predict rock fragmentation by blasting. International Journal of Rock Mechanics and Mining Sciences, vol. 60. pp. 82-94. [ Links ]
Franzese, M. and Luliano, A. 2019. Correlation analysis. Encyclopedia of Bioinformatics and Computational Biology. Ranganathan, S., Gribskov, M., Nakai, K., and Schonbach, C. (eds). Elsevier. pp. 706-721. [ Links ]
GeiB, S. and Einax, J. 1996. Multivariate correlation analysis - a method for the analysis of multidimensional time series in environmental studies. Chemometrics and Intelligent Laboratory Systems, vol. 32, no. 1. pp. 57-65. [ Links ]
Ghosh, R., Gustafson, A., and Schunnesson, H. 2018. Development of a geological model for chargeability assessment of borehole using drill monitoring technique. International Journal of Rock Mechanics and Mining Sciences, vol. 109. pp. 9-18. [ Links ]
Ghosh, R., Schunnesson, H., and Gustafson, A. 2017. Monitoring of drill system behavior for water-powered in-the-hole (ITH) drilling. Minerals, vol. 7, no. 121. https://doi.org/10.3390/min7070121 [ Links ]
Ghosh, R., Zhang, Z., and Nyberg, U. 2015. Borehole instability in Malmberget underground mine. International Journal of Rock Mechanics and Rock Engineering, vol. 48. pp. 1731-1736. [ Links ]
Gustafson, A., Jonsson, K., Johansson, D., and Schunnesson, H. 2016. From face to surface - A fragmentation study. MassMin 2016. Proceedings of the Seventh International Conference & Exhibition on Mass Mining, Sydney, Australia, 9-11 May 2016. Australasian Institue of Mining and Metallurgy, Melbourne. pp 555-562. [ Links ]
Hauke, J. and Kossowski, T. 2011. Comparison of values of Pearson's and Spearman's correlation coefficient on the same sets of data. Quaestiones Geographicae, vol. 30, no. 2. pp. 87-93. [ Links ]
Havermann, T. and Vogt, W. 1996. TUCIPS - A system for the estimation of fragmentation after production blasts. Measurement of Blast Fragmentation: Proceedings of the Fragblast-5 Workshop on Measurement of Blast Fragmentation, Montreal, Quebec, Canada, 23-24 August 1996. Franklin, J.A. and Katsabanis, P.D. (eds). Balkema, Rotterdam. pp. 59-65. [ Links ]
Hunter, G.C., McDermott, C., Miles, N.J., Singh, A., and Scoble, M.J. 1990. A review of image analysis techniques for measuring blast fragmentation. Mining Science and Technology, vol. 11. pp. 19-36. [ Links ]
Hustrulid, W. and Kvapil, R. 2008. Sublevel caving - past and future. Proceedings of the 5th International Conference and Exhibition on Mass Mining, Lulea, Sweden. https://www.u-cursos.cl/ingenieria/2009/2/MI58B/1/material_docente/bajar?id_material=257763 [ Links ]
Johansson, D. 2011. Effects of confinement and initiation delay on fragmentation and waste rock compaction. Doctoral thesis, Lulea University of Technology, Lulea, Sweden. [ Links ]
Kemeny, J.M. 1994. Practical technique for determining the size distribution of blasted benches waste dump and heap leach sites. Mining Engineering, vol. 46, no. 11. pp. 1281-1284. [ Links ]
Khorzoughi, M.B. 2013. Use of measurement while drilling techniques for improved rock mass characterization in open-pit mines. Masters thesis: University of British Columbia, Vancouver, Canada. doi: 10.14288/1.0073823 [ Links ]
Kleinbaum, D.G., Kupper, L L., Muller, K.E., and Nizam, A. 1998. Applied Regression Analysis and Other Multivariable Methods. 3rd edn. Duxbury Pres, Pacific Grove, CA. [ Links ]
Kleine, T.H. and Cameron, A.R. 1996. Blast fragmentation measurement using Goldsize. Measurement of Blast Fragmentation: Proceedings of the Fragblast-5 Workshop on Measurement of Blast Fragmentation, Montreal, Quebec, Canada, 23-24 August 1996. Franklin, J.A. and Katsabanis, P.D. (eds). Balkema, Rotterdam. pp. 83-89. [ Links ]
Latham, J.P. and Lu, P. 1999. Development of an assessment system for the blastability of rock. International Journal of Rock Mechanics and Mining Sciences, vol. 36. pp. 41-55, [ Links ]
Leighton, J.C. 1982. Development of a correlation between rotary drill performance and controlled blasting powder factors. Masters thesis, University of British Columbia, Vancouver, Canada. doi: 10.14288/1.0095103 [ Links ]
LKAB. 2020. Retrieved February, 2020, from https://www.lkab.com/en/about-lkab/from-mine-to-port/mining/our-underground-mines/ [ Links ]
Lorber, A., Wangen, L.E., and Kowalski, B.R. 1987. A theoretical foundation for the PLS algorithm. Journal of Chemometrics, vol. 1, no. 1. pp. 19-31. [ Links ]
Lund, C. 2013. Mineralogical, chemical and textural characterisation of the Malmberget iron ore deposit for a geometallurgical model. Doctoral thesis, Lulea University of Technology, Lulea, Sweden. [ Links ]
Lundin, M. 2020. Laddbarhet och borrhalsstabilitet i produktionsborrhal -Kirrunavaara gruva. Lulea University of Technology, Lulea, Sweden. [ Links ]
Maerz, N.H., Palangio, T.C., and Franklin, J.A. 1996. The Wipfrag image based granulometry system. Measurement of Blast Fragmentation: Proceedings of the Fragblast-5 Workshop on Measurement of Blast Fragmentation, Montreal, Quebec, Canada, 23-24 August 1996. Franklin, J.A. and Katsabanis P.D. (eds). Balkema, Rotterdam. pp. 91-98., s.n. [ Links ]
Manzoor, S., Liaghat, S., Gustafson, A., Johansson, D., and Schunnesson, H. 2020. Establishing relationships between structural data from close-range terrestrial digital photogrammetry and measurement while drilling data. Engineering Geology, vol. 267. Article ID 105480. [ Links ]
Manzoor, S., Gustafson, A., Johansson, D., and Schunnesson, H. 2022. Rock fragmentation variations with increasing extraction ratio in sublevel caving: a case study. International Journal of Mining, Reclamation and Environment, 36:3, 159-173, DOI: 10.1080/17480930.2021.2000826 [ Links ]
Monjezi, M., Rezaei, M., and Varjani, A.V. 2009. Prediction of rock fragmentation due to blasting in Gol-E-Gohar iron mine using fuzzy logic. International Journal of Rock Mechanics and Mining Sciences, vol. 46. pp. 1273-1280. [ Links ]
Morin, M.A. and Ficarazzo, F. 2006. Monte Carlo simulation as a tool to predict blasting fragmentation based on the Kuz-Ram model. Computers & Geosciences, vol. 32. pp. 352-359. [ Links ]
Navarro, J., Schunnesson, H., Ghosh, R., Segarra, P., Johansson, D., and Sanchidrian, J.A. 2019. Application of drill-monitoring for chargeability assessment in sublevel caving. International Journal of Rock Mechanics and Mining Sciences, vol. 119. pp. 180-192. [ Links ]
Ouchterlony, F. and Sanchidrian, J.A. 2019. A review of development of better prediction equations for blast fragmentation. Journal of Rock Mechanics and Geotechnical Engineering, vol. 11. pp. 1094-1109. [ Links ]
Petropoulos, N. 2015. Burden dynamics and fragmentation. Lulea University of technology, Lulea, Sweden. [ Links ]
Power, G.R. 2004. Modelling granular flow in caving mines: large scale physical modelling and full scale experiments. PhD thesis, University of Queensland, Brisbane, Australia. [ Links ]
Raina, A.K., Choudhary, P.B., Ramulu, M., Chakraborty, A.K., Dudhankar, A.S., Udpikar, V., Ghatpande, N., and Misra, D.D. 2002. Fragalyst - An indigenous digital image analysis system for fragment size measurement in mines. Journal of the Geological Society of India, vol. 59. pp. 561-569. [ Links ]
Rodgers, M., McVay, M., Horhota, D., and Hernando, J. 2018. Assessment of rock strength from measuring while drilling shafts in Florida limestone. Canadian Geotechnical Journal, vol. 55, no. 8. pp. 1154-1167. [ Links ]
Schleifer, J. and Tessier, B. 1996. Fragscan, a tool to measure fragmentation of blasted rock. Measurement of Blast Fragmentation: Proceedings of the Fragblast-5 Workshop on Measurement of Blast Fragmentation, Montreal, Quebec, Canada, 23-24 August 1996. Franklin, J.A. and Katsabanis, P.D. (eds). Balkema, Rotterdam. pp. 73-78. [ Links ]
Schunnesson, H. 1996. RQD prediction based on drill performance. Tunnelling and Underground Space Technology, vol. 11, no. 3. pp. 345-351. [ Links ]
Segui, J.B. and Higgins, M. 2002. Blast design using measurement while drilling parameters. Fragblast: International Journal for Blasting and Fragmentation, vol. 6, no. 3-4. pp. 287-299. [ Links ]
Shekhar, G. 2020. Draw control strategy for sublevel caving mines: A holistic approach. Doctoral thesis, Lulea University of Technology, Lulea, Sweden. [ Links ]
Shekhar, G., Gustafson, A., Boeg-Jensen, P., and Schunnesson, H. 2016. Draw control optimisation along the production drift in sublevel caving. Proceedings of the Seventh International Conference & Exhibition on Mass Mining, Sydney, Australia. Australasian Institute of Mining and Metallurgy, Melbourne. https://www.onemine.org/document/document.cfm?docid=234536&docorgid=2 [ Links ]
Silva, J.D., Amaya, J.G., and Basso, F. 2017. Development of a predictive model of fragmentation using drilling and blasting data in open pit mining. Journal of the Southern African Institute of Mining and Metallurgy, vol. 117. pp. 1087-1094. [ Links ]
Singh, S.P. and Narendrual, R. 2010. Causes, implications and control of oversize during blasting. Proceedings of the 9th International Symposium on Rock Fragmnetaion by Blasting, Gransda, Spain, Sanchidrian, J.A. (ed.). Taylor & Francis, London. [ Links ]
Van Eldert, J., Schunnesson, H., Johansson, D., and Saiang, D. 2019. Application of measurement while drilling technology to predict rock mass quality and rock support for tunnelling. Rock Mechanics and Rock Engineering. https://doi.org/10.1007/s00603-019-01979-2 [ Links ]
Vezhapparambu, V.S. and Ellefmo, S. L. 2020. Estimating the blast sill thickness using changepoint analysis of MWD data. International Journal of Rock Mechanics and Mining Sciences, vol. 134. 104443. https://hdl.handle.net/11250/2736204 [ Links ]
Wimmer, M. 2010. Gravity flow of broken rock in sublevel caving (SLC) - State-of-the-art. Swedish Blasting Research Centre, Lulea University of Technology. [ Links ]
Wimmer, M., Nordqvist, A., and Ouchterlony, F. 2012. D mapping of sublevel caving (SLC) blast rings and flow disturbances in the LKAB Kiruna mine. Swedish Blasting Research Centre, Lulea University of Technology. [ Links ]
Wimmer, M., Nordqvist, A., Righetti, E., Petropoulos, N., and Thurley, M. 2015. Analysis of rock fragmentation and its effect on gravity flow at the kiruna sublevel caving mine. Proceedings of the International Symposium on Rock Fragmentaion by Blasting, Sydney, Australia, 24-26 August 2015. Australasian Institute of Mining and Metallurgy, Melbourne. pp. 775-791. [ Links ]
Zhang, Z.-X. 2016. Rock Fracture and Blasting: Theory and Applications. 1st edn. Butterworth-Heinemann. [ Links ]
Zhang, Z.-X., Qiao, Y., Hou, D-F., and Chi, L. 2020. Experimental study of surface constraint effect on rock fragmentation by blasting. International Journal of Rock Mechanics and Mining Sciences, vol. 128.J http://jultika.oulu.fi/files/nbnfi-fe2021063040635.pdf [ Links ]
 Correspondence:
S. Manzoor
Email: sohail.manzoor@ltu.se
Received: 2 Apr. 2021
Revised: 1 Feb. 2022
Accepted: 2 Feb. 2022
Published: March 2022

