


Services on Demand
Article
 English (pdf)
 Article in xml format
 Article references
Indicators

Related links
-
 Cited by Google
 -
 Similars in Google
Share

 Permalink
Journal of the Southern African Institute of Mining and Metallurgy
On-line version ISSN 2411-9717
Print version ISSN 2225-6253
J. S. Afr. Inst. Min. Metall. vol.122 n.3 Johannesburg Mar. 2022
http://dx.doi.org/10.17159/2411-9717/1874/2022
PROFESSIONAL TECHNICAL AND SCIENTIFIC PAPERS
Climate impacts of fossil fuels in todays electricity systems
L. SchernikauI; W.H. SmithII
ITU Berlin, Germany. https://orcid.org/0000-0001-6469-0117
IIWashington University of St. Louis. https://orcid.org/0000-0001-9839-7023
SYNOPSIS
Oil, coal, and gas account for approximately 80% of global primary energy, but only a portion of total airborne CO2eq (approx. 35% at GWP20 to 65% at GWP100), even though they account for 95% of total measured CO2 emissions. The benefits of these energy sources, as well as their related costs, are not all incorporated in current energy policy discussions. Global greenhouse gas policies must include documented changes in measured airborne CO2eq to avoid spending large amounts of public funds on ineffective or sub-optimal policies.
The authors examined airborne CO2, which is less than half of emitted CO2, as well as reported CH4 emissions and the global warming potential of CH4 as published by the IPCC for coal and natural gas. The surprising conclusion is that surfaced-mined coal appears 'better for the climate' than the average natural gas, and all coal appears beneficial over LNG. Therefore, current CO2-only reduction policies and CO2 taxes are leading to unintended consequences and the switch from coal to natural gas, especially LNG, will not have the desired impact of reducing predicted future global warming; in fact, quite the contrary. A large portion of anthropogenic global warming is attributed by the IPCC and IEA to CH4, but it must be noted that CH4 emissions from natural sources and from agriculture account for approximately 40% and 25% of annual global CH4 emissions respectively. Energy accounts for about 20% of documented CH4 emissions.
CO2 contributes only approximately 35% of annual airborne anthropogenic GHG emissions after accounting for CH4, over a 20-year horizon. At a 100-year horizon, the contribution of CO2 increases to approximately 60%. Energy policies that do not consider all GHG emissions along the entire value chain will lead to undesired economic and environmental distortions. All carbon taxation and CO2 pricing schemes are incorrect and need to be revised.
At IPCC's GWP20 an approximately 2%1 higher loss of CH4 across the value chain prior to combustion of natural gas versus coal will lead to 'climate parity' of coal with natural gas. According to public data, natural gas value chains have high CH4 and undocumented CO2 losses. On a global average, using only IEA-documented CH4 data, natural gas emits approximately 15% more CO2eq than surface-mined coal, over a 20-year horizon. This difference will increase as the use of shale gas and LNG expands.
Investors should support all energy systems in a manner that avoids an energy crisis, including intermittent renewable energy systems where they make sense. If CO2 emissions need to be reduced, one of the most effective ways would be to install ultra-supercritical power plants with CCUS technology. However, the undisputed benefits of increased CO2 concentrations in the atmosphere because of its promotion of photosynthesis and plant growth effects (fertilization) need to be considered in energy policy decisions as well. The authors suggest that future research and development should concentrate on reducing net emissions from fossil fuel power plants and providing cost-effective and reliable new conventional power generation capacity, utilizing clean coal and clean natural gas technology.
Keywords: fossil fuels, GHG, greenhouse gases, energy policy, climate change potential, clean coal technology.
Introduction
In 2019, fossil fuels - in order of importance oil, coal, and gas - made up approximately 80% of global primary energy (PE) production totalling approximately 170 000 TWh or 600 EJ. Despite the covid pandemic and significant wind and solar capacity additions, the percentage did not change much in 2021.
This proportion has also been largely constant since the 1970s, when energy consumption was less than half what it is today. The same three fossil fuels made up over 60% of global gross electricity production, totalling approximately 27,000 TWh in 20202. It is important to note that global electricity production makes up about 40% of PE, with transportation, heating, and industry accounting for the remaining approximately 60% (see also Figure 1).
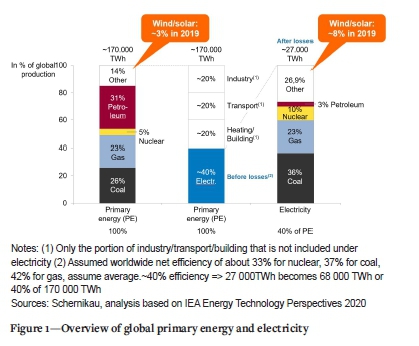
Renewables in the form of wind and solar - while not the subject of this paper - accounted for approximately 3% of global PE and 8% of global gross electricity production in 2019, and this was largely unchanged in 2020 and 2021 (refer to Schernikau and Smith, 2021, for more details on solar energy). For comparison, coal and gas combined accounted for approximately 50% of global PE and 60% of global gross electricity production.
The UN projects that global population will rise from the current 8 billion to 10 billion in the next 30 years (Roser, Ritchie, and Ortiz-Ospina, 2013), and may peak around 11-12 billion by the end of the century. Despite continued improvements in energy efficiencies, rising living standards in developing nations are forecast to increase global average annual per capita energy consumption from 21,000 kWh to 25 000 kWh by 2050 (Lomborg, 2020; BP, 2020). As a result, global PE consumption could rise by as much as 40% to 60% by 2050 (a 25% population increase and a 20% PE/capita increase translates to 50% PE demand increase). Energy demand growth is fuelled by developing nations in Asia, Africa, and South America. Developed nations are expected to consume less energy in the decades to come, owing to population stagnation or decrease, and increases in energy efficiency.
However, it should be noted that recent models by McKinsey (McKinsey Energy Insights, 2019, 2021) estimate that global PE demand will only increase by 14% by 2050, while the International Energy Agency's (IEA's) 2021 Net-Zero Pathway (IEA, 2021) models a reduction by approximately 10% by 2030 to reach 'net zero' CO2emissions (not CH4 emissions) by 2050, although this is questioned by the authors. The same reports estimate that global power generation will almost double from 2020 to 2050 (McKinsey Energy Insights. 2019), also driven by the projected electrification of transportation. The Institute for Energy Economics in Japan (IEEJ) predicts global PE demand to increase by 30% by 2050, while the American Energy Information Agency (EIA) predicts a 50% increase (IEEJ, 2019; EOA, 1019, 2021) in line with the authors' analysis.
It is prudent to assume that wind and solar alone will not be able to generate enough energy to match the expected demand increase to 2050. This is confirmed by the IEEJ's October 2020 report (IEEJ, 2019; EIA. 2019, 2021) forecasting an absolute increase in fossil fuels' share in PE in its reference case by 2050. In July 2021, the IEA (2021) confirmed that '...[renewables] are expected to be able to serve only around half of the projected growth in global [electricity] demand in 2021 and 2022'. Over 60% of global electricity growth during 2021 was fuelled by coal and natural gas (NG), and only 30% from renewables. For PE growth, the renewable share will be only a fraction, about 20%, as about 2/5th of PE is for electricity. Schernikau, Smith, and Falcon (2022) provide more details on the global energy landscape, including a discussion on the pros and cons of using PE with increased penetration of renewable energy.
Even if wind and solar were to fulfill all future increases in PE demand, it becomes clear that for the next 30 years and beyond we will continue to depend on conventional energy resources for a large portion, if not the vast majority, of our global energy needs. Therefore, given the relevance of coal and natural gas to the future energy scene, this paper examines the global warming impact of such fossil fuels.
Which fossil fuel is 'best for the climate'?
Coal and natural gas are the main fuels for electricity generation, while oil is the main fuel for transportation. Nuclear's share reaches about 10-11% for electricity and 5-6% for PE (see Figures 1 and 2). Nuclear energy is not discussed further in this paper despite its many benefits and challenges. Given the importance of coal and NG, especially for electricity but also for energy as a whole (approx. 60% of electricity and 50% of PE), the authors review the impact of both coal and NG on global warming, relying on reported data by the IPCC, the IEA, and Our World in Data.
Introducing greenhouse gases and global warming potential
It is undisputed that (1) the average global temperature has increased since the 1800s - the end of the Little Ice Age, and that (2) humans have contributed to global warming in the past and will continue to do so. It is also undisputed that (3) CO2 is a greenhouse gas (GHG) and that increasing airborne CO2 levels contribute to global temperature change, in concert with other climate forcings.
In addition, it is undisputed - though less well known -that the global warming impact of CO2 or any GHG declines logarithmically, thus each additional ton of CO2 airborne has less capacity to increase temperatures (Wijngaarden and Happer, 2020). CO2 is active in the wavelength band from about 12-18 jim, which has been essentially saturated. This works in such a way that additional CO2 molecules can only slightly widen the wavelength band in which the molecule can impact outgoing thermal radiation. In the absence of GHGs, the Earth's surface temperature would be on average about -i8°C; but with GHGs the surface reaches a temperate and livable i5°C. The 33K difference is ascribed to the so-called 'greenhouse effect' of the atmosphere (World Meteorological Organization, 2021).
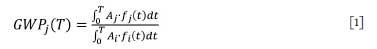
The IPCC in its 5th Assessment Report AR5 gives the global warming potential (GWP) of several of GHGs over both a 20-and a 100-year horizon. These GWPs are little changed in AR6, published in August 2021. The IPCC (2014a) defines GWP as An index measuring the radiative forcing following an emission of a unit mass of a given substance, accumulated over a chosen time horizon, relative to that of the reference substance, carbon dioxide (CO2)\ There remains scientific uncertainty and debate about the global warming potential, but for the sake of this paper the authors choose to use the official reported IPCC data3 (Cain, 2018; Derwent, 2020; ClimateAnalytics. 2017; Kleinberg, 2020; Lynch et al., 2020). For instance, the IPCC notes the large uncertainties in the GWP of CH4 - between about 32% and 40% (see IPCC, 2021, Table 7.SM8)
The definition of GWP is given in many sources, but explained well by Kleinberg (2020). Equation [1] shows that the GWP of a particular molecule j is the ratio to CO2, denoted by i in the equation, integrated over time following an initial pulse of gas at t = 0. This metric implies that a gas which decays quickly will have a greater initial GWP than a gas which decays more slowly. Kleinberg's academic paper places the GWP in the correct physics perspective while pointing out its shortcomings.
Considering the urgency of addressing global warming as well as the declared climate crisis by the UN, governments, and institutions, the authors use the IPCC's 20-year GWP20 metric for CH4 of 84X and illustrate the implication on energy policy if one were to accept the IPCC's GWP. For comparison, IPCC's 100-year GWP100 metric for CH4 is 28x. The reader can adjust from GWP20 to GWP100 by dividing or multiplying any relevant CH4 number by 3 = 84 / 28. The GWP index is not radiative forcing but is a 'metric' intended to indicate how much 'worse' or 'better' a greenhouse gas is compared to CO2 (GWP of 1) and its impact on global warming (IPCC. 2014). The following six main GHGs and their respective GWPs are mentioned by the IPCC (2014b, 2014c):
> Water vapour (H2O): The most important and most abundant GHG, but not further detailed by the IPCC. The authors are concerned that the greenhouse effect of water is not included in the IPCC analysis, apparently due to its complicated variability and energy transport effects.
> Carbon dioxide (CO2): GWP20 = 1, GWP100 = 1, no lifetime defined by IPCC
> Methane (CH4): GWP20 = 84, GWP100 = 28, lifetime 12,4 years
> Nitrous oxide (N2O): GWP20 = 264, GWP100 = 264, lifetime 121 years
> Perfluoromethane (CF4): GWP20 = 4880 years, GWP100= 6630 years, lifetime 50 000 years
> Hydrofluorocarbon (HFC-152a): GWP20 = 506, GWP100 = 138, lifetime 1,5 years
The misconception of reported global CO2 emissions and error in carbon taxing
A recent survey identified over 1,200 different climate laws and policies (Grant et al., 2020). The vast majority of reports on global CO2 emissions as well as most proposed climate policies, laws, and regulations, and global carbon-tax discussions centre on measured-human-energy CO2 emissions. This is despite recent efforts by the IEA and other institutions to understand other GHGs better, primarily the shorter-lived GHG CH4. The National Oceanic and Atmospheric Administration (Tans, 2021; Dlugokencky, 2021) notes that atmospheric concentrations of CH4 increased from about 1630 ppb (parts per billion mole-fraction CH4) in 1984 to 1880 ppb in 2021, an increase of 15% or 0,4% per annum. During the same time, the atmospheric concentration of CO2 increased from approximately 345 ppm to 415 ppm, a 20% or 0.5% annual increase (Tans, 2021; Dlugokencky, 2021).
The IEA found that in June 2021, 73% of the world's countries had announced net-zero pledges for CO2, but only 28% had policies to reduce CH4, with no zero-CH4 pledge. Governmental discussions on the 'social cost of carbon' (SCC) or any CO2 tax have led to significantly distorted policies as they entirely ignore natural CO2 uptake and other GHG emissions. GHG emission measurements should at least include CO2eq emissions from all sources, including but not limited to CH4 emissions from livestock agriculture, energy production, or natural causes (see Table I). GHG emissions from changes in land use, nitrous oxides (N2O), or fluorinated gases (F-gases), which together may add another 5-10% of total anthropogenic GHGs (Olivier and Peters, 2020), are not discussed in this paper.
The omission to include at least CH4 emissions may be driven primarily by the simplicity of measuring or easily calculating human-energy CO2 emissions. The chemistry and physics are simple for CO2, assuming a certain efficiency of a given power plant as well as measuring the tons of fossil fuel combusted. From this data, one can relatively easily estimate CO2 emissions from such a plant. For instance, 1 t of carbon equals 3,67 t of CO2, purely based on the molecular mass. Thus, the complete combustion of coal with a 50% carbon content (as-received basis) will simply result in 50% of 3,67 t, or 1,8 t, of CO2 per ton of coal burnt. These CO2 emissions are detailed by country, by application, by fuel source, by income, even by activity type, and in many other ways in quite an elaborate process at a global scale. For example, recently, credit cards have become available that can manage and limit your spending based on the 'CO2 footprint' of your purchases'.
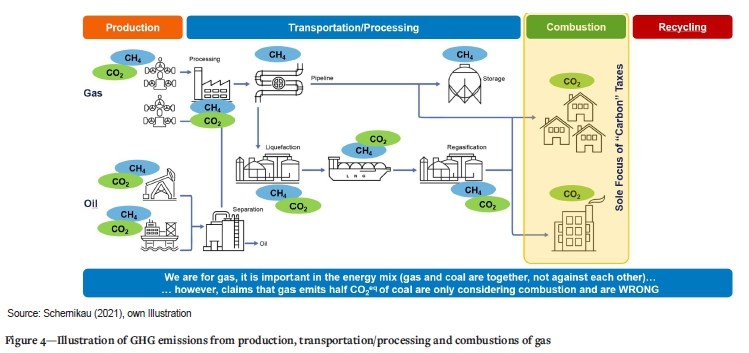
One misguided result of limiting efforts on measured-human-energy CO2 emissions is the widely accepted government policy of switching from coal to NG (in most cases to LNG) to slow or limit global warming. Consequently, many international banks, institutions, and conglomerates, e.g., the Tesla gas-fired power plant in its new Berlin Gigafactory (Randall, 2020) or the EU's plan to label natural gas as green (Abnett and Jessop, 2022), are withdrawing from coal but are actively supporting NG as a 'bridge fuel'. Another recent example, the world's leading coal-to-liquids company Sasol in South Africa was applauded for its announcement in August 2021 to develop NG. Global LNG export terminal capacity is also expected to more than double from 440 Mt in 2020 to over 1,000 Mt in 2030.
Most scientific studies, government reports, or any carbon tax for that matter, consider solely CO2 emissions from combustion when recommending NG or LNG as a bridge fuel towards a net-zero future (see Figure 4). This is indisputably wrong and leads to distorted policies, as will be explained in the following pages. A wider selection of additional studies, reports, and press releases on CH4 emissions is given in the Appendix.
Reported CO2 and CH4 emissions
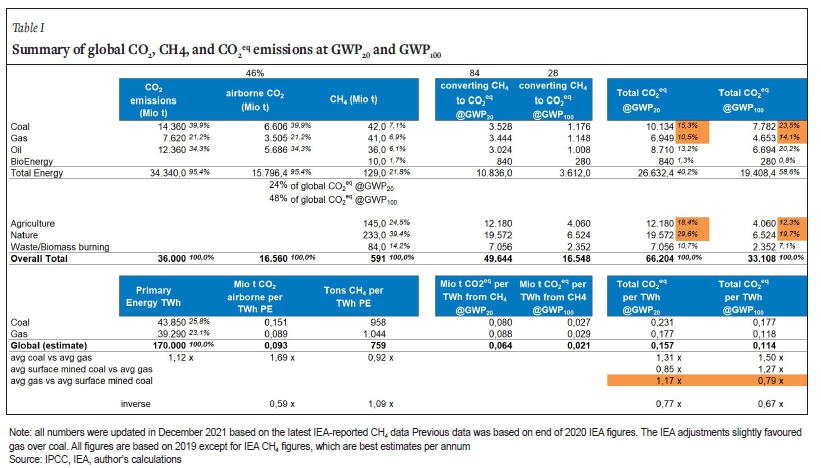
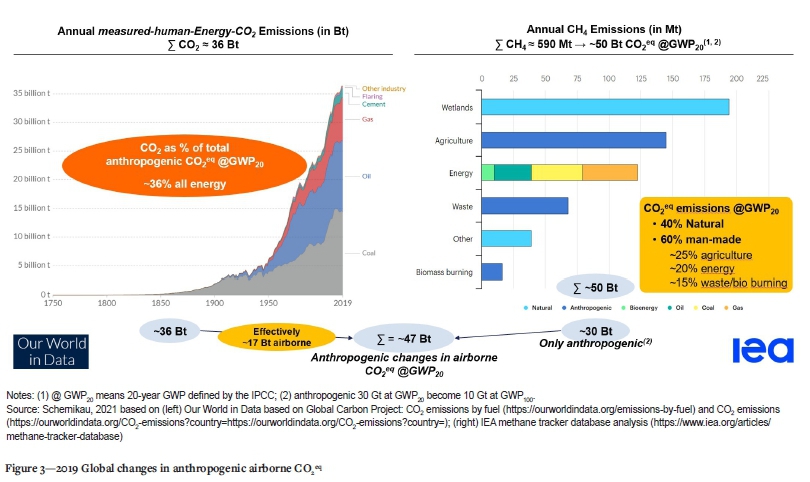
For the purpose of this paper, the authors rely on reported CO2 and CH4 emissions from the IEA and Our World in Data, which in turn rely on the Global Carbon Project, the Carbon Dioxide Information Analysis Centre (CDIAC), and Saunois et al. (2020). The IEA notes, however, that estimates of CH4 emissions are subject to a high degree of uncertainty. Top-down estimates used by the IEA are lower than bottom-up estimates, and estimates have been increasing steadily. The IEA's reported CH4 emissions data is summarized in Table I.
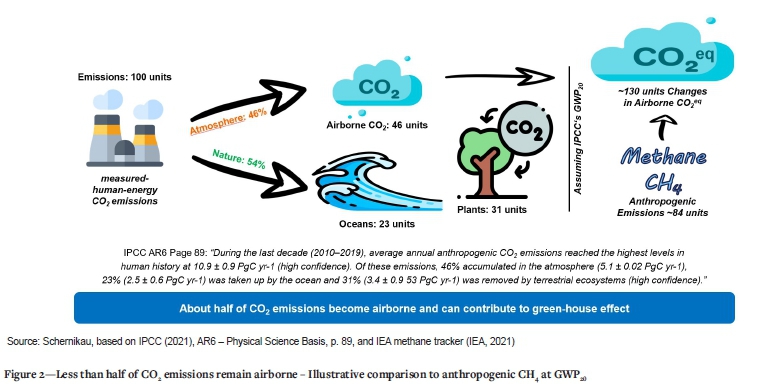
In addition, the authors rely on the IPCC's confirmation that about half of the CO2 emitted to the atmosphere disappears annually into global ecological and physical sinks, i.e., taken up by plants through photosynthesis, fertilization, and by oceans. In fact, IPCC AR6 (IPCC, 2021) states with high confidence that 54% of CO2 is removed and 46% remains airborne in the atmosphere. During the period 2010-2019, 31% of the emitted CO2 was taken up by ecosystems (e.g., plants) and 23% by the oceans.
Several other studies (e.g. Knorr, 2009) also confirm that less than half of CO2 emissions remain airborne. Logically, only airborne CO2 can contribute to the greenhouse effect. This 'natural CO2 uptake' is highly relevant when comparing CO2 to other GHG emissions that do not contribute to plant growth.
Thus, governments and institutions should switch from 'measured-human-energy CO2 emissions' toward the more correct metric that the authors call 'changes in airborne CO2eq'. Figure 2 and the following section illustrate this process.
Documented CO2 and CH4 emissions are detailed in Table I and Figure 3. Because IPCC's 20-year global warming potential (GWP20) for CH4 is 84 times higher than that for CO2, the calculations are straightforward and as follows (Ritchie and Roser, 2020a, 2020b):
> Global measured-human-energy CO2 emissions totalled 36 Gt in 2019 (95% from fossil fuels), of which 40% or 14 Gt stem from coal, 34% from oil, and 21% from NG. Approximately 54% of all CO2 emissions disappear annually, reducing 36 Gt of emission in 2019 to about 17 Gt of airborne CO2 increase that year (6,6 Gt from coal).
> Documented anthropogenic CH4 emissions total approximately 360 Mt at GWP20, resulting in 30 Gt CO2eq- 12 Gt from agriculture, 3,4 Gt from NG, 3,5 Gt from underground coal mining, 3 Gt from oil, and 8 Gt from other sources. An additional 230 Mt of CH4 result in 19,5 Gt CO2eqfrom natural sources.
> As a result, global changes in airborne CO2eq from anthropogenic sources of CO2 and CH4 at GWP20 are approximately 47 Gt (17 Gt from CO2 and 30 Gt from CH4). Fossil fuels accounted for approximately 60% of total anthropogenic CO2eq. Coal itself contributed just over 20%, oil just below 20% and NG 15%. For comparison, at GWP100 fossil fuels accounted for approximately 75% of total anthropogenic CO2eq.
> Total measured-human-energy airborne CO2 accounted for approximately 35% of the total changes in airborne anthropogenic CO2eq from both CH4 and CO2 at GWP20. When considering CH4's 100-year global warming potential GWP100 this increases to 65%.
Air pollution from coal versus gas
Coal production, transportation, and combustion adversely affect the environment in many ways, including but not limited to particulate emissions and air pollutant emissions. However, air pollution from combustion of coal is reduced to a bare minimum in modern coal-fired power plants utilizing clean coal technology where the newest filter and waste product management systems are employed. For example, the United Arab Emirates commissioned one of the world's most advanced and newest 2,4 GW ultra-supercritical (USC) coal-fired power plants in 2021 (Power Technology Energy News and Market Analysis, 2021). Such modern coal-fired power plants emit virtually only water vapour and CO2. Much investment and effort are needed to upgrade all global power plants with the newest technologies to increase their efficiency and further reduce particulate matter, SOx, and NOx emissions.
The 10-15% concentrated CO2 stream from coal plants could, in principle and if required, be captured and utilized, or stored (Tramosljika et al., 2021). Carbon capture utilization and storage (CCUS) at fossil power plants would be more effective than any direct air capture (DAC) from the 0,04% CO2 content of the atmosphere or reducing CO2 through other means. Qvist et al. (2020) present a case study for Poland.
Coal mine methane (CMM) leakages are associated primarily with underground coal mining. This is the CH4 which is released during exploitation of coal seams and is vented to the atmosphere. Coalbed methane (CBM) can be extracted for commercial utilization from unmined coal seams. This extraction is usually done either by drilling vertically into the seam (SIS methane drainage) or drilling directionally along the seam (UIS methane drainage) (Zheng et al., 2019). CBM projects that utilize the CH4 are supported under the Kyoto Protocol and investors can claim CO2 credits, either using them to offset their own emissions or by selling them on the open market.
Underground coal mines, once production is halted and the mine is abandoned, may continue to leak CH4. This leakage is referred to as abandoned mine methane (AMM) (Kholod et al., 2020). CH4 migrates into the abandoned mine from connected coal deposits. If not prevented by an adequate sealing, the liberated gas will migrate to the surface and escape to the atmosphere through natural and mining-related fractures and other conduits. On average, the CH4 content per ton of coal mined increases with increasing depth.
It is important to note that surface coal mines rarely emit CH4. Even if the coal seams had collected, emitted, or stored CH4 during burial, when the pressure is reduced or at shallower depths, the gas escapes. As a result, CH4 from coal seams closer to the surface was vented over the past millions of years. Hence, irrespective of coal quality, coal seams closer to surface and mined by opencast methods will not normally emit CH4 (Lloyd and Cook, 2005; Cook, 2013).
Much effort and investment are required to further reduce the negative environmental impact of coal production, processing, transportation, and combustion; although the technology mostly exists today. Generally, the combustion of coal causes more air pollution than NG, due to the emission of particulate matter, SOx, and NOx. Coal ash may be useful for certain industrial processes such as cement manufacturing, but is often of significant environmental liability. Also, the production and transportation of coal usually effects the environment more than NG does (other than CH4). Any unutilized leaked or 'fugitive' CH4 from coal mining can be considered a component of air pollution and contributes to the GWP of CH4.
Pollution from natural gas other than CH4 also includes SOx and NOx. Unconventional gas production generally affects the environment more than conventional gas, e.g., from chemicals used during fracking and/or drilling. Furthermore, it is understood that CH4 does not only have climate impacts but also affects air quality because it is an ingredient in the formation of ground-level ozone, a dangerous air pollutant that can cause respiratory and cardiovascular diseases. Other toxic gases and hazardous air pollutants are also emitted along with CH4; these can lead to long-term health effects or even death (CATF, 2021). CO2, on the other hand, does not affect human health unless average ambient concentrations continuously reach levels 10 to 100 times higher than current atmospheric concentrations of about 420 ppm, at which may then cause drowsiness, tiredness, and headaches. Humans exhale about 40 000 ppm (4%) of CO2. CO2 concentrations in buildings vary from 400 to 2 000 ppm (author's own measurements).
Comparison of coal and natural gas GHG emissions
Surface-mined coal versus natural gas
With the introduction of a new metric, anthropogenic 'changes in airborne CO2eq' using IPCC's GWP metric and IEA data, it is necessary to summarize and re-assess discussions on energy policy. Both coal and NG have benefits and issues. When choosing coal versus NG, all economic and environmental benefits and problems should be compared appropriately based on available data. NG is an important and favourable energy resource and is much needed for a stable and affordable energy system, as are coal, nuclear, hydro, and other resources.
Applying changes in airborne CO2eq, the authors calculated the following GHG impacts, with and without CH4 emissions, using the IPCC's GWP20 and IEA primary energy data (see Tables I and II):
> Pure combustion with zero energy-related fugitive CH4 emissions: 0,09 Mt CO2 per TWh for NG versus 0,15 Mt CO2 per TWh for coal. NG emits about 40% less CO2 than coal. This is the typical global ratio.
> With fugitive energy-related CH4 emissions: 0,18 Mt CO2eqper TWh for NG versus 0,23 Mt CO2eq per TWh for coal. NG emits about 20% less CO2eq than coal. This is the actual global ratio based on known data.
> NG versus surface-mined coal: 0,18 Mt CO2eq per TWh for NG versus 0,15 Mt CO2eq per TWh for surface-mined coal. NG emits about 15% more CO2eq than surface-mined coal.
Based on the calculations above and the fact that surface coal mines rarely emit CH4, it can be demonstrated that at GWP20, on a global average, surface-mined coal emits about 15% less CO2eqthan NG. This figure increases as the use of shale gas and LNG expands. For completeness, at a 100-year horizon, at GWP100 surface-mined coal still emits about 25% more CO2eq than average NG when comparing primary energy supply. However, for LNG the situation does not look as favourable even at GWP100 where coal is on par with NG at approximately 5% additional CH4 loss prior to LNG combustion (see Table I and calculations in Ritchie and Roser, 2020a). It must be noted that if one were to use electricity production, rather than primary energy, as the basis for comparison, the ratios further improve in favour of coal since gas causes higher CH4 emissions for less electricity produced. However, it is difficult to detail the non-electricity energy contributions of gas and coal, and therefore the authors chose to use PE only, which is also more conservative and relevant to this analysis.
In addition to CH4, CO2 is also emitted during NG (and especially LNG) production and processing. These CO2 emissions are currently not considered in the life-cycle analysis of the gas chain; neither are they included in the reported global CO2 emission data nor in the analysis herein. The Institute for Energy Economics and Financial Analysis (IEEFA, 2020) presented a detailed analysis of the Australian LNG industry and associated CO2 emissions with the subtitle 'Increased Emissions [from LNG] Have Offset Any Gains From Renewables' Rise in Electricity Generation'. The IEFFA reports that new Australian LNG projects emit on average 0,7 t CO2 per ton LNG during production only. For example, according to the report, the Darwin LNG Barossa field may even emit 2,4 to 3,6 t CO2 per ton LNG, thus 'the total project could become a CO2 venting factory with an LNG by-product'. Another documented example is the CO2 emissions of the Western Australian Gorgon LNG project. The Conservation Council of Western Australia (2019) documented in 2019 that Western Australian LNG operations emit on average approximately 0,6t CO2 per ton LNG produced. The CO2 streams stem from the raw feed gas extracted from the oceans that is vented to the atmosphere. This stream of CO2 was planned to be captured but this was not fully implemented by 2021(Milne, 2019; Morton, 2021) (see also Figure 4).
We reiterate, the analysed CO2eq figures in this paper do not consider any CO2 emissions associated with LNG production, processing, or transportation and thus underestimate the total CO2eq emissions of natural gas.
Total global natural gas versus coal
It is important to keep in mind that fugitive CH4 must include all CH4 sources and not only those from energy. Sources of CH4 must include agriculture, wetlands, waste disposal, thawing permafrost, and others as documented by the IEA (see Figure 3). Natural CH4 emissions amount to about 40%, and agriculture to about 25%, of total annual fugitive CH4 (see Table I). The GWP then dictates the global warming potential of CH4 from all sources other than from energy. These non-energy CH4 emissions dominate CO2eqemissions from all coal. The competition is not even a close race, and little can be done to alter this ratio since wetlands and agricultural sources are inviolate in the global ecology and in the sustenance of human populations. Ocko et al. (2021) conclude that CH4 accounts for 'at least a quarter of today's gross warming and also detail estimates of natural CH4 sinks. The IEA (2021) stated in 2021 that 'Methane has contributed around 30% of the global rise in temperature today'.
In addition, using the GWP20 metric it can now be demonstrated that marginally, NG emits more CO2eq than the average coal as soon as more than about 2%1 of CH4 is lost prior to gas combustion compared to coal along the value chain of production, processing, and transportation of pipeline natural gas (PNG) or LNG. For comparison, using GWP100 coal reaches climate parity with NG at about 5% additional CH4 loss prior combustion4. This figure is principally confirmed by Ladage et al. (2021), who estimate a break-even CH4 leakage rate of 2,7% for the USA and 4,1% for Germany. However, Ladage et al. do not consider the natural CO2 uptake as confirmed by the IPCC, and thus overestimate the break-even CH4 leakage rate by about 50%. The exact relationship of natural gas or LNG to coal depends on the origin of the gas, the distance and efficiency of the gas logistics, as well as the technology used for refining, liquefaction, transportation, and regasification (Figure 4 and Appendix). It is relatively certain and the authors' understanding, though unproven due to lack of data, that the global LNG supply chain on average results in CH4 leakages greater than 5% (see Appendix).
Costs and benefits of carbon dioxide and methane
The value chain for production, transport, and use of oil, PNG, and LNG is illustrated in Figure 4. Current CO2 taxation and related policies primarily target the combustion stage (right side) only. Based on annual global CH4 emissions of approximately 590 Mt and total anthropogenic emissions of about 360 Mt, anthropogenic CO2eq emissions from CH4 are about four times higher than CO2 emissions from coal alone, at GWP20 (see Table I). LNG and shale gas production, processing, and/or transportation increase fugitive CH4 emissions per unit of energy produced and make the situation even less favourable for gas.
This conclusion is a surprise and one that was not anticipated by the authors. When we factored in the GWP20 value from the IPCC AR5 and AR6 reports, the GWP for CH4 - from all sources - dominates the equation. CH4, until combusted, is a far more potent greenhouse gas (for caluclations see footnote4 on page 139) than CO2, and it lacks the beneficial role of CO2 in photosynthesis which compensates at least part of other possible effects of CO2 on the climate.
As discussed earlier, both CO2 and CH4 are GHGs that contribute to global warming. For this reason, both the costs and the benefits of CO2 and CH4 should be considered in any cost and benefit analysis of each hydrocarbon (coal, natural gas, and oil) compared to renewable sources of power. Readers are invited to consider the general practice in Western Europe to couple intermittent wind or solar with natural gas (see new gas fired-power plants in Germany or the EU's plan to put gas on the 'green' list (Abnett and Jessop, 2022; Independent, 2021).
Disregarding any benefits from CO2, Nobel Prize winner Professor William Nordhaus (2018) calculated a GDP cost of 2,8% in 2100 from global warming, assuming his optimal scenario with 4,1°C warming. For comparison, the UN announced (UNFCC, 2021) that their current climate trajectory is in line with about 2,7°C warming from pre-industrial times (1850-1900) until the end of century, of which 1,1°C to 1,2°C has already occurred.
Based on his work, Nordhaus earned the Nobel Prize for 'Climate Economics' in 2018. He estimates the GDP cost of global warming under different scenarios using his DICE model (the merits of using the GDP metric will not be elaborated in this paper). Suffice to say that Nordhaus makes the following important statements confirming that reduced use of fossil fuels will lead to reduced growth and therefore wealth:
> the revised DICE model shows more rapid growth of output in the baseline or "no-[climate]-policy"path compared to earlier DICE versions and most other models.
> the international target for climate change with a limit of 2°C appears to be infeasible with reasonably accessible technologies even with very ambitious abatement strategies. This is so because of the inertia of the climate system, of rapid projected economic growth in the near term, and of revisions in several elements of the model.
>- 'A target of 2,5°C is technically feasible but would require extreme and virtually universal global policy measures in the near future.'
Professor Nordhaus' optimal DICE scenario corresponds to a peak in CO2 emissions (not airborne CO2eq) around 2050 at approximately 40 Gt and a global warming of 4,1°C using the implausible IPCC RCP8,5 climate scenario. For comparison, it is predicted that covid-19 will cause up to a 10% drop in GDP by 2050; in line with the 10% drop in GDP after 3 years during the Great Depression (IEEJ , 2020). Lomborg (2020) and Kahn et al. (2021) principally confirm Nordhaus' calculations.
The potential effects of climate changes may be considerable and should not be discounted. However, the benefits of increased CO2 concentrations in the atmosphere because of their undisputed fertilization effects on plants are confirmed by numerous peer-reviewed studies, a selection of which is listed by Idso (2021). In addition to adjusting for CO2 fertilization, the modelled economic impact of global warming - to be fair and complete - should be compared to the costs and impacts of prematurely forcing energy systems away from conventional fuels prior to having a truly sustainable energy solution.
Carbon, oxygen, hydrogen, and nitrogen are the four most important elements for life. CO2 is a key building block for all life on Earth as all plant life depends on CO2, water, and solar radiation for photosynthesis. In fact, atmospheric CO2 is the sole source of carbon contained in plants, and therefore in human and animal bodies.
The CO2 concentration in the atmosphere increased by a little more than 0,01% or 100 ppm (by over 30%) in the past 100 years, apparently due mainly to combustion of carbon-rich oil, coal, and NG. The release of this additional CO2 has contributed to warming and to noticeable greening of our planet. NASA and the World Economic Forum confirm that elevated CO2, slight warming, and precipitation increases contribute to the overall net greening of the Earth over the past decades (NASA Earth Observatory. 2019, Dunne, 2019). The increase in the Leaf Area Index (LIA) and Vegetation Index due to CO2 fertilization has been confirmed by several researchers, e.g., Zaichun et al. (2016) and Wang et al. (2020). This greening is crucial in providing sufficient food to the growing population and its benefits have not been properly calculated. Zhu et al. (2016) point out that vegetation increased by about 14% from 1981 to 2014, about 70% of which is due to CO2 fertilization. The growth equals an area twice as large as the USA. Deforestation counteracts CO2 fertilization and needs to be further reduced; however, at a global scale, more biomass is added than is lost by deforestation.
Atmospheric CH4, in contrast, has no benefit to the environment but only costs. CH4 needs to be captured to have value for energy generation. CH4 that ends up in the atmosphere, according to the IPCC, is a far more potent GHG causing global warming (see footnote4, p.139). Additionally, it is understood that CH4 does not only have climate impacts but also affects air quality because it is an ingredient in the formation of ground-level ozone, a dangerous air pollutant.
In summary, higher CO2 emissions such as those from fossil fuel combustion are more beneficial for plant life relative to lower CO2 emissions (the emphasis is on plant life). Higher CH4 emissions have no benefit to the environment, are a potential health hazard, and have a larger GHG effect. These undisputed facts also need to be considered in energy policy.
Conclusions
This paper has sought to raise awareness that oil, coal, and natural gas account for approximately 80% of global PE and 95% of measured-human-energy CO2 emissions, but a smaller portion of total anthropogenic airborne CO2eq (about 55% at GWP20 to 70% at GWP100). The benefits of these energy sources as well as their related costs are not all incorporated in current energy policy discussions. Anthropogenic CO2 emissions account only for about 35% of total anthropogenic airborne CO2eq at GWP20 (60% at GWP100) after accounting for CH4.
It is evident that global GHG policies at least need to include documented changes in anthropogenic measured airborne CO2eqto avoid spending large amounts of public funds on ineffective or sub-optimal policies. Nowadays many governments, most global funds, international banks, conglomerates, and insurers have publicly announced they will abandon coal but will continue to support LNG and PNG projects, which are required to power human life.
The authors recommend that energy policies be reviewed taking all available information into account. Policies that focus only on combustion but leave out the true and full life-cycle emissions of all types from mining, processing, transportation, and utilization will lead to environmental surprises and potentially very large economic costs. The authors strongly support the fact that energy from all sources, including natural gas, oil, coal, nuclear, and renewables, is required to eradicate poverty. Increased wealth translates to increased resilience against illness and natural disasters.
Applying the IPCC's 20-year global warming potential GWP20, measured CH4 emissions significantly outstrip global anthropogenic airborne energy-related CO2, or coal's total CO2eqemissions (see Tables I and II). Moreover, the dominant CH4 emissions are not from human energy-related sources, which contribute only about 20%, but they arise from natural wetlands, agriculture, and waste handling. Elimination of those CH4 sources would mean eliminating biologically productive areas, food resources, and the waste products of billions of people (Figure 3).
Using UN-funded IPCC and IEA data sources, it can be calculated that at GWP20, on a global average, surface-mined coal emits about 15% less CO2eq than natural gas. This figure increases as the use of shale gas and LNG expands. At a 100-year horizon (GWP100) surface-mined coal still emits 25% more CO2eq than average NG. However, for LNG the situation does not look as favourable, even at GWP100 where coal is on a par with NG at 5% additional CH4 loss prior to combustion. Additional CO2 releases from NG or LNG production are not measured nor accounted for. These observations make the case that investors should not favour NG over coal for electricity production but should support all energy systems in a manner that avoids an energy crisis, including variable renewable energy systems where they make sense. If CO2 emissions need to be reduced, one of the most effective ways would be to install CCUS technology (Tramosljika et al., 2021) However, the benefits of CO2 through fertilization need to be fairly considered and evaluated.
The authors suggest that future research and development should concentrate on reducing net emissions of fossil fuel power plants and providing cost-effective and reliable conventional new power generation projects. This should be dedicated to ultra-supercritical (USC) power plants for increased efficiency, whether fossil fuel-fired or biomass-fired. The introduction of USC technologies is already growing in China and other countries and should be introduced - possibly at no cost to accelerate their deployment - to all developing countries, such as Bangladesh, Pakistan, Vietnam, Indonesia, South Africa, Kenya, Nigeria, and countries in South America. China, instead of forswearing support for coal-fired plants outside its borders, could then justify support for construction of efficient USC plants worldwide. Such advanced high-efficiency and low-emission (HELE) plants could replace less efficient existing power plants or even provide new facilities, all of which would support increasing economic activity, reduce emissions, and improve the quality of life for the growing population.
USC technology would have an immediate positive effect on nature (Tramosljika et al., 2021) at a lower cost than installing grid-scale intermittent renewable energy systems with the required backup or storage. Fossil fuels, including natural gas and coal, require investment, not divestment, in the interest of our planet's health and to eradicate (energy) poverty.
Acknowledgement
The authors declare that they did not receive any financial or other support from any company or organization for this paper.
Key abbreviations
CCUS Carbon capture utilization and storage
CO2eq CO2 equivalents incorporating IPCC's Global Warming Potential of CH4
GHG Greenhouse gas
GWP Global Warming Potential (specified over 20 years or 100 years)
IEA International Energy Agency
IPCC Intergovernmental Panel on Climate Change
LNG Liquified natural gas
NG Natural gas
PE Primary energy
USC Ultra-supercritical
References
Abnett, K. and Jessop, S. 2022. EU drafts plan to label gas and nuclear investments as green. Reuters, January 2022. https://www.reuters.com/markets/commodities/eu-drafts-plan-label-gas-nuclear-investments-green-2022-01-01/ [accessed 4 January 2022]. [ Links ]
AfricaNews. 2021. The African Energy Chamber commends industry leaders Sasol and the Central Energy Fund (CEF) on their Memorandum of Understanding regarding natural gas development. https://www.africanews.com/2021/09/07/the-african-energy-chamber-commends-industry-leaders-sasol-and-the-central-energy-fund-cef-on-their-memorandum-of-understanding-regarding-natural-gas-development/ [accessed 25 October 2021]. [ Links ]
Australasian Centre for Corporate Responsibility. 2020. BHP: not good enough; try harder. https://www.accr.org.au/news/bhp-not-good-enough-try-harder/ [accessed 25 October 2021]. [ Links ]
Bloomberg. 2021. The cheap and easy climate fix that can cool the planet fast. https://www.bloomberg.com/graphics/2021-methane-impact-on-climate/ [accessed 25 October 2021]. [ Links ]
BP. 2020. BP donates TPES/capita at 75,7GJ/capita = 21,023 kWh/capita in 2019, https://www.bp.com/en/global/corporate/energy-economics/statistical-review-of-world-energy/primary-energy.html [accessed 25 October 2021]. [ Links ]
Cain, M. 2018. Guest post: A new way to assess 'global warming potential' of short-lived pollutants. carbonbrief.org. https://www.carbonbrief.org/guest-post-a-new-way-to-assess-global-warming-potential-of-short-lived-pollutants [accessed 25 October 2021]. [ Links ]
CCWA (Conservation Council of Western Australia). 2019. RUNAWAY TRAIN: The impact of WA's LNG industry on meeting our Paris targets and national efforts to tackle climate change. https://apo.org.au/sites/default/files/resource-files/2019-11/apo-nid266691.pdf [accessed 25 October 2021]. [ Links ]
CIRAIG (International Reference Center for Life Cycle of Products, Processes and Services). 2016. Critical Review Report: GHG Emissions Related to the Life Cycle of Natural Gas and Coal in Different Geographical Contexts. Prepared for TOTAL Gas Division, June 2016. p. 5. https://www.ciraig.org/pdf/CIRAIG_LCA_gas_vs_coal_final_report_version.pdf [accessed 25 October 2021] [ Links ]
Clean Air Task FoRCe (CATF). 2021. The health effects of methane and other associated gases. https://cutmethane.eu/learn/the-health-effects-of-methane-and-other-associated-gases/ [accessed 25 October 2021]. [ Links ]
ClimateAnalytics. 2017. Why using 20-year Global Warming Potentials (GWPs) for emission targets is a very bad idea for climate policy. https://climateanalytics.org/briefings/why-using-20-year-global-warming-potentials-gwps-for-emission-targets-is-a-very-bad-idea-for-climate-policy/ [accessed 25 October 2021]. [ Links ]
CNN. 2021. Scientists say this invisible gas could seal our fate on climate change. https://edition.cnn.com/2021/08/11/us/methane-climate-change/index.html [accessed 25 October 2021]. [ Links ]
Cook, A.P. 2013. Fugitive greenhouse gas emissions from South African coal mines. Executive Summary. Project 6.2. Coaltech, Johannesburg, South Africa, Jun 2013. [ Links ]
Derwent, R.G. 2020. Global warming potential (GWP) for methane: Monte Carlo analysis of the uncertainties in global tropospheric model predictions. Atmosphere, vol. 11, no. 5. May 2020. doi: 10.3390/atmos11050486. https://www.mdpi.com/2073-4433/11/5/486 [accessed 25 October 2021]. [ Links ]
Dlugokencky, E. 2021. Trends in atmospheric methane. NOAA/GML. https://gml.noaa.gov/ccgg/trends_ch4/ [accessed 25 October 2021]. [ Links ]
Dunne, D. 2019. One third of the world's new vegetation is in India and China, data shows. World Economic Forum. https://www.weforum.org/agenda/2019/02/one-third-of-world-s-new-vegetation-in-china-and-india-satellite-data-shows [accessed 25 October 2021]. [ Links ]
EIA. 2019. Today in Energy. https://www.eia.gov/todayinenergy/detail.php?id=41433 [accessed 25 October 2021] [ Links ]
EIA. 2021. Annual Energy Outlook 2021. https://www.eia.gov/outlooks/aeo/ [accessed 25 October 2021]. [ Links ]
Energy Watch Group. 2019. Natural gas makes no contribution to climate protection. http://www.energywatchgroup.org/wpcontent/uploads/EWG_Natural_Gas_Study_September_2019.pdf [accessed 25 October 2021]. [ Links ]
Financial Times. 2020. BHP targets 30% cut in carbon emissions by 2030. https://www.ft.com/content/9cffdac1-aba9-407d-a236-7560ab2e0554? [accessed 25 October 2021]. [ Links ]
Grant, N., Hawkes, A., Napp, T., and Gambhir, A. 2020. The appropriate use of reference scenarios in mitigation analysis. Nature Climate Change, vol. 10. pp. 605-610. doi: 10.1038^41558-020-0826-9. https://www.nature.com/articles/s41558-020-0826-9#citeas [accessed 25 October 2021]. [ Links ]
Howarth, R.W. 2019. Ideas and perspectives: Is shale gas a major driver of recent increase in global atmospheric methane? Biogeosciences, vol. 16. pp. 3033-3046, https://doi.org/10.5194/bg-16-3033-2019 [accessed 25 October 2021]. [ Links ]
Idso, C. 2021. CO2 Science.s http://www.co2science.org/subject/b/bioproductivity,php and http://www.co2science.org/articles/V24/jan/a5.php [accessed 25 October 2021] [ Links ]
IEA. 2021. Electricity market report, July 2021. p. 3. https://www.iea.org/reports/electricity-market-report-july-2021 [accessed 25 October 2021]. [ Links ]
IEA. 2021. Methane Tracker database analysis. https://www.iea.org/articles/methane-tracker-database and https://www.iea.org/reports/methane-tracker-2021/methane-and-climate-change#abstract [accessed 25 October 2021]. [ Links ]
IEA. 2021. Net zero by 2050 - Analysis. https://www.iea.org/reports/net-zero-by-2050. [accessed 25 January 2021]. [ Links ]
IEA. 2021. World Energy Outlook 2021. https://iea.blob.core.windows.net/assets/888004cf-1a38-4716-9e0c-3b0e3fdbf609/WorldEnergyOutlook2021.pdf[accessed 25 October 2021]. [ Links ]
IEEFA (Institute for Energy Economics & Financial Analysis). 2020. Brief: The Australian LNG industry's growth - and the decline in greenhouse gas emissions standards. http://ieefa.org/ieefa-brief-the-australian-lng-industrys-growth-and-the-decline-in-greenhouse-gas-emissions-standards/ [accessed 25 October 2021]. [ Links ]
IEEJ (Institute of Energy Economics, Japan). 2020. IEEJ Outlook 2021. https://eneken.ieej.or.jp/data/9417.pdf [accessed 25 October 2021]. [ Links ]
IEEJ (Institute of Energy Economics, Japan). 2019. IEEJ Outlook 2020. https://eneken.ieej.or.jp/data/8644.pdf [accessed 25 October 2021]. [ Links ]
Independent. 2021. EU likely to put gas, nuclear in green lists, commissioner says. https://www.independent.ie/business/world/eu-likely-to-put-gas-nuclear-in-green-lists-commissioner-says-41164730.html [accessed 25 October 2021]. [ Links ]
IPCC. 2014a. Climate Change 2014: Synthesis Report. Contribution of Working Groups I, II and III to the Fifth Assessment Report of the Intergovernmental Panel on Climate Change. Pachauri R.K. and Meyer, L.A. (eds.).. IPCC, Geneva, Switzerland. p. 124. https://www.ipcc.ch/site/assets/uploads/2018/02/SYR_AR5_FINAL_full.pdf [accessed 25 October 2021]. [ Links ]
IPCC. 2014b., Fifth Assessment Report (AR5) Final. Table I, Box 3-2, pp. 87- 88. [ Links ]
IPCC. 2014c. Climate Change 2014: Synthesis Report. Contribution of Working Groups I, II and III to the Fifth Assessment Report of the Intergovernmental Panel on Climate Change. Pachauri, R.K. and Meyer, L.A. (eds.). p. 124. IPCC, Geneva., Switzerland. https://www.ipcc.ch/site/assets/uploads/2018/02/SYR_AR5_FINAL_full.pdf [accessed 25 October 2021]. [ Links ]
IPCC. 2021: Climate Change 2021: The Physical Science Basis. Contribution of Working Group I to the Sixth Assessment Report of the Intergovernmental Panel on Climate Change. Masson-Delmotte, V., P. Zhai, P., A. Pirani, A.,. S.L.Connors, S.L.,.C. Pean, C., S. Berger, S., N. Caud, N., Y. Chen, Y., L. Goldfarb, L., M.I. Gomis, M.I., M. Huang, M., K. Leitzell, K., E. Lonnoy, E., J.B.R. Matthews, J.B.R., T.K. Maycock, T.K., T. Waterfield, T., O. Yelekçi, O., R. Yu, R., and Zhou, B. (eds.). Cambridge University Press [in press]. Page p. 89. https://www.ipcc.ch/report/ar6/wg1/downloads/report/IPCC_AR6_WGI_Full_Report.pdf [accessed 25 October 2021]. [ Links ]
Kahn, M.E., Mohadden, K., Ng., R.N.C., Pesaran, M.G., Raissi, M., and Yang, J-C. 2019. Long-term macroeconomic effects of climate change: A cross-country analysis economics. Working Paper Series no. 26167. National Bureau of Economic Research. doi:10.3386/w26167. https://www.nber.org/system/files/working_papers/w26167/w26167.pdf [accessed 25 October 2021]. [ Links ]
Kholod, N., Evans, M., Pilcher, R.C., Roshchanka, V., Ruiz, F., Cote, M., and Collings, R. 2020. Global methane emissions from coal mining to continue growing even with declining coal production. Journal of Cleaner Production, vol. 256, May 2020. 120489. doi: 10.1016/j.jclepro.2020.120489. https://www.sciencedirect.com/science/article/pii/S0959652620305369?via%3Dihub [accessed 25 October 2021]. [ Links ]
Kleinberg, R.L. 2020. The global warming potential misrepresents the physics of global warming thereby misleading policy makers. Center on Global Energy Policy, Columbia University and Institute for Sustainable Energy, Boston University. https://doi.org/10.31223/X5P88D. https://eartharxiv.org/repository/view/1686/ [accessed 25 October 2021]. [ Links ]
Kleinberg, R.L. 2020. The global warming potential misrepresents the physics of global warming thereby misleading policy makers. Center on Global Energy Policy, Columbia University Institute for Sustainable Energy, Boston University. https://doi.org/10.31223/X5P88D. https://eartharxiv.org/repository/view/1686/ [accessed 25 October 2021] [ Links ]
Knorr, W. 2009. Is the airborne fraction of anthropogenic CO2 emissions increasing? Geophysical Research Letters, vol. 36, no. 21, Nov 2009. doi: 10.1029/2009GL040613. https://agupubs.onlinelibrary.wiley.com/doi/full/10.1029/2009GL040613 [accessed 25 October 2021]. [ Links ]
Ladage, S., Blumenberg, M., Franke, D., Bahr, A., Lutz, R., and Schmidt, S. On the climate benefit of a coal-to-gas shift in Germany's electric power sector. Scientific Reports, vol. 11, June 2020, 11453. doi: 10.1038^41598-021-90839-7. https://www.nature.com/articles/s41598-021-90839-7#citeas [accessed 25 October 2021]. [ Links ]
Lloyd, P.J.D. and Cook, A.P. 2005. Methane release from South African coalmines. Journal of the South African Institute of Mining and Metallurgy, vol. 105, no. 7. https://www.saimm.co.za/Journal/v105n07p483.pdf [accessed 25 October 2021]. [ Links ]
Lomborg, B. 2020. Welfare in the 21st century: Increasing development, reducing inequality, the impact of climate change, and the cost of climate policies. [Figure 4]. Technological Forecasting and Social Change, vol. 156, July 2020, 119981. doi: 10.1016/j.techfore.2020.119981. https://www.sciencedirect.com/science/article/pii/S0040162520304157 [accessed 25 October 2021]. [ Links ]
Lomborg, B. 2020. Welfare in the 21st century: Increasing development, reducing inequality, the impact of climate change, and the cost of climate policies. [Figure 4]. Technological Forecasting and Social Change, vol. 156, July 2020, 119981. doi: 10.1016/j.techfore.2020.119981. https://www.sciencedirect.com/science/article/pii/S0040162520304157 [accessed 25 October 2021]. [ Links ]
Lynch, J., Cain, M., Pierrehumbert, R., and Allen, M. 2020. Demonstrating GWP: a means of reporting warming-equivalent emissions that captures the contrasting impacts of short- and long-lived climate pollutants. Environmental Research Letters, vol. 15, no. 4. 044023. https://iopscience.iop.org/article/10.1088/1748-9326/ab6d7e [accessed 25 October 2021]. [ Links ]
McKinsey Energy Insights. 2019. Global Energy Perspective 2019: Reference case. https://www.mckinsey.com/~/media/mckinsey/industries/oil%20and%20gas/our%20insights/global%20energy%20perspective%202019/mckinsey-energy-insights-global-energy-perspective-2019_reference-case-summary.ashx [accessed 25 October 2021]. [ Links ]
McKinsey Energy Insights. 2021. Global Energy Perspective 2021. https://www.mckinsey.com/~/media/McKinsey/Industries/Oil%20and%20Gas/Our%20Insights/Global%20Energy%20Perspective%202021/Global-Energy-Perspective-2021-final.pdf [accessed 25 October 2021]. [ Links ]
Milne, P. 2019. Future emissions shock for WA's major LNG players. The West Australian, March 2019. https://thewest.com.au/business/energy/future-emissions-shock-for-was-major-lng-players-ng-b881143493z [accessed 25 October 2021]. [ Links ]
Morton, A. 2021. A shocking failure: Chevron criticised for missing carbon capture target at WA gas project. The Guardian, July 2019. https://www.theguardian.com/environment/2021/jul/20/a-shocking-failure-chevron-criticised-for-missing-carbon-capture-target-at-wa-gas-project [accessed 25 October 2021]. [ Links ]
NASA Earth Observatory. 2019. China and India lead the way in greening. https://earthobservatory.nasa.gov/images/144540/china-and-india-lead-the-way-in-greening [accessed 25 October 2021]. [ Links ]
Nordhaus, W. 2018. Projections and uncertainties about climate change in an era of minimal climate policies. American Economic Journal: Economic Policy, vol. 10, no. 3, August 2018. pp. 333-360. doi: 10.1257/pol.20170046. https://www.aeaweb.org/articles?id=10.1257/pol.20170046 [accessed 25 October 2021]. [ Links ]
Ocko, IB., Sun, T., Shindell, D., Oppenheimer,, M., Hristov, A.N., Pacala, S.W., Mauzerall, D.L., Xu, Y., and Hamburg, S.P. 2021. Acting rapidly to deploy readily available methane mitigation measures by sector can immediately slow global warming. Environmental Research. Letters, vol. 16. 054042. https://iopscience.iop.org/article/10.1088/1748-9326/abf9c8 [accessed 25 October 2021]. [ Links ]
Olivier, J.G.J. and Peters, J.A.H.W. 2020. Trends in global CO2 and total greenhouse gas emissions: 2020 Report. PBL Netherlands Environmental Assessment Agency, December 2020. https://www.pbl.nl/en/trends-in-global-co2-emissions [accessed 25 October 2021]. [ Links ]
Pielke, R. and Ritchie J. 2021. How climate scenarios lost touch with reality. Issues in Science and Technology, vol. XXXVII, no. 4. https://issues.org/climate-change-scenarios-lost-touch-reality-pielke-ritchie/ [accessed 25 October 2021]. [ Links ]
Power Technology Energy News and Market Analysis. 2021. Hassyan Clean Coal Project, Dubai. https://www.power-technology.com/projects/hassyan-clean-coal-project-dubai/ [accessed 25 October 2021]. [ Links ]
Qvist, S., Gladysz, P., Bartela, L., and Sowizdzal, A. 2021. Retrofit decarbonization of coal power plants-A case study for Poland. Energies, vol. 14, no. 1. 1p. 20. doi: 10.3390^14010120. https://www.mdpi.com/1996-1073/14/1/120 [accessed 25 October 2021]. [ Links ]
Randall, C. 2020. Gigafactory 4 undergoing official approval process. Electrive. com. January 2020. https://www.electrive.com/2020/01/06/gigafactory-4-undergoing-official-approval-process/ [accessed 25 October 2021]. [ Links ]
Ritchie, H. and Roser, M. 2020a. CO2 emissions by fuel. OurWorldInData.org. https://ourworldindata.org/emissions-by-fuel [accessed 25 October 2021]. [ Links ]
Ritchie, H. and Roser, M. 2020b. CO2 emissions. OurWorldInData.org. https://ourworldindata.org/co2-emissions?country=https://ourworldindata.org/co2-emissions?country= [accessed 25 October 2021]. [ Links ]
Roser, M., Ritchie, H., and Ortiz-Ospina, E. 2013. World population growth. OurWorldInData.org. [First published in 2013, most recent substantial revision in May 2019]. https://ourworldindata.org/world-population-growth [accessed 25 October 2021]. [ Links ]
Saunois, M. et al. 2020. The global methane budget 2000-2017. Earth System Science Data, vol. 12, no. 3. pp. 1561-1623. https://doi.org/10.5194/essd-12-1561-2020. https://essd.copernicus.org/articles/12/1561/2020/ [accessed 25 October 2021]. [ Links ]
Schernikau, L. and Smith, W. 2020. How many km2 of solar panels in Spain and how much battery backup would it take to power Germany. SSRN Electronic Journal. doi: 10.2139/ssrn.3730155. https://papers.ssrn.com/sol3/papers.cfm?abstract_id=3730155. [accessed 25 October 2021] [ Links ]
Schernikau, L., Smith, W., and Falcon. R. 2022. A primer on global electricity systems - full cost of electricity & recommendations for a sustainable energy policy. January 2022. Unpublished draft paper. https://papers.ssrn.com/abstract=4000800 [accessed 25 October 2021]. [ Links ]
Stanford Energy. 2018. Cheap renewables won't stop global warming, says Bill Gates. https://energy.stanford.edu/news/cheap-renewables-won-t-stop-global-warming-says-bill-gates [accessed 25 October 2021]. [ Links ]
Tans, P. 2021. Trends in atmospheric carbon dioxide. NOAA/GML. https://gml.noaa.gov/ccgg/trends/data.html [accessed 25 October 2021]. [ Links ]
The Strategist.Media. 2020. German government: Liquefied gas is as environmentally unfriendly as coal and oil. https://www.thestrategist.media/German-government-Liquefied-gas-is-as-environmentally-unfriendly-as-coal-and-oil_a4793.html [accessed 25 October 2021]. [ Links ]
Tramosljika, B., Blecich, P., Bonefacic, I., and Glazar, V. 2021. Advanced Ultra-Supercritical Coal Fired Power Plant with Post-Combustion Carbon Capture: Analysis of electricity penalty and CO2 emission reduction. Sustainability, vol 13. p. 801. doi: 10.3390/su13020801. https://www.mdpi.com/2071-1050/13/2/801 [accessed 25 October 2021]. [ Links ]
Tramosljika, B., Blecich, P., Bonefacic, I., and Glazar, V. 2021. Advanced ultra-supercritical coal fired power plant with post-combustion carbon capture: Analysis of electricity penalty and CO2 emission reduction. Sustainability, vol 13. p. 801. s: 10.3390/su13020801. https://www.mdpi.com/2071-1050/13/2/801 [accessed 25 October 2021]. [ Links ]
UNFCC. 2021. NDC Synthesis Report: Nationally determined contributions under the Paris Agreement. Synthesis report by the Secretariat. https://unfccc.int/documents/306848 [accessed 25 October 2021]. [ Links ]
Wallstreet-Online. 2020. Flüssigerdgas ähnlich klimaschädlich wie Kohle. https://www.wallstreet-online.de/nachricht/13019432-umweltministerium-fluessigerdgas-klimaschaedlich-kohle [accessed 25 October 2021]. [ Links ]
Washington Post. 2020. Methane is a hard-hitting greenhouse gas. Now scientists say we've dramatically underestimated how much we're emitting. https://www.washingtonpost.com/climate-environment/2020/02/19/were-vastly-undercounting-methane-emissions-fossil-fuels-scientists-say/ [accessed 25 October 2021]. [ Links ]
Wettengel, J. 2020. German regional govt aims to shield Nord Stream 2 against U.S. sanctions. Clean Energy Wire. https://www.cleanenergywire.org/news/german-state-set-foundation-secure-work-nord-stream-2 [accessed 25 October 2021]. [ Links ]
Wijngaarden, W.A. and Happer, W. 2020. Dependence of Earth's thermal radiation on five most abundant greenhouse gases. arXiv:2006.03098. https://arxiv.org/abs/2006.03098 [accessed 25 October 2021]. [ Links ]
World Meteorological Organization. 2021. https://public.wmo.int/en/our-mandate/focusareas/environment/greenhouse%20gases. [accessed 25 October 2021]. [ Links ]
Zheng, C., Jiang, B., Xue, S., Chen, Z. and Li, H. 2019. Coalbed methane emissions and drainage methods in underground mining for mining safety and environmental benefits: A review. Process Safety and Environmental Protection, vol. 127, July 2019. pp. 103-124. https://doi.org/10.1016/j.psep.2019.05.010 [accessed 25 October 2021]. [ Links ]
Zhu, Z., Piao, S., Myneni, R., Huang, M., Zeng, Z., Canadell, J., Ciais, P., Sitch, S., Friedlingstein, P., Arneth, A., Cao, C., Cheng, L., Kato, E., Koven, C., Li, Y., Lian, X., Liu, Y., Liu, R., Mao, J., Pan, Y., Peng, S., Penuelas, J., Poulter, B., Pugh, T., Stocker, B., Viovy, N., Wang, X., Wang, Y., Xiao, Z., Yang, H., Zaehle, S., and Zeng, N. 2016. Greening of the Earth and its drivers. Nature Climate Change, vol. 6. pp. 791-795. doi: 10.1038/nclimate3004. https://www.nature.com/articles/nclimate3004 [accessed 25 October 2021]. [ Links ]
 Correspondence:
L. Schernikau
Email: lars@lali.com
Received: 26 Oct. 2021
Revised: 31 Jan. 2022
Accepted: 2 Feb. 2022
Published: March 2022
1 This coal/gas break-even number increases from approximately 2% to 5,5% loss of methane using IPCC's 100-year Global Warming Potential (GWP) instead of the 20-year GWP. Detailed calculations can be found in footnote
2 40% of 170 000 is not 27 000; the difference comes from energy lost during electricity production. Only a fraction of energy put into a system is usable after conversion, the remainder is lost as heat. Authors' Research and Analysis based on the following sources: IEA. 2019. Installed power generation capacity in the Stated Policies Scenario, 2000-2040. https://www.iea.org/data-and-statistics/charts/installed-power-generation-capacity-in-the-stated-policies-scenario-2000-2040 [accessed 25 October 2021]. IEA. 2021b. Key World Energy Statistics 2021. https://iea.blob.core.windows.net/assets/52f66a88-0b63-4ad2-94a5-29d36e864b82/KeyWorldEnergyStatistics2021.pdf [accessed 25 October 2021]. BP. 2021. Statistical Review of World Energy. 70th edition.https://www.bp.com/content/dam/bp/business-sites/en/global/corporate/pdfs/energy-economics/statistical-review/bp-stats-review-2021-full-report.pdf [accessed 25 October 2021]. BP. 2020. Statistical Review of World Energy. 69th edition.https://www.bp.com/content/dam/bp/business-sites/en/global/corporate/pdfs/energy-economics/statistical-review/bp-stats-review-2020-full-report.pdf [accessed 25 October 2021]REN21. 2021. Renewables 2021 Global Status Report (GSR). https://www.ren21.net/reports/global-status-report/ [accessed 25 October 2021]. Smil, V. 2017: Energy Transitions: Global and National Perspectives. Praeger, Santa Barbara, CA.
3 The authors stipulate the IPCC GWP numbers for the purpose of our energy illustrations based on data used by governments and institutions. The authors' detailed objection to GWP, as well as the scientific debate and uncertainty on GWP, cannot be detailed here due to space constraints (refer also to Cain, 2018; Derwent, 2020; ClimateAnalytics, 2017; Kleinberg, 2020; Lynch et al., 2020). For instance, Wijngaarden and Happer (2020) have analysed GHG forcing in detail and conclude significantly lower climate sensitivities than those used by the IPCC.
4 The numbers vary and are assumed as follows: 375 g CO2/kWh at partial load combined cycle PNG (48% efficiency), 825 g CO2/kWh partial load coal (41% efficiency); A450 g CO2/kWh becomes 207 g after 54% natural CO2 uptake; 26,400 kJ/ kg CH4 and 1,47 m/kg CH4 translate to 200,5 m/MWh; 1% methane loss translates to 2 m/MWh or 1,4g CH4 per kWh or 115 g CO2/kWh @GWP20; therefore at 1,8% methane leakage coal and gas are on par; @GWP100, coal and gas are on par at 5,4% methane leakage.
Appendix
International studies and press releases on methane
A number of international studies and press releases, mostly funded by environmental organizations and even the gas industry itself, confirm that for 'the climate', LNG and shale gas are at best on a par with coal or will emit higher relevant GHG emissions. In the past few years there has been a shift to more focus on methane, as illustrated by IEAs Methane Tracker and various reports (Ritchie and Roser, 2020a, 2020b; IEA, 2021; Saunois et al. 2020; October 2021).
The studies do not typically consider the points made above, namely (1) the higher GWP20 for methane compared with coal or (2) the natural CO2 uptake of about 50%. The authors do not disagree with these studies on the comparisons made for gas versus coal, but their calculation shows the situation to be less favourable for natural gas than suggested, due to the fugitive methane from other identified sources. This conclusion is equally valid for GWP100 and even for fugitive methane arising from methane produced for combustion alone.
The following references provide support for the authors' views, namely, that natural gas in various forms is likely to generate higher emissions than coal.
> Bloomberg (2021), Sarah Smith, programme director for super pollutants at Clean Air Task Force, 'World leaders are starting to recognize that curbing methane is the only clear strategy to cut warming over the next two decades'.
> CNN (2021), after the release of the IPPC AR6 Report: for the first time, the UN climate change report emphasized the need to control a more insidious culprit: methane, an invisible, odor-less gas with more than 80 times more warming power in the near-term than carbon dioxide'.
> Clean Energy Wire (2021): 'The advantage of natural gas in terms of climate change is disputed. It not only emits CO2 when burned, but is mainly composed of methane, making it a powerful greenhouse gas itself'.
> IEA World Energy Outlook (2021), p. 41: 'Methane has contributed around 30% of the global rise in temperature today'.
> German Ministry for the Environment, (2020): 'LNG from shale gas does not contribute to climate goals'.
> Washington Post (2020), Chris Mooney, 'Methane is a hardhitting greenhouse gas. Now scientists say we've dramatically underestimated how much we're emitting'.
> Dan Gocher, Director: Australasian Centre for Corporate Responsibility (ACCR, 2020): 'BHP...is still betting heavily on gas - which is proven to have the same, if not worse emissions than coal once fugitive methane emissions are factored in'.
> Environmental Council, Australia (2019): a major international review of LNG infrastructure released in July 2019 found the threat to the climate from LNG is as large or larger than coal'.
> EnergyWatchGroup, Germany (2019 (see Figure 5): ' ... the switch from coal and oil to natural gas in power plants and heating systems even increases the greenhouse effect of energy consumption by around 40%'.
> Bill Gates, Stanford (Stanford Energy, 2018): ' . forcing function is sooner on natural gas, converting coal to natural gas for the next 50 years and then shutting it down, that's a net addition [to emissions].
> Total Gas study (CIRAIG, 2016): 'With 95% confidence interval, US shale gas may emit more greenhouse gases than Colombian hard coal systems'.
Additional resources in English and German are referenced below.
Howarth (2019) points out that 'While methane emissions are often referred to as "leaks", some of the emissions include purposeful venting, including the release of gas during theflowback period immediately following hydraulic fracturing, the rapid release of gas from blowdowns during emergencies but also for routine maintenance on pipelines and compressor stations, and the steadier but more subtle release of gas from storage tanks and compressor stations to safely maintain pressures'.
Scientific studies and reports (last accessed 25 October 2021)
Alvarez, R.A. et al. 2018. Assessment of methane emissions from the U.S. oil and gas supply chain. https://www.science.org/doi/10.1126/science.aar7204
CCWA. 2019. About LNG in Australia: "Gas is not 'cleaner' than coal". p. 43. https://apo.org.au/sites/default/files/resource-files/2019-11/apo-nid266691.pdf
Cornwall, W. 2018. Natural gas could warm the planet as much as coal [...], Science. https://www.science.org/news/2018/06/natural-gas-could-warm-planet-much-coal-short-term
Etminan, M., Myhre, G., Highwood, E.J., and Shine, K.P. 2016. Radiative forcing of carbon dioxide, methane, and nitrous oxide: A significant revision of the methane radiative forcing. https://doi.org/10.1002/2016GL071930
Energy Watch Group. 2019. Natural gas makes no contribution to climate protection. http://www.energywatchgroup.org/wpcontent/uploads/EWG_Natural_Gas_Study_September_2019.pdf
Global Energy Monitor. 2019/2020. The new gas boom by coal swarm. http://www.europeangashub.com/wp-content/uploads/2019/08/
NewGasBoomEmbargo.pdf [accessed 25 October 2021]; Tracking LNG infrastructure. https://globalenergymonitor.org/wp-content/uploads/2020/07/GasBubble_2020_r3.pdf
Hmiel, B., Petrenko, V.V., Dyonisius, M.N., Buizert, C., Smith, A.M., Place, P.F., Harth, C., Beaudette, R., Hua, Q., Yang, B., Vimont, I., Michel, S.E., Severinghaus, J.P., Etheridge, D., Bromley, T., Schmitt, J., Fa'in, X., Weiss, R.F., and Dlugokencky, E. 2020. Preindustrial CH4 indicates greater anthropogenic fossil CH4 emissions. Nature. https://www.nature.com/articles/s41586-020-1991-8
Howarth, R.W. 2014. LCA - oil and gas with higher greenhouse gas emissions than coal. https://onlinelibrary.wiley.com/doi/10.1002/ese3.35
Howarth, R.W. 2019. Ideas and perspectives: Is shale gas a major driver of recent increase in global atmospheric methane? https://bg.copernicus.org/articles/16/3033/2019/
IEA. 2020. Comprehensive IEA study on methane gas flaring. https://www.iea.org/commentaries/putting-gas-flaring-in-the-spotlight
IEEFA 2020, Report on the growth of Australia's LNG industry and the decline in greenhouse gas emission standards. https://ieefa.org/ieefa-brief-the-australian-lng-industrys-growth-and-the-decline-in-greenhouse-gas-emissions-standards/
Ladage, S., Blumenberg, M., Franke, D., Bahr, A., Lutz, R., and Schmidt, S. 2021. On the climate benefit of a coal-to-gas shift. https://www.nature.com/articles/s41598-021-90839-7
Lechtenböhmer, S. and Dienst, C. 2009. Future development of the upstream greenhouse gas emissions from natural gas industry, focusing on Russian gas fields and export pipelines. https://doi.org/10.1080/19438151003774463
McKinsey. 2021. Curbing methane emissions: How five industries can counter a major climate threat. https://www.mckinsey.com/business-functions/sustainability/our-insights/curbing-methane-emissions-how-five-industries-can-counter-a-major-climate-threat?cid=other-eml-dre-mip-mck&hlkid=a774e1a8976d4a078406df70a8406fd5&hctky =11701123&hdpid=6bc90219-24ea-4ea9-bad2-299f795342c3
Poyry Study. 2016 Gas ist klimaschädlicher als Kohle. https://www.energate-messenger.ch/news/165477/studie-gas-ist-klimaschaedlicher-als-kohle?
Schiermeier. 2020. Methane levels soar to record high. Nature. https://www.nature.com/articles/d41586-020-02116-8
CIRAIG. 2016: p. 5. https://www.ciraig.org/pdf/CIRAIG_LCA_gas_vs_coal_final_report_version.pdf
Selected additional press releases in English (last accessed 25 October 2021)
Bloomberg. 2020. Gas exports have dirty secret [...]. https://www.bloomberg.com/news/articles/2020-01-23/gas-exports-have-dirty-secret-a-carbon-footprint-rivaling-coal-s?
Bloomberg. 2021. Methane plumes spotted near Central Asia pipes to China, Russia on methane plumes in turkmenistan. https://www.bloomberg.com/news/articles/2021-09-16/methane-plumes-spotted-near-turkmenistan-pipes-to-china-russia
Bloomberg. 2021. The cheap and easy climate fix that can cool the planet fast. https://www.bloomberg.com/graphics/2021-methane-impact-on-climate/
CNN. 2021. Scientists say this invisible gas could seal our fate on climate change. https://edition.cnn.com/2021/08/11/us/methane-climate-change/index.html
Economist. 2021. Those who worry about CO2 should worry about CH4, too. https://www.economist.com/leaders/2021/04/03/governments-should-set-targets-to-reduce-methane-emissions and https://www.economist.com/leaders/2021/03/31/governments-should-set-targets-to-reduce-methane-emissions
Financial Times. 2020. BHP targets 30% cut in carbon emissions by 2030. https://www.ft.com/content/9cffdac1-aba9-407d-a236-7560ab2e0554?
Gas Strategies Group. 2021. Gas matters today news on methane pledge from EU and the US. www.gasstrategies.com/information-services/gas-matters-today/gas-matters-today-news-roundup-wc-13-september-2021
Guardian. 2019. Fracking causing rise in methane emissions, study finds. https://www.theguardian.com/environment/2019/aug/14/fracking-causing-rise-in-methane-emissions-study-finds?
New York Times. 2019. It's a vast, invisible climate menace. We made it visible. https://www.nytimes.com/interactive/2019/12/12/climate/texas-methane-super-emitters.html? searchResultPosition=1
Stanford Energy. 2018. Cheap renewables won't stop global warming, says Bill Gates. https://energy.stanford.edu/news/cheap-renewables-won-t-stop-global-warming-says-bill-gates
Washington Post. 2020. Methane is a hard-hitting greenhouse gas. Now scientists say we've dramatically underestimated how much we're emitting. https://www.washingtonpost.com/climate-environment/2020/02/19/were-vastly-undercounting-methane-emissions-fossil-fuels-scientists-say/
West Australian. 2019. Future emissions shock for WA's major LNG players. https://thewest.com.au/business/energy/future-emissions-shock-for-was-major-lng-players-ng-b881143493z?
Selected press/sources in German (last accessed 25 October 2021)
Deutsche Umwelthilfe. 2021. Rechtsgutachten über LNG. https://www.duh.de/presse/pressemitteilungen/pressemitteilung/rechtsgutachten-der-deutschen-umwelthilfe-belegt-klimaschaedliches-lng-terminal-bei-stade-ist-nicht/
Deutsche Welle. 2019. Methan: Der böse Zwillingsbruder von CO2. http://www.dw.com/de/methan-der-böse-zwillingsbruder-von-CO2/a-49208882?
DIW. 2021. Interview mit Prof. Claudia Kemfert in der TAZ. https://www.diw.de/de/diw_01.c.810797.de/nachrichten/pipeline_setzt_geld_in_den_sand.html?
Energate|messenger. 2016. Gas ist klimaschädlicher als Kohle. https://www.energate-messenger.ch/news/165477/studie-gas-ist-klimaschaedlicher-als-kohle?
Spiegel. 2020. Methanlecks aus Gasnetzen: Kleine Löcher, großer Klimaschaden. https://www.spiegel.de/wissenschaft/mensch/klimawandel-durch-methanlecks-kleine-loecher-grosser-schaden-a-e381a23d-ddf6-4c40-b420-bf91d334f610?
Wallstreet-Online. 2020. Flüssigerdgas ähnlich klimaschädlich wie Kohle. https://www.wallstreet-online.de/nachricht/13019432-umweltministerium-fluessigerdgas-klimaschaedlich-kohle

