


Services on Demand
Article
 English (pdf)
 Article in xml format
 Article references
Indicators

Related links
-
 Cited by Google
 -
 Similars in Google
Share

 Permalink
Journal of the Southern African Institute of Mining and Metallurgy
On-line version ISSN 2411-9717
Print version ISSN 2225-6253
J. S. Afr. Inst. Min. Metall. vol.122 n.3 Johannesburg Mar. 2022
http://dx.doi.org/10.17159/2411-9717/1511/2022
PROFESSIONAL TECHNICAL AND SCIENTIFIC PAPERS
A case study of geotechnical conditions affecting mining-induced seismicity in a deep tabular mine
L. Scheepers; D.F. Malan
Department of Mining Engineering, University of Pretoria, South Africa
SYNOPSIS
Seismic risk in the deep gold mines of South Africa has been studied for many decades. A clear understanding of the effect of geotechnical conditions on the seismic hazard nevertheless remains elusive. Certain reef types seem to be associated with a higher risk of rockbursts. The stability and deformation behaviour of excavations on the different reef horizons are affected by the rock types and the varying strength properties. The seismic response to mining is therefore also expected to differ according to the geotechnical conditions. As a case study of this behaviour, the seismicity at Mponeng mine was investigated. On the VCR (Ventersdorp Contact Reef) horizon, two areas can be delineated. On the eastern side of the mine, the footwall is shale, and on the western side it is a strong brittle quartzite. More large-magnitude events occur in the area with the shale footwall than the area with the quartzite footwall. Moment tensor analyses indicated that the majority of the large-magnitude events are not related to geological structures, but are face-related, implying that shear failure of intact rock is occurring ahead of the mining front. Preliminary modelling indicated that the closure volume for the shale footwall may be higher than that for the quartzite footwall, providing a possible explanation for the observed difference in seismic response.
Keywords: seismic risk, deep mining, shear failure, rock type.
Introduction
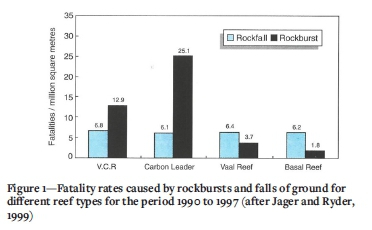
Damaging rockbursts, associated with the high incidence of mining-induced seismic events, are a major hazard in the deep-level gold mines of the Witwatersrand Basin in South Africa. Research on rockbursts has been conducted since the early days of mining (e.g. see Durrheim, 2010). Surprisingly, little work has being done to compare the rockburst hazard and the nature of the seismicity for the different reef types. This is a difficult problem to study as typically the depths, layouts, and support standards also vary in the different mining areas. Denkhaus et al. (1958) described the differences in rock properties and speculated that the variation in rockbursts along a line on strike running through Blyvooruitzicht and West Driefontein may be related to a variation in rock properties along this line. They considered a laboratory-determined parameter termed 'relative violence of fracture' in this regard. Other well-known historical rockburst studies, such as Cook et al. (1966), focused mainly on aspects such as stope span, abutment size, excavation size, depth below surface, geological structure, and stoping width. No mention is made of the role of different reef types and rock types in the hangingwall and footwall. Jager and Ryder (1999) analysed accident data for the Department of Mineral Resources' (DMR's) SAMRASS database and produced the graph shown in Figure 1. The risk of rockburst fatalities in mining on the Carbon Leader Reef seemed significantly higher than for the other reefs for the period from 1990 to 1997. Note that the risk in terms of fall-of-ground fatalities seems comparable for the different reef types. The data should be treated with caution as the role of other factors, such as different depths and mining layouts, could not easily be quantified. However, these results pose the question as to whether different reef types present a higher risk in terms of damaging rockbursts. Jager and Ryder (1999) also emphasised that layouts and support strategies play an important role, and illustrated this by means of data for neighbouring mines with similar geotechnical conditions but significantly different rockburst fatality rates.
Anecdotal evidence is available from the industry regarding the seismic risk of different reef types. For example, experienced production personnel in the Westonaria region believe that the seismic hazard for the Middelvlei Reef is substantially less than for the Ventersdorp Contact Reef (VCR). This has never been scientifically quantified, and the reason for the difference is not clear. Esterhuyse and Malan (2018) stated that the remnants and abutments for some reef types are easily under- or overstoped. The classical example is that of VCR remnants, which are easily understoped by mining on the Kloof or Libanon reefs in areas where the middling is small (< 20 m). In contrast, when highly stressed Carbon Leader Reef abutments are overstoped by mining on the Middelvlei Reef, where the middling is approximately 50 m, seismic events of magnitude M3.0 are a common occurrence.
Mponeng mine provides a rare opportunity to study the effect of different geotechnical conditions on seismic behaviour. At the mine, two geotechnical areas can be delineated for the VCR based on the footwall lithology. The immediate footwall on the eastern side of the mine consists of shale, and at the western side of the mine it is a brittle quartzite. The depth, layout, mining method, and support methodology are comparable for the two areas and a meaningful comparison of the seismic response is therefore possible.
Mining method and geotechnical conditions at Mponeng
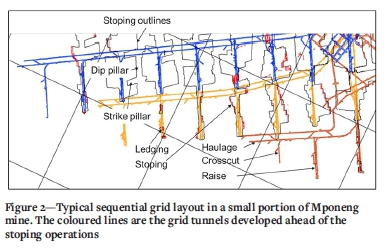
The mining method at Mponeng is a modified 'sequential grid mining' (Appelgate, 1991; McGill et al., 2007). It consists of a development grid from where the reef is accessed (Figure 2). Raiselines are spaced 220 m apart. This allows for partial extraction, leaving 30 m wide regional dip stability pillars between the mining blocks. The stope spans are 180 m on strike and several hundred metres on dip. More recently, 30 m wide strike pillars were left in addition to the dip pillars. The motivation was to further reduce the extraction ratio and to reduce the closure volume and associated seismic response.
Owing to the mining depth (currently in excess of 3600 m), the stress levels are high and mining-related seismicity and possible rockburst damage is the biggest risk at the mine. Meticulous mine design is required to manage the seismic hazard and ensure safe mining. Over the years a number of seismic hazard management strategies have been included in the mine design strategy. Most of these strategies aim at reducing excess shear stress on the seismically active geological structures and minimizing volumetric closure in the stopes. The current seismic hazard management strategies are as follows (see Figure 3):
> Partial extraction with a low extraction ratio of less than 60%
> Limiting the mining spans to a maximum of 180 m on strike
> Large regional stability pillars, 30 m wide on dip and strike
> Bracket pillars on major geological structures, typically 20 m wide both sides of the structure
> Overhand face configuration with controlled lead/lags of 7 m to 10 m
> A 35° approach angle onto minor structures if mined through
> Face preconditioning
> Mine-wide backfill using classified tailings in approximately 70% of the stoping area. Areas where travelling or transport are done (gullies) are not filled, so 100% backfill is not possible
> Rockburst-resistant support.
These strategies are based on a combination of guidelines stated in historical codes of practice, guidelines in rock engineering textbooks and research documents, interactions with experienced rock engineers, and personal experience. Most of these guidelines have also been verified with modelling and seismic response observations.
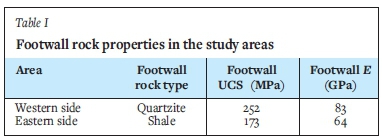
The near-reef lithology associated with the current mining on the VCR is a thick strong Alberton lava hangingwall, conglomerate VCR reef, and shale or quartzite footwall. On the western side of the mine, the footwall is quartzite of the Elsburg Series. On the eastern side of the mine the footwall is a thick shale of the Booysens Series. This shale at Mponeng must not be confused with the weak and soft shale associated with some of the reefs in the Welkom area. The shale at Mponeng is a siltstone that is metamorphosed to a relatively high strength and is brittle. The strength (UCS) of the shale ranges between 155 MPa and 195 MPa with an average of 173 MPa. The average Young's modulus (E) of this rock is 64 GPa. This strength is nevertheless significantly lower than the strength of the quartzite, which ranges from 160 MPa to 332 MPa with an average of 252 MPa. The average Young's modulus is 83 MPa. This difference in footwall rock strength is an important consideration in this study as the seismic response to mining on the shale footwall is compared to that on the quartzite footwall.
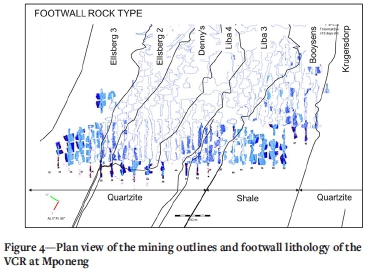
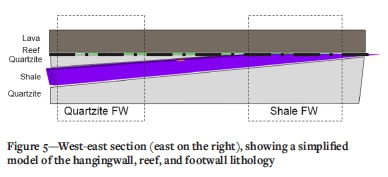
In Figure 4, a plan view of the footwall lithology transition is overlain with the mining outlines. The Booysens zone refers to the Booysens Shale that forms the direct footwall of the VCR in that area. All the other zones refer to quartzite as the direct footwall of the VCR. In Figure 5, a simplified sectional view of a model of the footwall lithology associated with the VCR is shown. From these diagrams, it is clear that only in the far eastern side of the mine is the shale the immediate footwall. On the far west, the immediate footwall is quartzite. The thickness of the quartzite in the footwall gradually increases from east to west. A zone can be identified where the quartzite in the footwall is relatively thin, followed by the shale layer. This is the transition zone, where the seismic response to mining may be influenced by both the shale and the quartzite footwall. In this study, the seismic response in the area with thick shale footwall is compared with that in the area with thick quartzite footwall. The data from the transition zone is not used or discussed further in this paper.
Seismic data analysis
For the period 2016-2018 (see Figures 6 to 8), the mining activity and yearly production were comparable between the shale area and the quartzite area. Although the mining production below 120 Level, on the quartzite footwall, increased year-on-year, this was excluded from the seismic comparison. The focus of this study is therefore on the three-year period from 2016 to 2018 for data above 120 Level. This was deemed necessary to enable a seismic comparison that was mostly affected by the footwall rock type and minimize the effect of other parameters. The polygons for data comparison were selected to suit the appropriate data to be used in each year.
Figure 9 compares the number of large events in the magnitude bins 2.0 < ML < 3.0 and ML > 3.0 for the two areas analysed. It is clear that there are significantly more large events on the shale footwall compared to the quartzite footwall for every year from 2016 to 2018. The year-on-year increase in each area is attributed to the increase in mining spans during this period. The mining span increases were approximately similar in the two areas.
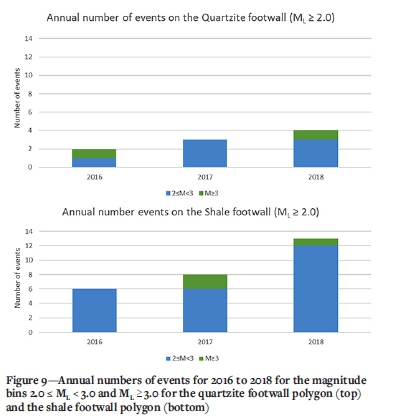
It is interesting to note that there is a tendency for more large events in mining areas with shale footwall compared to mining areas with quartzite footwall for similar mining depth and mining spans. Even though the tendency for large events is controlled by the existence of shale as opposed to quartzite in the footwall, the large events generally occur in the lava hangingwall. This may be associated with non-seismic deformation in the footwall shale as opposed to the brittle response in the lava hangingwall.
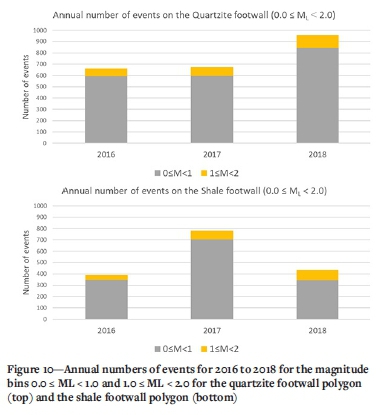
In terms of the smaller events in the magnitude bins 0.0 < ML < 1.0 and 1.0 < ML < 2.0, the opposite behaviour was recorded, with a larger number of small events on the quartzite footwall (Figure 10).
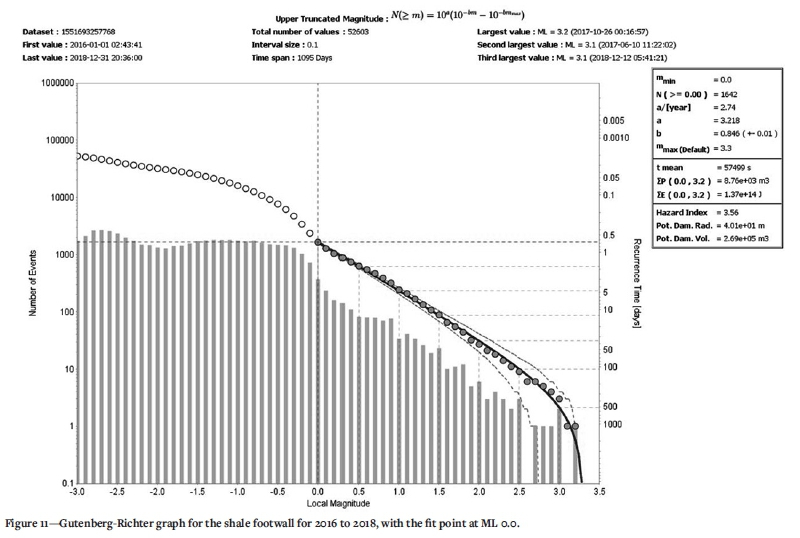
Frequency-magnitude graphs, also known as Gutenberg-Richter graphs, are used to display the number of seismic events recorded in magnitude bins/magnitude ranges. The Gutenberg-Richter graphs for the study data are shown in Figures 11 and 12. The slope of the graph of cumulative number of events per magnitude is called the b-value. This describes the relationship between the number of large events and small events. When two graphs are compared, a lower b-value (flatter slope) represents a higher seismic hazard as it indicates a tendency for more large events to occur in relation to the number of smaller events compared to a data-set with a higher b-value (steeper slope). From the frequency-magnitude graphs of the two areas (Figures 11 and 12), the b-value for the shale footwall is 0.846 compared to 0.917 for the quartzite footwall area. This again indicates that more large events can be expected on the shale footwall compared to the quartzite footwall, where the smaller events dominated.
A study to determine the location of the large events in the vertical direction indicated that most of the large events occurred in the stronger lava hangingwall and not in the footwall. The reason for this is not clear. It is postulated that the failure in the shale may occur non-seismically, resulting in more events in the stronger lava hangingwall rock owing to the resulting rock mass deformation. This requires additional study to understand the mechanism of deformation and resulting seismicity.
Moment tensor analysis can be used to identify and distinguish between potential source mechanisms of complex seismic events (Malovichco, 2020). The quality of moment tensor analysis is dependent on the layout of sensors in the seismic network. For high-quality moment tensors, the sensors should be geometrically well distributed so that the event location is surrounded by sensors. A quality factor is assigned to each moment tensor, and only moment tensors with a quality factor of 0.5 or more should be deemed of sufficient quality to be used in seismic analysis. In the study area the network density and geometrical distribution (36 x 4.5 Hz geophones) is favourable for good-quality moment tensor analysis.
The moment tensor solutions of all events with magnitudes exceeding ML = 1.5 and with quality factor of 0.5 or more, that occurred in the period 2015 to 2018 in the shale footwall area as well as the quartzite footwall area, were studied. Each moment tensor solution has two possible slip plane orientations (nodal planes) for the DC component as the numerical technique cannot distinguish between two conjugate nodal planes (Malovichco, 2020). It can be argued that the steeper plane is the more likely, as the stress orientation is such that the orientation of the maximum shear stress is steep and the damage observed underground is consistent with steep sources rather than shallow-dipping event sources. For this assessment, only the steeper one of each pair of nodal planes was used.
For the diagrams in this paper, the moment tensor solution source planes are shown in the lower hemispherical stereonet plot as poles, where the pole is orthogonal to the source plane and the position of the pole in the plot area represents the orientation of the source plane. A pole close to the centre of the plot area represents a shallow-dipping plane while a pole near the edge of the plot area represents a steep-dipping plane. As an example, where this pole (near the edge of the plot area) is at the three o'clock position in the plot area, the plane it represents has a north-south orientation and steep dip, and where it is in the twelve o'clock position, the plane that it represents has an east-west orientation and steep dip. The program also uses density contouring of poles with a similar position. Where several poles cluster in the plot area, red density contours are formed to highlight the clustering.
Figure 13 illustrates the steepest nodal planes of each moment tensor solution of 56 events with magnitudes in excess of ML = 1.5 in the shale footwall polygon on the eastern side of the mine. The black lines in the stereonet plots represent the plane of maximum excess shear stress (ESS) associated with the pre-mining stress state, according to the Mohr-Coulomb failure criterion. The pre-mining stress state was interpreted from field stress measurements in appropriately selected areas on the mine, using the strain cell overcoring technique. The major principal stress is proportional to the weight of the overburden and orientated approximately orthogonal to the reef plane, the intermediate principal stress k-ratio is approximately 0.7 and is orientated in the strata dip direction, and the minor principal stress k-ratio is approximately 0.4 and is orientated in the strike direction. The plane of maximum ESS associated with this stress field will then be oriented in the intermediate stress field direction with dip determined by the k-ratio between the maximum and minimum principal stresses as well as the rock mass friction angle. This plane of maximum ESS is also the plane of most likely failure in an isotropic and homogenous rock mass; that is, the most likely orientation of a shear fracture is represented by the black lines in the stereonet in Figure 13 (conjugate plane orientations).
Figure 14 illustrates a similar plot for events in the quartzite footwall area. The high-density contours confirm the previous observation that a large number of event source planes have similar orientations. The purple lines in the stereonet in Figure 14 are the two most common nodal plane orientations of the moment tensor solutions of the 52 events in this data-set. These lines have similar strike orientations, but opposite dip directions - namely northeast and southwest. The southwest dipping source planes are likely associated with events on west mining faces and the northeast dipping source planes with events on east mining faces. The general northwest-southeast orientation of these planes confirms the observation that most of the event source planes are orientated in a relatively narrow envelope around the northwest-southeast direction. This provides an important new insight into the seismic sources on Mponeng mine, not observed before. It appears that the majority of events in the data-set are face-related and oriented along the stope abutments rather than related to and oriented along the geological structures.
Numerical modelling of stope convergence
Numerical simulation of stope convergence was useful to compare the layouts at the eastern and western sides of the mine. The simulated peak value of stope convergence seemed to be a useful criterion to compare different areas at the mine. This is supported by the work of McGarr and Wiebols (1977), which indicated that the cumulative seismic moment IM0 is proportional to the stope convergence according to:

where G is the modulus of rigidity and AVc is the volume of stope closure. As a consequence, control of the volumetric convergence was long considered an important strategy to control the rate of energy release and the risk of rockbursting (see e.g. Budavari, 1983). Of particular interest is the relationship between the maximum closure recorded in the stope and the volumetric closure. This is explored by considering the convergence solution for a single parallel-sided stope. The two-dimensional plane strain convergence solution for such a parallel-sided stope is given by (Salamon, 1968):
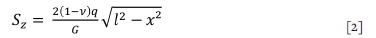
where Szis the vertical convergence, v is Poisson's ratio, q is the vertical virgin stress, G is the modulus of rigidity of the rock mass, l is the excavation half-span, and x is the distance from the excavation centre-line. Convergence is a maximum at the centre of the excavation (x=0) and based on Equation [2] can calculated from:
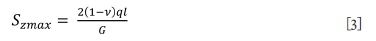
The volume of convergence (m3) for this geometry can be calculated by integrating Equation [2] along the length of the stope from -/ to / with the out-of-plane dimension given by b:

The solution of Equation [4] after integration is:

Substituting Equation [3] in Equation [5] we get:

For this 2D geometry, the volumetric closure is therefore proportional to the maximum closure. The benefit of maximum closure is that it is a very simple modelling parameter and useful as a first-order comparison of different layouts. It is, however, not without drawbacks as the simulated closure is dependent on the calibrated value of Young's modulus. Jooste and Malan (2020) illustrated the effect of this elastic parameter on the simulated closure and the stress values on remnants in high-extraction areas where total closure occurred. They warned that: 'Reducing Young's modulus has been discussed for many years in order to reduce the disparity between underground closure and simulated closure, but the concept has also been widely criticized.' Simulated elastic convergence is nevertheless valuable to give some preliminary insights when comparing different layouts, provided the limitations are clearly understood and recorded. Similarly, the elastic ERR concept should also be treated with caution as it does not consider the dissipative failure mechanisms occurring in the rock mass (Napier and Malan, 2014).
For the two geotechnical areas discussed in this paper, it was useful to compare maximum convergence for mining on the shale footwall with that for mining on the quartzite footwall. Modelling was done with the MAP3D code. For this preliminary modelling, modelling parameters were the same for both sides of the mine to investigate the effect of the layout geometries. The difference between quartzite and shale footwall was not explicitly simulated and a Young's modulus of 70 GPa was used throughout the model. Figure 15 illustrates the convergence for the western side of the mine with the quartzite footwall. The red colours represent higher convergence values. Convergence values exceeding 270 mm are shown in grey. This maximum convergence value was adopted based on a study by Scheepers et al., (2012) which found that the seismic response to mining increased significantly at mining spans where the modelled maximum closure of 270 mm is exceeded.
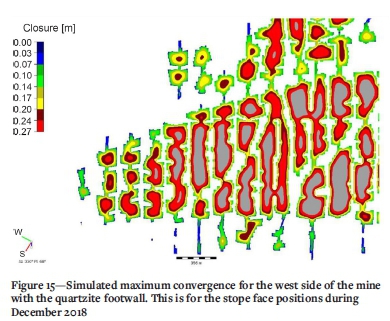
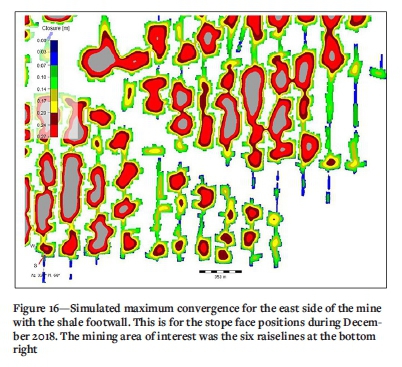
For the last four raiselines to the west, the simulated convergence does not exceed the adopted maximum convergence of 270 mm, while it was exceeded in nearly all the older raiselines. Figure 16 illustrates the simulated convergence for the eastern side of the mine with the shale footwall. The last six raiselines to the east at the bottom of the figure also do not exceed the convergence criterion. Owing to low-grade patches in this area, some ground has not been mined and the extraction ratio is less than the design. The associated simulated maximum convergence (for constant input parameters) is lower than the values on the western side of the mine (smaller mining spans). The seismic activity on the eastern side of the mine is therefore expected to be lower than the western side. The opposite behaviour is shown in Figure 9, however, with more large-magnitude seismic events on the east. This further supports the hypothesis that the difference in footwall type (which was not simulated in this model) plays a role in the observed seismic response.
The convergence simulations illustrated above are only used to investigate the effect of mining spans and geometries and not to investigate the effect of different footwall rock types. Inelastic failure is also not simulated in these codes.
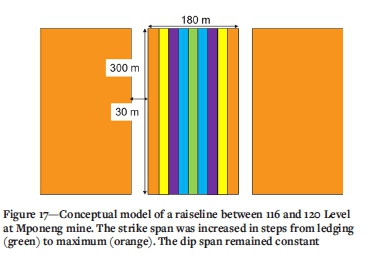
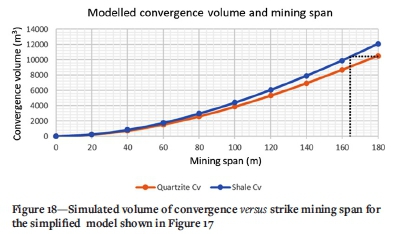
As a preliminary experiment to investigate the influence of different footwall rock types, numerical modelling, using MAP3D, was used to simulate the convergence volume for a conceptual raiseline at Mponeng mine at the same depth as 116 to 120 Level (approximately 3500 m below surface). In the model the maximum mining span is limited to 180 m (separated by 30 m wide dip pillars). The dip span is limited to 300 m.
For the model, Young's modulus was changed from 77 GPa for the quartzite to 63 GPa for the shale. These are rather crude assumptions as these values are assumed everywhere in the model and not only in the footwall. The simulated volume of convergence versus the mining span for the two modelling scenarios is plotted in Figure 17. As expected, the value is higher for the shale material and according to Equation [1], a larger cumulative seismic moment is expected. This does not, however, explain the occurrence of larger magnitude events and further work is required. Inelastic modelling and underground observations of closure needs to be conducted to explore this aspect further.
Conclusions
The behaviour of the mining stopes in deep gold mines is affected by the different rock types and the varying rock mass strength properties. The role of geotechnical conditions in the seismic hazard in deep-level gold mines is, however, not clearly understood and it has never been properly quantified. The seismic response to mining is expected to differ according to different rock types. To investigate this behaviour, the seismicity at Mponeng mine was studied. Two distinct geotechnical areas can be identified for the VCR horizon based on the difference in footwall lithology. On the eastern side of the mine, the footwall is shale and on the western side the footwall is quartzite. There is a gradual transition from thin quartzite footwall to thick quartzite footwall in the centre of the mine.
Careful seismic data selection for the east and the west sides of the mine was done to enable a comparison of the seismic response to mining between the two geotechnical areas. All mining areas or time periods with a significant difference in mining depth, mining geometry, and frequency of geological structures were excluded. Based on the selection criteria, only the data for the period 2016 to 2018 was used. During this period, mining on the shale footwall and the quartzite footwall took place on the same levels and the depths were comparable. The mining spans and mining geometries were also considered similar.
The study indicated that for the area with the shale footwall, there is tendency for more large-magnitude events to occur for a similar mining volume and span compared to the quartzite footwall area. The b-values of the frequency-magnitude distribution of events also confirmed that the seismic hazard for mining on the shale footwall appears to be higher, as more large-magnitude events can be expected for this area. By considering the moment tensor solutions for seismic events in the magnitude range ML > 1.5, it appears that the majority of these events are related to the face orientations and stress orientation, and not the geological structures.
The difference in seismic response for the two areas requires additional work. It can be hypothesised that the closure rates are higher in the area with the softer shale and the additional deformation results in an increase in seismic hazard. As shown in this paper, this can be easily demonstrated using simple elastic modelling and the postulate that cumulative seismic moment is proportional to convergence volume. Further work is nevertheless required using inelastic numerical modelling to represent the different rock types and failure in these rocks. Underground closure measurements are also required to confirm if higher closure rates are indeed occurring on the areas with the shale footwall.
This study emphasised an important, but hitherto neglected area of research, namely the effect of different geotechnical areas on the seismic risk in deep mines. Most research to date has focused on aspects such as the hazard associated with faults and dykes, improving the layouts to minimize the seismic risk, and the risk associated with pillars and remnants. The data in this paper is valuable as it demonstrates that seismic hazard can also be affected by aspects such as the footwall rock type. This implies that a more adaptable approach in terms of seismic hazard assessment may be required and that a 'one-size-fits-all' approach may not work best for different geotechnical areas.
Acknowledgements
This work forms part of the MSc study of Lourens Scheepers at the University of Pretoria.
References
Applegate, J.D. 1991. Rock mechanics aspects of sequential grid mining. M.Eng dissertation, University of the Witwatersrand. [ Links ]
Budavari, S. 1983. Rock mechanics in mining practice, Monograph series M5, Southern African Institute of Mining and Metallurgy, Johannesburg. [ Links ]
Cook, N.G.W., Hoek, E., Pretorius, J.P.G., Ortlepp, W.D., and Salamon, M.D.G. 1966. Rock mechanics applied to the study of rockbursts. Journal of the South African Institute of Mining and Metallurgy, vol. 66. pp. 435-528, [ Links ]
Denkhaus, H.G., Hill, F.G., and Roux, A.J.A. 1958. A review of recent research into rockbursts and strata movement in deep-level mining in South Africa. Papers of the Association of Mine Managers of South Africa, 1958-1959. pp. 245-269. [ Links ]
Durrheim, R.J. 2010. Mitigating the risk of rockbursts in the deep hard rock mines of South Africa: 100 years of research. Proceedings of Extracting the Science: 100 Years of Mining Research, Phoenix, AZ. Brune, J.F. (ed.). Society for Mining, Metallurgy, and Exploration, Littleton, CO. pp. 156-171. [ Links ]
Esterhuyse, J.C. and Malan , D.F. 2018. Some rock engineering aspects of multi-reef pillar extraction on the Ventersdorp Contact Reef. Journal of the Southern African Institute of Mining and Metallurgy, vol. 118, no. 12. pp. 1285-1296. [ Links ]
Jager, A.J. and Ryder, J.A. 1999. A Handbook on Rock Engineering Practice for Tabular Hard Rock Mines. Safety in Mines Research Advisory Committee, Johannesburg. [ Links ]
Jooste, Y. and Malan, D.F. 2020. The need for improved layout design criteria for deep tabular stopes. Journal of the Southern African Institute of Mining and Metallurgy, vol. 120, no. 1. pp. 23-32. [ Links ]
Malovichco, D. 2020. Description of seismic sources in underground mines: Theory. Bulletin of the Seismological Society of America, vol. 110, no. 5. pp. 2124-2137. [ Links ]
McGarr, A. and Wiebols, G.A. 1977. Influence of mine geometry and closure volume on seismicity in a deep-level mine. International Journal of Rock Mechanics and Mining Sciences, vol. 14, no. 3. pp. 139-145. [ Links ]
McGill, R.B. 2007. Strategies to manage seismicity in a deep VCR environment on Mponeng (1995-2003). Challenges in Deep and High Stress Mining. Potvin, Y., Hadjigeorgiou, J., and Stacey, D. (eds). Australian Centre for Geomechanics, Perth. pp. 217-223. [ Links ]
Napier, J.A.L. and Malan, D.F. 2014. A simplified model of local fracture processes to investigate the structural stability and design of large-scale tabular mine layouts. Proceedings of the 48th US Rock Mechanics/Geomechanics Symposium, Minneapolis, MN. American Rock Mechanics Association, Alexandria, VA. [ Links ]
Salamon, M.D.G. 1968. Two-dimensional treatment of problems arising from mining tabular deposits in isotropic or transversely isotropic ground. International Journal of Rock Mechanics and Mining Sciences, vol. 5. pp. 159-185. [ Links ]
Scheepers, L.J., Hofmann, G., and Morkel, I.G. 2012. The study of seismic response to production for a grid mining layout. SHIRMS 2012. Proceedings of the Second Southern Hemisphere International Rock Mechanics Symposium. Australian Centre for Geomechanics, Perth. pp. 387-406. [ Links ]
 Correspondence:
F. Malan
Email: francois.malan@up.ac.za
Received: 9 Feb. 2021
Revised: 17 Jan. 2022
Accepted: 31 Jan. 2022
Published: March 2022

