


Services on Demand
Article
 English (pdf)
 Article in xml format
 Article references
Indicators

Related links
-
 Cited by Google
 -
 Similars in Google
Share

 Permalink
Journal of the Southern African Institute of Mining and Metallurgy
On-line version ISSN 2411-9717
Print version ISSN 2225-6253
J. S. Afr. Inst. Min. Metall. vol.122 n.2 Johannesburg Feb. 2022
http://dx.doi.org/10.17159/2411-9717/1535/2022
PROFESSIONAL TECHNICAL AND SCIENTIFIC PAPERS
Effect of silica concentration on degree of sintering of chromite-silica ladle well filler sand based on South African raw materials
M. BothaI, II; J.D. SteenkampIII, IV; M.B. ShongweI; S. BrillIII; G. FreemantleIII
IDepartment of Chemical, Metallurgical and Materials Engineering, Tshwane University of Technology, Pretoria, South Africa. M.B. Shongwe: https://orcid.org/0000-0002-5115-5833
IIIntocast SA, 47 Kempton Park, South Africa
IIIMintek, Randburg, South Africa
IVDepartment of Chemical and Metallurgical Engineering, University of the Witwatersrand, Johannesburg, South Africa
SYNOPSIS
During steelmaking, one important factor for production efficiency is the free opening of the ladle nozzle during continuous casting. Free opening occurs when the well filler sand and the steel flow freely when the slide gate is opened. Well filler sands are used for the slide gate of a ladle to separate the slide gate refractory and the molten steel. The well filler sand is partially sintered by the heat of the molten metal, which can result in the ladle nozzle failing to open if the sand is not sintered to an appropriate extent. It is therefore of great importance that the sintering behaviour of well filler sand is understood.
We studied the effect of the well filler sand chemistry on its sintering properties. Samples of well filler sand with various chemical compositions were sintered in a high-temperature chamber furnace. Quantitative X-ray diffraction (XRD), inductively coupled plasma optical emission spectrometry (ICP-OES), and wavelength dispersive spectrometry (WDS) by electron microprobe analysis (EMPA) were used to analyse the various well filler sand mixes. Points of analysis were indicated on backscattered electron (BSE) micrographs. Quantitative element mapping was undertaken by energy dispersive spectrometry (EDS). Thermodynamic calculations in FactSage predicted the percentage liquid phase present for the various well filler sand compositions at equilibrium conditions.
The results of this work show that the degree of sintering of chromite-silica well filler sand depends strongly on the silica content. The amount of liquid phase formed increases with increasing silica content.
Keywords: well filler sand, sintering, ladle free opening, continuous casting, ladle nozzle.
Introduction
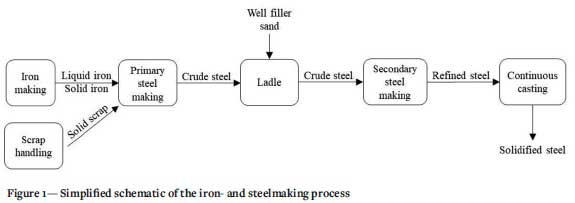
Iron- and steelmaking are mature processes consisting of various unit operations, as indicated in Figure 1.
After the process of continuous casting, the remaining slag must be removed from the refractory-lined ladle after every heat using a construction machine. The sliding gate at the bottom of the ladle is then cleaned. This is done manually using an oxygen lance. Any damaged ladle well parts are then replaced and damage to the top part of the ladle repaired. The ladle is then transported to the reheating station where it is heated with a mixture of natural gas and air to the desired temperature. Just before the molten metal is poured into the ladle, a standard amount of well filler sand is poured through a tube into the slide gate (Kovacic, Jurjovec, and Krajnc, 2014). The slide gate (or sliding gate) consists of two plates: an upper and a lower plate. When the openings in the plates align, the liquid steel flows into the tundish via the shroud. When the two parts are misaligned, the flow of liquid steel is prevented (Figure 2).
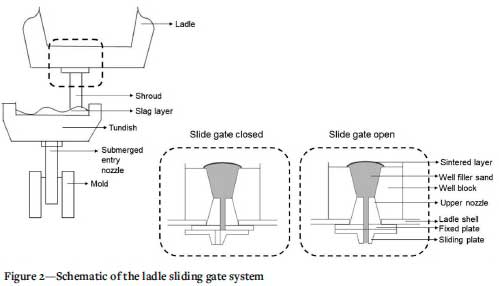
Well filler sand is poured on top of the tap-hole in the slide gate to prevent liquid metal from entering the ladle nozzle (Figure 2), which requires that the sand is sintered to an appropriate extent during preheating.
The aim is for the sand to break due to the pressure of the liquid metal when the slide gate in the nozzle is opened, allowing the ladle to freely open. The most likely issues that can be experienced are:
> An excessive degree of sintering prevents the slide gate from opening in order to pour the molten steel
> An inadequate degree of sintering can cause leakage of the molten steel.
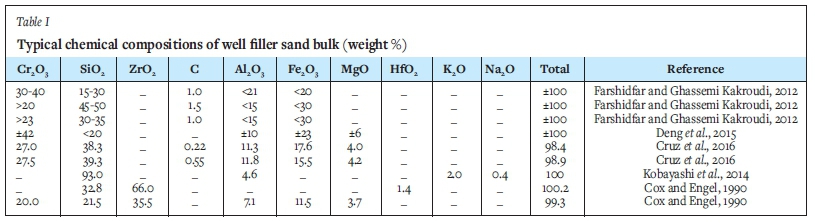
Various raw materials, such as chromite sand, quartz, zircon sand, carbon black, graphite, or coke, can be used to produce well filler sand (Table I). The oxide phases form the aggregate and matrix phases of the well filler sand (Cruz et al., 2016). Carbon hinders the sintering speed and lubricates the particles, thus improving the well filler sand flow. It prevents direct contact between the particles, which assists in the formation of weaker sintered material (Seixas, 2008; Cruz et al., 2016).
In the event of the ladle not opening freely, oxygen lancing is used to open the nozzle, reducing the cleanliness of the steel (Deng et al., 2016). The quality of steel, specifically high-grade clean steel, has been given more attention in recent years (Pistorius, 2019). Producing clean steel requires extensive control of the nonmetallic inclusions (Verma et al., 2011). Previous research (Wunnenberg, 2005; Zhang et al., 2007) demonstrated that the presence of contaminants and inclusions escalates the internal deformities and diminishes the fatigue and erosion resistance of steel. Since well filler sand can indirectly be a source of these inclusions due to lancing, it is important that the sintering behaviour of well filler sands is well understood (Kobayashi et al., 2014).
One example of such an investigation is the work done by Cruz et al., (2016), who studied the free opening performance of a steel ladle as a function of filler sand properties. In their study, four chromite- and silica-based well filler sands were fired in an electric furnace at 1600°C and analysed using scanning electron microscopy (SEM). Energy dispersive spectroscopy (EDS) was used to assist with phase identification. From the microstructures of the sintered sand obtained, it was observed that:
>All aggregates were chromium oxide. It was stated that a good dispersal of aggregates in the sintered well filler sand enhances its performance.
> Aggregates were surrounded by a matrix of higher silica content, with a lower melting point. It was stated that the correct amounts of aggregate and matrix phases are important for optimal performance of the well filler sand.
> The fraction of liquid in the well filler sand aids the formation of a sintered surface layer, which stops infiltration of the molten metal into the nozzle.
Another example is Deng et al., 2015 who studied the effect of temperature and holding time on the sintering of ladle filler sand by liquid steel. They used commercial ladle filler sand, based on chromite and quartz, sourced from Germany. Their main findings were that:
> The reaction between the silica phase and the chromite phase is the main mechanism for sintering of well filler sand.
> The reaction results in a liquid oxide phase, which becomes the binding phase between the solid oxide grains.
> The amount and grain size of silica have a great impact on the formation of the liquid phase.
> Faster formation of the liquid phase leads to more sintering.
> The sand becomes denser - i.e. agglomeration increases -with increased sintering time.
> Changes in the composition of chromite before and after sintering occurred.
> Changes in the bulk modal composition of filler sand samples occurred.
Although there have been numerous studies on the sintering of well filler sand (Cox and Engel, 1990; Cruz et al., 2016; Deng et al., 2015; Deng, 2016; Kobayashi et al., 2014; Kovacic et al., 2014; Tajik, Nugin, and Holke, 2018), few studies report on the systematic development of well filler sands and none deal with the systematic development of well filler sands based on South African raw materials. This work therefore forms part of a larger study aimed at filling the gap by focusing on the systematic development of well filler sands based on South African raw materials, specifically chromite and quartz.
Background
Sintering of well filler sand
According to Deng (2016), the primary mechanism for sintering well filler sand is the reaction between silica and chromite grains that leads to liquid formation. Different variables such as the chemistry of the liquid steel in contact with the well filler sand, sintering time, sintering temperature, and particle size distribution and chemistry of the well filler sand constituents have a great impact on sintering (Deng, 2016; Kovacic et al., 2014; Cruz et al., 2016; Tajik, Nugin, and Holke, 2018). All well filler sands used for the ladle tap-hole nozzle are powders of various chemical compositions in different weight ratios and particle sizes. At least one composition is needed to react favourably with liquid metal and to form viscous glass at high temperatures capable of preventing the metal from penetrating the well. Moreover, a highly refractory aggregate phase is necessary to keep the well filler in shape throughout the process of refining before casting takes place (Tseng et al., 2012). In a study by Deng (2016), where two different chromite-based well filler sands were used for laboratory sintering experiments, the sand with smaller size and higher silica content formed more liquid phase and was much denser. It was demonstrated that liquid phase formation is related to dissolution of the silica phase in the well filler sand. It was noted that silica plays a significant role in the degree of well filler sand sintering.
Aim of this investigation
In this work, the effect of silica concentration on the degree of sintering of chromite-silica well filler sand is investigated to understand:
> The main sintering mechanism of well filler sand based on South African raw materials
> The effect of the silica content on the extent of sintering of the well filler sand.
Experimental procedure
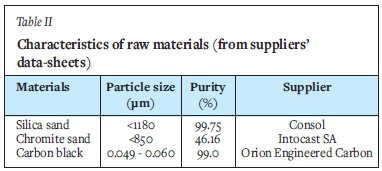
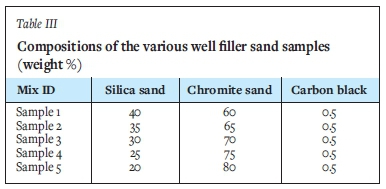
Five different chromite-based well filler sands were used. These sands all consisted of three raw materials, namely silica sand, chromite sand, and carbon black powder. The characteristics of the raw materials, as obtained from the supplier's data-sheets, are summarized in Table II.
The well filler sand chemistry was varied according to Table III, by varying the SiO2 and Cr2O3 content while keeping the C content constant. Weighing was accomplished with the use of a laboratory scale (Mettler Toledo, SB32001-F Delta Range). The weighed raw materials were blended using a Turbula Shaker Mixer T2F at a rotational speed of 101 r/min for one hour.
Thirty grams of each mix of well filler sand was poured into 27 mm diameter alumina crucibles. The crucibles were charged into a high-temperature chamber furnace (Lenton, B-type, England) heated at a rate of 10°C/min, and sintered at 1600°C for one hour in air. At the end of the sintering time, the furnace was switched off and the samples left overnight to cool to room temperature. The cooled, solid sintered samples were removed from the furnace and sectioned for analysis.
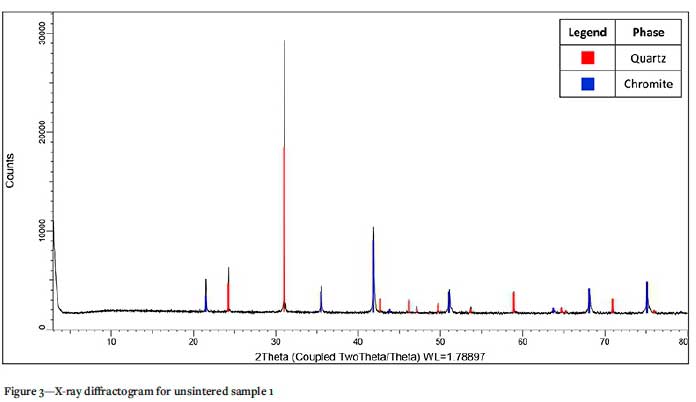
The bulk phase chemical compositions of each unsintered and sintered sample, as well as the as-received raw materials, were determined by X-ray diffraction (XRD) analysis using a Bruker D8 Advance powder diffractometer, with Linxeye detector and variable divergence and fixed receiving slits with Fe-filtered Co-Ka radiation. The instrument was run from 0 to 80° 20. Phases were initially identified using Bruker Eva software. Quantitative XRD was performed using the DIFFRAC.SUITE TOPAS software package, based on Rietveld refinement and the fundamental parameters approach (FPA).
The unsintered and sintered samples, as well as the as-received raw materials, were prepared into polished sections for analysis to determine the specific phase chemistry. Selected phases were analysed for major elements as well as selected trace elements. Analyses were carried out using wavelength dispersive spectrometry (WDS) by electron microprobe analysis (EMPA) using a Jeol JXA-8230 Superprobe. Oxygen was assigned stoichiometrically. Typically, counting times of 20 seconds on peak and 5 seconds on each of two background positions adjacent to the peak were employed at an accelerating voltage of 20 kV, and a beam current of 30 nA with a beam defocused to a diameter of 5 jim, except where noted otherwise. A defocused beam of 10 jim diameter was used on sinter material that comprised a fine intergrown matrix of Si, Al, Cr, Fe, and Ti phases. The intergrown phases in the matrix were nanometric in scale and it was not possible to target individual phases within the sinter with the beam resolution of 1 jim. In certain points a reduced beam of 3 jim was used with an increased count time to ensure a reasonable total was achieved. The system was calibrated using pure elemental oxide and sulphide standards. BSE images of points of interest were captured indicating the point of analysis.
Major elements were determined on the pulverized portion of the unsintered and sintered samples, as well as the as-received raw materials, using inductively coupled plasma optical emission spectroscopy (ICP-OES) (Thermo Scientific, iCAP7600 Radial). These elements were Mg, Al, Si, Ca, Ti, V, Cr, Mn, Fe, Co, and Ni. This method has a detection limit of 0.05% on Mg, Al, and Ca, 0.01% on Ti, V, Mn, Co, and Ni, 0.2% on Si, 1% on Cr, and 0.5% on Fe. The results from the chemical analysis were used for mineral-chemical reconciliation of XRD data.
FactSage 7.2 thermodynamic software (Bale et al., 2002) was employed to predict, as a function of temperature, the different phases present for the various well filler sand compositions as well as the percentage liquid phase present in each. The calculations were based on the mixtures defined in Table III and the bulk chemical compositions of each raw material. The liquid phase formed at equilibrium as a function of temperature was plotted.
Results and discussion
Bulk phase compositions
Quantitative bulk phase chemical analysis by XRD revealed that the chromite does not have a typical end-member composition but rather one more like those found in the Bushveld Complex, with appreciable Mg and Al. Further to the chromite, inclusions, attached gangue and veins of gangue minerals were identified. The gangue phases included feldspar, pyroxene, quartz, and talc as identified by EMPA.
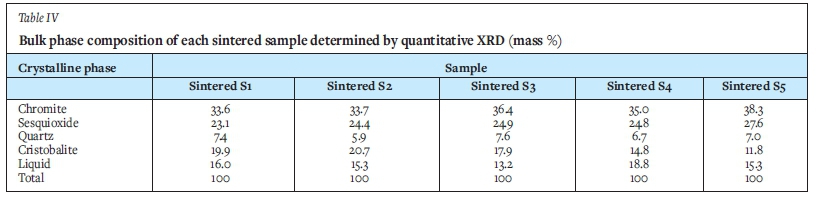
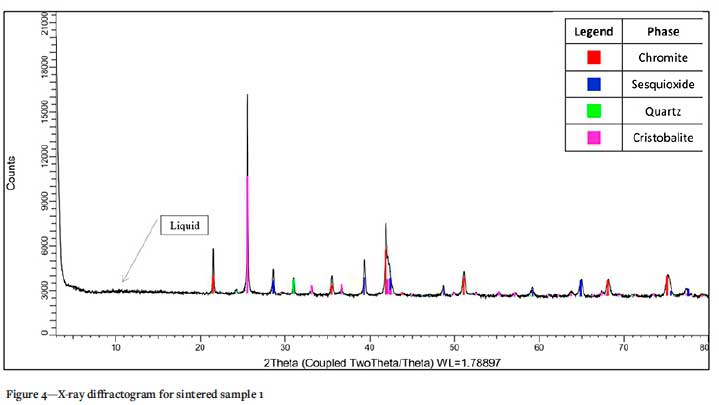
For the sintered samples, four crystalline phases were identified by XRD analysis. Chrome-bearing phases identified were chromite and the sesquioxide, eskolaite (Cr2O3). Further, quartz and cristobalite (both with end-member chemical formula SiO2) were noted. Each diffractogram between 3 and 15° 20 was shaped as a broad hump, suggested the presence of a liquid phase (Bhagath Singh and Subramaniam, 2016). The presence of a liquid phase was expected from the thermodynamic calculations to follow, but phase chemical analyses indicated that not all the quartz reported to the liquid - some was unaffected, while other converted to cristobalite.
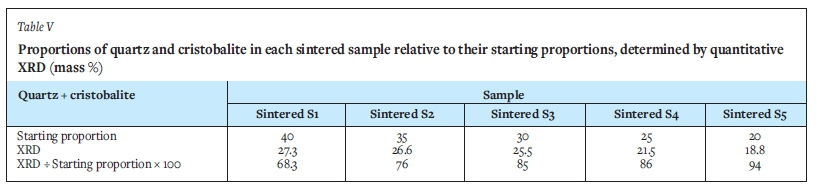
The X-ray diffractograms for sample 1, sintered and unsintered, are shown in Figure 3 and Figure 4 respectively. The bulk composition of each sintered sample is shown in Table IV and the proportion of quartz and cristobalite in each sintered sample relative to their starting proportions in Table V. Melted SiO2-rich liquid can recrystallize when slow-cooled and would not necessarily report as an amorphous liquid phase under XRD. The use of the XRD amorphous phase quantification would be more justifiable if the samples were water-quenched.
Main sintering mechanism for well filler sand based on South African raw materials
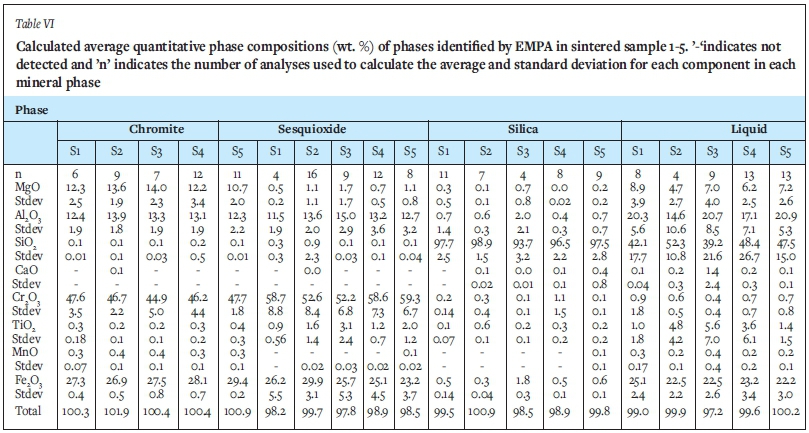
The main sintering mechanism of well filler sand based on South African raw materials is the reaction between the silica and chromite sand grains that leads to liquid formation. This observation is supported by the bulk phase chemical analysis, which detected only chromite and quartz in the unsintered samples, while in the sintered samples, sesquioxide, cristobalite and a liquid phase were also noted (Table IV). Examination by electron microprobe confirmed the presence of chromite, silica, sesquioxide, and the liquid phase. The liquid phase between the chromite and quartz grains, responsible for sintering, comprised Si, Al, Mg, and Fe (Table VI). These elements mobilized from the quartz and chromite (Table VII). This observation is in agreement with that of Deng (2016), the main difference between the two sands being the silica size and content. SEM images of Deng's (2016) sintered sand at various sintering times demonstrated three phases: liquid; chromite, and silica. Deng (2016) also analysed the boundary between chromite and silica in order to investigate the sintering mechanism and demonstrated that a thin layer of liquid formed between the silica and chromite phases. Cations such as Fe3+, Mg2+, and Al3+ in chromite diffused to the boundary and reacted with silica to form a liquid phase, while Cr3* remained in the chromite phase (van Orman and Crispin, 2010; Vogt, Dohmen, and Chakraborty, 2015; Suzuki, Yasuda, and Ozawa, 2008). In a study by Cruz et al. (2016), from SEM images and EDS analysis of four different chromite-based well filler sands sintered at 1600°C, it was also observed that all aggregates were chromium oxide and that the aggregates were surrounded by a matrix of higher silica content that had an aspect of a fully fused material (liquid phase).
Quantitative phase analysis
The specific chemical compositions of the phases were quantified by EMPA analysis: the two Cr-bearing phases (chromite and sesquioxide), the Si-bearing phases lumped together (quartz and cristobalite), and the liquid phase located in the welds between chromite and silica particles. The average phase compositions, determined by EMPA, are presented in Table VI. Due to the oxidizing atmosphere in which the samples were sintered for this study, Fe2+ ions oxidized to Fe3+ and generated vacancies which resulted in separation of a Fe-rich phase, sesquioxide (Tathavadkar, Antony, and Animesh Jha, 2005). During oxidation of chromite ore, the Fe2+ is known to preferentially report to the sesquioxide lamellae that form (Biswas et al., 2018). To maintain charge in the spinel matrix, Mg2+ counter-diffusion is needed, which results in Mg depletion of the sesquioxide phase (Tathavadkar, Antony, and Animesh Jha, 2005). The distinction between chromite and sesquioxide was determined in this study by XRD analysis (Figure 3 and Figure 4). The distinction was further made by the Mg content. The range of Mg in chromite was identified as 'high' (>10 wt. % MgO), while in sesquioxide Mg was 'low/ (<2 wt. %).
Cation recalculation was carried out for both the chromite and sesquioxide phases. For phases assigned as 'chromite', stoichiometry generally conforms to expected ratios for this structure (FeCr2O4), further supporting this assignment in most cases. For phases assigned as 'sesquioxide' the cation ratios do not conform to a sesquioxide structure (Cr2O3), but, however, neither can they be assigned to a chromite structure (Fe2Cr2O 4). The assignment as 'sesquioxide' is therefore based on XRD analyses -this conclusion is valid since good XRD reconciliation/validation was achieved using EPMA compositional data on 'sesquioxide' phases.
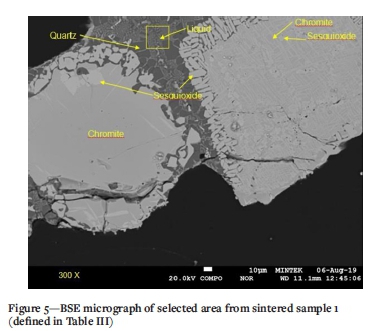
A BSE image from a selected area in sintered sample 1 is presented in Figure 5. The Cr-bearing particles display a breakdown along their boundaries, evidenced by the lenticular, blocky grains with higher BSE intensities. EMPA showed that the lenticular to have higher concentrations of Cr than chromite centres, and these are classified as sesquioxide. Chromite in the sintered samples also displays typical exsolution lamellae, noted by the higher BSE intensity and cross-hatched form. EMPA revealed that the bright phases have a lower Mg content and are therefore considered to be sesquioxide, while the areas with the lower BSE intensity revealed higher concentrations of Mg and are therefore considered to be chromite.
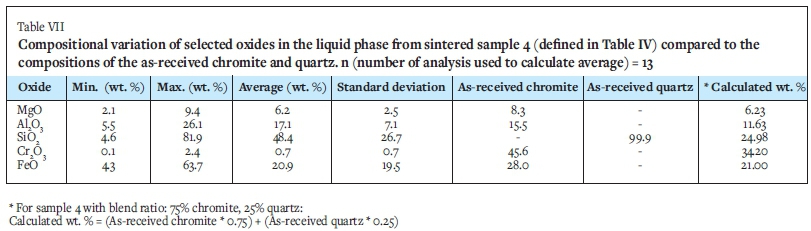
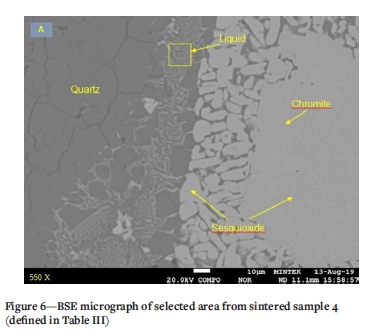
A magnified portion of the liquid phase from sintered sample 4 is depicted in Figure 6. Here the chromite and exsolution lamellae and broken-down grain boundaries of sesquioxide are evident in conjunction with quartz. Utilizing a defocused beam, the composition of the liquid phase was determined. The compositional variation of the liquid phase from sintered sample 4 is shown in Table VII. While the composition is highly variable, it is clear that these elements were mobile and diffused from the surrounding quartz and chromite upon sintering. According to Scowen, Roeder, and Helz (1991) the compositional changes are the result of the re-equilibration of chromite with the residual melt by cationic diffusion.
Mineral-chemical reconciliation
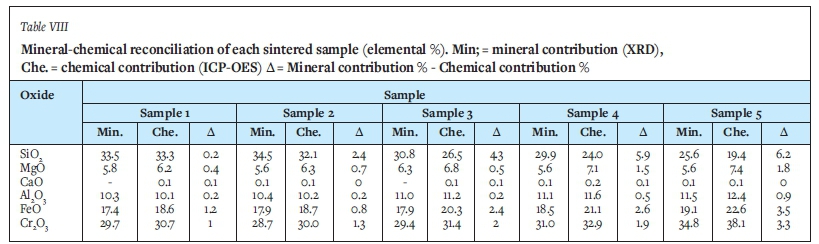
The results from the chemical analysis were used for mineral-chemical reconciliation of XRD data (Table VIII). The standard deviations for all the elements in the liquid phase were below 5% and the averages were hence considered to be acceptable. Overall, the mineral-chemical reconciliation is good, the slight differences noted are due to variation in the composition of all phases (results are stated for the liquid phase only, but we do see variation in the chromite and sesquioxide as well. For example, the SiO2 in the amorphous phase ranges from 48-58% and Cr2O3 in chromite from 44-50%.
Quantitative mineral mapping
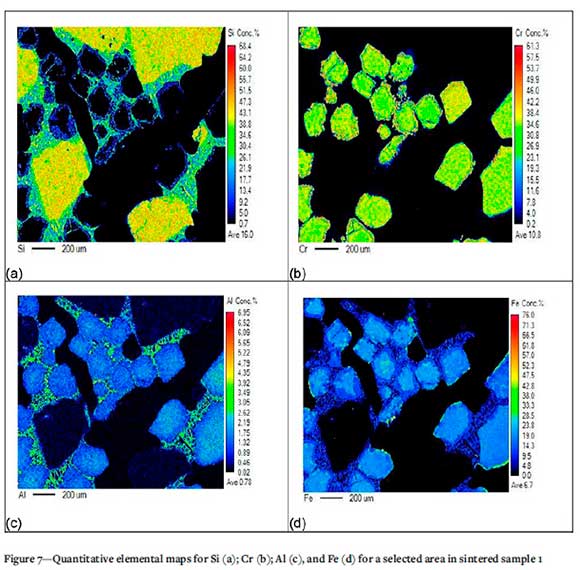
Quantitative mineral maps for sintered samples, at various magnifications, are presented in Figures 7-11 for the major components of the samples: Si, Cr, Al, and Fe. The elemental map of selected area in sintered sample 1 (Figure 7) highlights the dissolution of the silica phase and the presence thereof in the liquid phase. Cr is not present in the liquid phase. Al and Fe are present in the chromite phase as well as the liquid phase; this further confirms the mobilization of Si, Al, and Fe from the starting material grains to the liquid phase in-between.
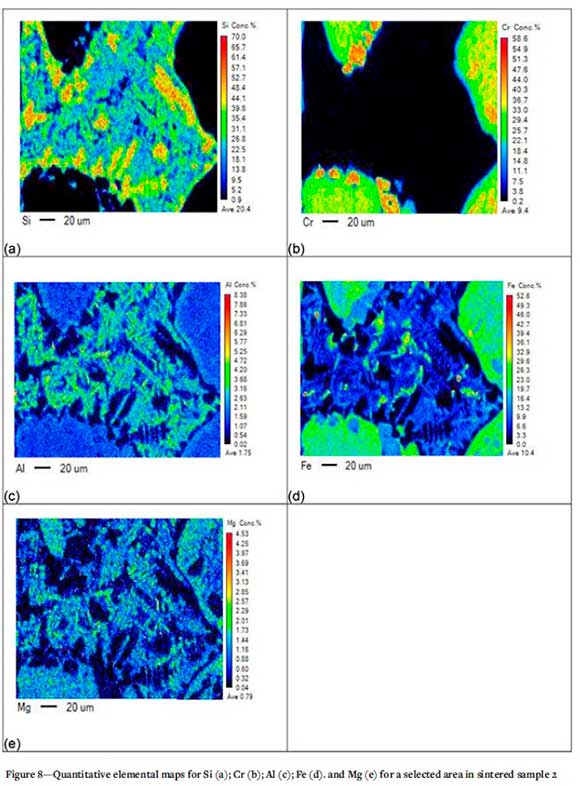
The elemental map of the selected area in sintered sample 2 (Figure 8) indicates the presence of a chromite-bearing phase with higher Al and Mg contents at the boundary of the chromite and liquid phase. Higher Si concentration is also noted at the boundary between the chromite and liquid phase, demonstrating the dissolution of the silica phase.
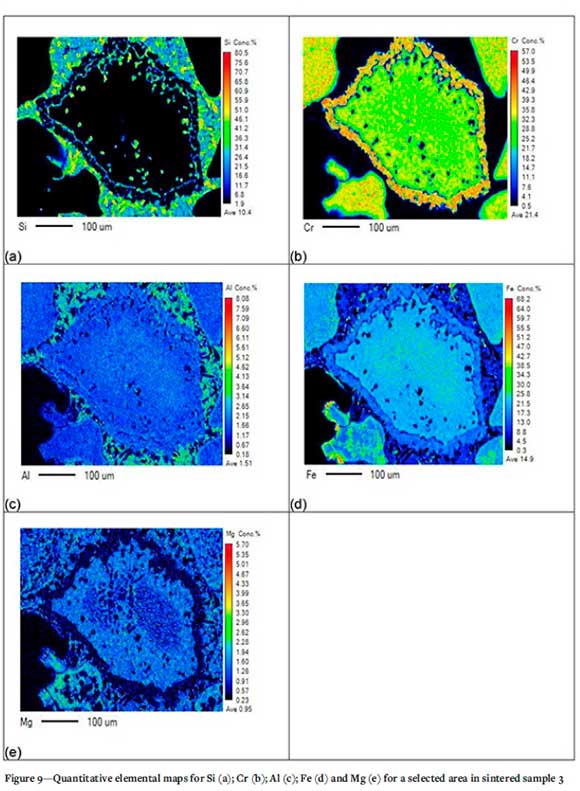
In Figure 9, the chromite particles display a breakdown along their boundaries. The Al and Mg concentrations are higher along the boundaries of the chromite particles. Figure 9 also demonstrates the presence of liquid phase (which contains a significant amount of Si), surrounding the chromite grains.
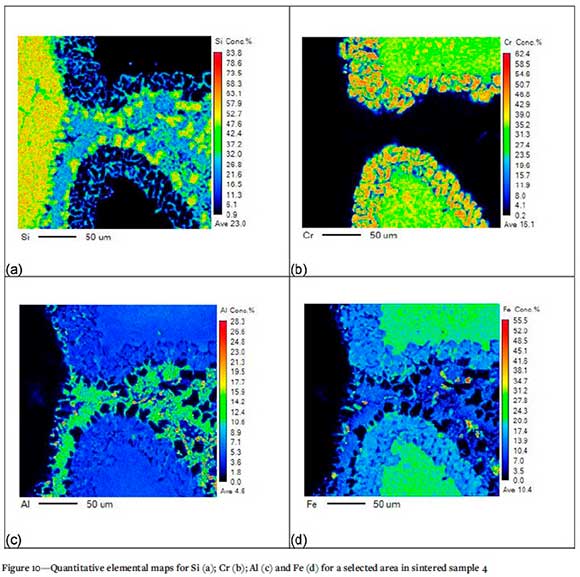
The breakdown of chromite particles and Fe depletion at the boundaries of the chromite particles (Demir and Eric, 2015) is evident in Figure 10. The silica phase in contact with the chromite phase is displayed with the liquid phase forming in-between the silica and chromite phases. Again, the Al concentration is higher in the liquid phase than in the chromite phase, indicating mobilization of the Al from the chromite phase to the liquid phase.
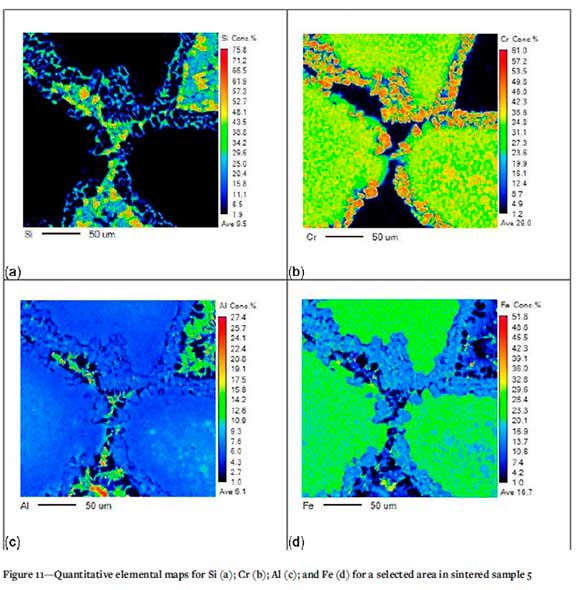
Figure 11 shows the interface between various chromite grains. Here the silica phase is no longer visible and the Si is now contained in the liquid phase between the chromite grains. Breakdown of the chromite grains is visible, with lower Fe concentrations at the chromite grain boundary and significant amounts of Al and Fe present in the liquid phase.
The quantitative elemental maps further demonstrate the mobilization of Si, Al, and Fe from the starting material grains to the liquid phase in-between (Figures 7-11). Elemental maps from silica well filler sand sintering experiments by Kobayashi et al. (2014) similarly demonstrated the presence of Al and Si in the liquid phase. A study by Demir and Eric (2015) on the dissolution of chromite in liquid slags demonstrated that the chromium and iron concentrations in the chromite decreased from the centre of the chromite grains towards the periphery. Magnesium and aluminium concentrations increased at the edges of the chromite grains.
The quantitative elemental maps highlight the dissolution of the silica phase and the presence thereof in the liquid phase. They also indicate the silica phase in contact with the chromite phase, and that a liquid phase is forming between the silica and chromite phases. This demonstrates that the main mechanism for sintering of well filler sand based on South African raw materials is the reaction between the silica and chromite sand grains, and that the silica and chromite phases react to form a liquid phase responsible for sintering.
Effect of the silica content on the extent of sintering
We further found that the silica content in well filler sand has a strong influence on its degree of sintering, with the amount of liquid phase forming increasing with increasing silica content. This observation is supported by XRD analysis. Table V indicates the quantity of quartz in each sintered sample compared to that of the starting proportions. The comparison indicates that sintered samples 1 and 2 (defined in Table III) containing the highest percentage of quartz pre-sintering contained the least amount of quarts post-sintering (68.3% and 76% of starting proportion respectively), while sintered sample 5 (defined in Table III), with the least amount of quartz pre-sintering, contains the most (94% of starting proportion) quartz after sintering. It is important to note, however, that slow cooling of the samples most likely influenced the crystallization sequence of the samples. Kobayashi et al. (2014) similarly concluded that the liquid proportion increased as a result of the dissolution of the silica phase into the liquid phase.
From the quantitative phase analysis (Table VI), the liquid phase in all of the sintered samples consisted of significant amounts of SiO2. This is further illustrated by the quantitative mineral mapping; which illustrates the high concentration of Si in the liquid phase (Figures 7-11). Again, this observation is in agreement with Deng (2016), where SEM images indicated a larger amount of liquid phase in the sample which contained more silica. Cox and Engel (1990) sintered a zircon well filler sand containing silica, at 1600°C, and similarly, observed from SEM images that the zircon grains were chained together by thin glassy bridges comprised of silica.
The degree of sintering is, however, only quantified by the amount of liquid phase formation in our study. Iron ore pelletizing studies by Nellros et al. (2015) and Kumar et al. (2018) demonstrated that there is typically an optimum amount of liquid phase required for each combination of particle shapes, sizes, and surface chemistry to give an optimum sintering strength. Excessive liquid formation is typically detrimental to sintering strength. Nellros et al. (2015) and Kumar et al. (2018) presented methods to quantify the degree of sintering through automatic image analysis based on the geometry and structure of particle joins.
FactSage calculations
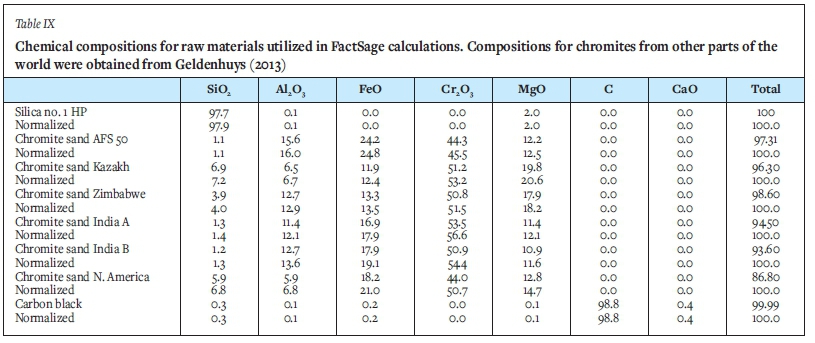
FactSage 8.0 thermodynamic software was employed to predict, as a function of temperature, the percentage liquid phase present in each sample at equilibrium conditions. The ratios were defined in Table III and the raw material compositions are presented in Table IX. Furthermore, the optimal ratio (sample 3) were repeated on chromite compositions from other parts of the world, more specifically chromite with different Al2O3 and MgO contents . All as-received chemical compositions were normalized prior to calculations.
The Equilib module was utilized and the FToxid, FSstel, and FactPS databases applied. Of the compound species, only gas and solids were selected. For the solids, duplication was suppressed with the order of preference FToxid, FSstel, and FactPS. All solution species were selected, except in cases where multiple options were available and then the A-phase only was selected. The temperature range 1200-1700°C was considered at intervals of 100°C. Pressure was set at 1 atmosphere. Both normal equilibrium and transitions were calculated. The results are presented in Figure 12 for the South African chromite mixed at various ratios with silica, and in Figure 13 for chromites from all over the world mixed at a ratio of 70/30, chromite/silica.
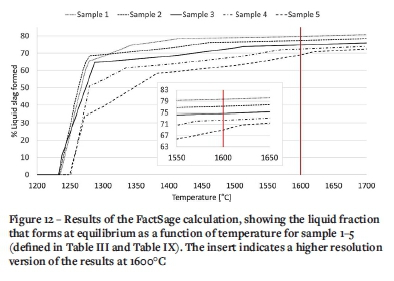
For the South African chromite, the calculated percentage liquid at 1600°C increased with increased silica content in the well filler sample (Figure 11), as seen from samples 1 and 2 where the percentage liquid formed was 80% and 77% respectively. With lower silica content, as seen from sample 3, 4, and 5, the percentage liquid decreased, to 75, 72, and 69% respectively. The fact that the actual liquid phase formed after sintering (Table IV) is significantly less than the predicted liquid phase formation at equilibrium, indicates that equilibrium conditions were not reached during the experimental work. The difference in results can therefore be attributed to heat and/or mass transfer phenomena (if the samples are left long enough at temperature, more liquid phase could form). The variances may also be due to inaccuracies in the XRD method applied.
For chromites from other parts of the world, slightly less liquid phase will form at 1600°C compared to the South African chromite (Figure 12). The biggest differences lies at the lower temperatures where the liquid phase would start to form: for the South African chromite, liquid starts to form at 1238°C. For the chromites from India the temperature is 1256°C, from Kazakhstan 1289°C, Zimbabwe 1290°C, and North America 1300°C. This would probably give the South African chromite a competitive advantage.
Conclusions
The aim of this research was to study the effect of silica concentration on the degree of sintering of chromite-silica well filler sand produced from South African raw materials. Laboratory sintering experiments were conducted at constant temperature, time, and atmosphere. The effect of various SiO2 concentrations on the microstructural phase evolution and amount of liquid phase formation was studied using SEM, EMPA, and XRD. Phase evolution was also simulated using FactSage thermodynamic software.
It can be concluded from this study that:
> The main mechanism for sintering of well filler sand based on South African raw materials is the reaction between the silica and chromite sand grains.
> The silica and chromite phases react to form a liquid phase responsible for sintering.
> An increase in silica content in the well filler sand resulted in the formation of a liquid phase and was observed to also improve sintering. However, the silica and chromite contents were both responsible for sintering.
> Sintering of the chromite-based well filler sand, which initially consists of only chromite and silica, will result in formation of a second chrome-bearing phase (sesquioxide) and cristobalite with end-member chemical formula SiO2.
> Previous well filler sand studies (Cox and Engel, 1990; Cruz et al., 2016; Deng et al., 2015; Deng, 2016; Kobayashi et al., 2014; Kovacic et al., 2014; Tajik, Nugin, and Holke, 2018)
performed in an inert atmosphere did not report formation of a second chrome-bearing phase (sesquioxide). Due to the oxidizing atmosphere in which the samples were sintered for this study (an oxidative environment is more representative of the application of well filler sand in industry), Fe2+ ions oxidized to Fe3+ and generated vacancies which resulted in separation of an Fe-rich phase, sesquioxide (Tathavadkar, Antony, and Animesh Jha, 2005).
Future work, addressing the following aspects, will be useful.
> Further studies on the laboratory-scale, using the methods developed in this investigation, to quantify the effect of carbon addition, particle size distribution, and variations in temperature and holding time on the extent of sintering.
> Investigation on the laboratory scale into the effect of steel grade on the extent of sintering.
> Investigation, through a combination of heat transfer modelling and industrial trials, into the temperature profile of the well filler sand during ladle preheating and transportation of liquid steel.
> Industrial trials to study the effect of the various parameters mentioned on the ladle free opening rate.
> Further studies into the effect of compaction of the well filler sand due to ferrostatic pressure of liquid steel in the ladle.
> Further studies to investigate the effect of pO2 - atmosphere in the laboratory furnace compared to under liquid steel in the ladle.
> Investigation of the use of automated measurement of the degree of sintering using optical microscopy through image analysis of particle joins.
Acknowledgements
This work is published with the permission of Mintek and Intocast SA. Financial support of Intocast SA is gratefully acknowledged.
References
Bale, C.W., Chartrand, P., Degteröv, S.A., Eriksson, G., Hack, K., and Mahfoud, R.B. 2002. FactSage thermochemical software and databases. Calphad, vol. 26, pp. 189-228. [ Links ]
Bhagath Singh, G.V.P. and Subramaniam, K.V.L. 2016. Quantitative XRD study of amorphous phase in alkali activated low calcium siliceous fly ash. Construction and Building Materials, vol. 124. pp. 139-147. [ Links ]
Biswas, A., Konar, B., Kapure, G.U., Sahu, N., and Paliwal, M. 2018. Pre-oxidation treatment of Indian chromite ores: Kinetics and phase transformation behaviour relevant to ferrochrome manufacturing and pelletization. Mineral Processing and Extractive Metallurgy, vol. 130, no. 1. pp. 1-11. [ Links ]
Cox, F.S. and Engel R. 1990. Ladle sands: Testing and application. Proceedings of the Electric Furnace Conference. The Iron and Steel Society, Warrendale, PA. [ Links ]
Cruz, R.T., Pelisser, G.F., Bielefeldt, W.V., and Braganca, S.R. 2016. Free opening performance of steel ladle as a function of well filler sand properties. Material Research, vol. 19, no. 2. pp. 408-412. [ Links ]
Demir, O. and Eric, R.H. 2013. Rate and mechanism of reduction-dissolution of chromite in liquid slags. High Temperature Materials and Processes, vol. 32, no. 3. pp. 255-263. [ Links ]
Deng, Z. 2016. Study on the interaction between refractory and liquid steel regarding steel cleanliness. Doctoral thesis, KTH Royal Institute of Technology, Sweden. [ Links ]
Deng, Z., Glaser, B., Bombeck, M.A., and Sichen, D. 2016. Mechanism study of the blocking well due to sintering of filler-sand. Steel Research International, vol. 87, no. 4. pp. 1-10. [ Links ]
Farshidfar, F. and Ghassemi Kakroudi, M. 2012. Effect of chromite-silica sands characteristics on performance of ladle filler sands for continuous casting. Journal of Iron and Steel Research International, vol. 19, no. 3. pp. 11-13. [ Links ]
Geldenhuys, I. 2013. Aspects of DC chromite smelting at Mintek - An overview. INFACON XIII. Proceedings of the Thirteenth International Ferro-Alloys Congress, Almaty, Kazakhstan, 9-12 June 2013. https://www.pyrometallurgy.co.za/InfaconXIII/0031-Geldenhuys.pdf [ Links ]
Kobayashi, Y., Todoroki, H., Kirihara F., Nishijima, W., and Komatsubara, H. 2014. Sintering behaviour of silica well filler sands for sliding nozzle in a ladle. Journal of the Iron and Steel Institute of Japan, vol. 54, no. 8. pp. 1823-1829. [ Links ]
Kovacic, M., Jurjovec, B., and Krajnc, L. 2014, Ladle-nozzle opening and genetic programming. Materials and Technology, vol. 48, no. 1. pp. 24-26. [ Links ]
Kumar, T.K.S., Simonsson, M., Viswanathan, N.N., Ahmed, H., Andersson, C., El-Geassy, A.A., and Björkman, B. 2018. Establishing a novel methodology to correlate the macroscopic and microscopic degree of sintering in magnetite pellets during induration. Steel Research International, vol. 89, no. 3. doi:10.1002/srin.201700366 [ Links ]
Nellros, F., Thurley, M.J., Jonsson, H., Andersson, C., and Forsmo, S.P.E. 2015. Automated measurement of sintering degree in optical microscopy through image analysis of particle joins. Pattern Recognition, vol. 48, no. 11. pp. 3451-3465. [ Links ]
Scowen, P.A.H., Roeder, P.L. and Helz, R.T. 1991. Reequilibration of chromite within Kilauea Iki lava lake, Hawaii. Contributions to Mineralogy and Petrology, vol. 107, no. 1. pp. 8-20. [ Links ]
Suzuki, A.M., Yasuda, A., and Ozawa, K. 2008. Cr and Al diffusion in chromite spinel: Experimental determination and its implication for diffusion creep. Physics and Chemistry of Minerals, vol. 35, no. 8. pp. 433-445. [ Links ]
Tathavadkar, V.D., Antony, M.P., and Jha, A. 2005. The physical chemistry of thermal decomposition of South African chromite minerals. Metallurgical and Materials Transactions B, vol. 36B, no. 1. pp. 75-84. [ Links ]
Tajik, R., Nugin, J., and Holke, C. 2018. The influence of placement and sintering time of the steel ladle filler-sand. KTH Royal Institute of Technology, Sweden. [ Links ]
Tseng, T-T., Wu, H-M., Chen, C-N., Cheng, C-C., Uan, J.Y., Wu, W., and Tseng, W.J. 2012. Refractory filler sands with core-shell composite structure for the taphole nozzle in slide-gate system of steel ladles. Ceramics International, vol. 38. pp. 967-971. [ Links ]
Van Orman, J.A. and Crispin, K.L. 2010. Diffusion in oxides. Reviews in Mineralogy and Geochemistry, vol. 72, no. 1. pp. 757-825. [ Links ]
Verma, N., Pistorius, P.C., Fruehan, R.J., Potter, M., Lind, M., and Story, S. 2011. Transient inclusion evolution during modification of alumina inclusions by calcium in liquid steel: Part I. Background, experimental techniques and analysis methods. Metallurgical and Materials Transactions B, vol. 42, no. 4. pp. 711-719. [ Links ]
Vogt, K., Dohmen, R., and Chakraborty, S. 2015. Fe-Mg diffusion in spinel: New experimental data and a point defect model. American Mineralogist, vol. 100, no. 10. pp. 2112-2122. [ Links ]
 Correspondence:
M. Botha
Email: mizellebot@gmail.com
Received: 18 Feb. 2021
Revised: 5 Nov. 2021
Accepted: 11 Jan. 2022
Published: February 2022

