


Services on Demand
Article
 English (pdf)
 Article in xml format
 Article references
Indicators

Related links
-
 Cited by Google
 -
 Similars in Google
Share

 Permalink
Journal of the Southern African Institute of Mining and Metallurgy
On-line version ISSN 2411-9717
Print version ISSN 2225-6253
J. S. Afr. Inst. Min. Metall. vol.122 n.2 Johannesburg Feb. 2022
http://dx.doi.org/10.17159/2411-9717/1262/2022
PROFESSIONAL TECHNICAL AND SCIENTIFIC PAPERS
Evaluating the potential drilling success of exploration programmes using a three-dimensional geological model - A case study
Z. Harris; F.A.S. Reyneke; R. K.W. Merkle; PW.J. Delport
Department of Geology, University of Pretoria, South Africa
SYNOPSIS
The technological advancements in computing power in the last 30 years have enabled the practical visualization of complex geological environments in three-dimensional (3D) space. 3D models and their application in the mining industry are becoming increasingly important, for example, to identify future exploration areas and targets, for mineral assessment and evaluation, and prediction and planning of future drill-holes. However, acquiring borehole data is an expensive practice, with drilling programmes costing mining companies up to billions of dollars each year. Tighter financial constraints on exploration budgets result in more pressure being put on three-dimensional models to accurately identify future target areas. This article aims to evaluate the potential drilling success of simulated greenfield and brownfield exploration using a 3D geological model created of Leeuwpoort tin mine. These simulations investigate the probability of intersecting a mineralized zone of economic interest and evaluate how the probability is affected when the number of drill-holes and distance from a known intersection changes. Furthermore, these simulations attempt to obtain an indication for the minimum number of drill-holes required for a successful exploration campaign at the mine. The investigation also aims to establish a first-pass attempt towards developing a 'favoured procedure' for identifying potential exploration targets for tin deposits with geological and geochemical characteristics similar to Leeuwpoort. The results for the 'favoured procedure' established are statistically tested using the 'bootstrapping' method. By simulating various exploration scenarios, the study also emphasises the importance of predicting successful drilling, which aids in budgeting for drilling programmes as the minimum number of drillholes needed for a specific exploration project can be determined.
Keywords: three-dimensional modelling, Leeuwpoort tin mine, bootstrapping, brownfield exploration, drilling simulation, exploration simulation.
Introduction
The technological advancements in computing power in the last 30 years have allowed the practical visualization of complex geological environments in three-dimensional (3D) space (Aug et al., 2005; Barnes and Gossage, 2014; Calcagno et al., 2008; Chilès et al, 2004; Cowan 2012; 2017; Cowan et al., 2002; Cowan, Spragg, and Everitt, 2011; Cowan, Lane, and Ross, 2004; Jessell, 2001; Jessell et al., 2014; Lemon and Jones, 2003; Mallet, 2002; McInerney et al. 2005; Royse, Rutter, and Enwisle, 2009; Singer, 1993; Wang et al., 2011; Wu and Xu, 2004; Wu, Xu, and Zou, 2005; Yan-lin et al., 2011; Zu et al., 2012). Multi-sourced attribute data such as mining, geological, ore deposit, financial, and grade-tonnage data can be used in computer software packages (Leapfrog Geo, Datamine, Minesight, GEMCOM etc.) to create reliable 3D models that accurately represent geological environments or settings (Bye, 2006; Wu and Xu, 2004; Zu et al., 2012).
3D models and their application in the mining industry are becoming increasingly important (Bye, 2006; Jessell et al., 2014), for example, to identify future exploration areas, drill-holes, and targets (Barnes and Gossage, 2014; Cowan, 2017; Jessell, 2001; Jessell et al. 2014; Srivastava, 2005; Wang et al., 2011; Whiting and Schodde 2006; Yan-lin et al., 2011). These geological models are relied on heavily for mineral assessment and evaluation (Barnes and Gossage 2014; Cowan 2012; Cowan, Spragg, and Everitt, 2011; Knight et al., 2007; Renard et al., 2013; Shehu and Lipo, 2016; Srivastava, 2005; Wang et al., 2011). Even though the process of 3D model building has been optimized, the accuracy, certainty, and overall quality of the models created are still dependent on factors such as data quality and modeller competency (Chiles et al., 2004; Cowan, 2017; Lindsay et al., 2013; Reid, 2017). The more complete the data used to create the 3D models, the more representative the models will be of the actual geological setting.
However, acquiring borehole data is an expensive practice (Benning, 2000) with drilling programmes costing mining companies up to billions of dollars each year (Benning, 2000; Schodde and Guj, 2012; Whiting and Schodde, 2006). Tighter financial constraints on exploration budgets result in more pressure being placed on 3D models to accurately identify future target areas.
Very recently Cowan (2017) stated that 'we still do not understand how to efficiently identify exploration targets within the near environment of a particular mineral deposit any better than we did prior to 2000'. This article aims to evaluate the potential drilling success of a simulated exploration programme using the existing 3D geological model of Leeuwpoort tin mine (Harris, 2018). These simulations investigate the probability of intersecting an economic tin lode and evaluate how the probability is affected when the number of drill-holes and distance from a known intersection point changes. Furthermore, the simulations attempt to obtain an indication of the minimum number of drill-holes required for a successful exploration campaign at the mine. The investigation also aims to establish a first-pass attempt towards developing a 'favoured procedure' for identifying potential exploration targets for tin deposits with similar geological and geochemical characteristics to Leeuwpoort. The results of the exploration simulations are statistically tested using the bootstrapping method (Rossi and Deutsch, 2013).
Leeuwpoort tin mine
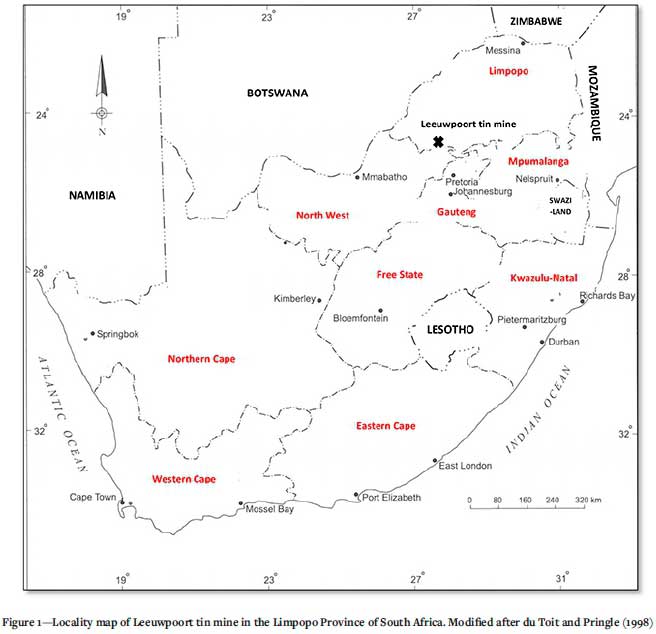
Leeuwpoort tin mine is situated in the Rooiberg tinfield, which is located on the western lobe of the Bushveld Complex, 60 km from the closest town, Bela-Bela (formerly Warmbaths), in the Limpopo Province of South Africa (Figure 1). Mining took place for 87 years. The orebody can be geologically classified into two distinct groups of lodes (Falcon. 1989; Hartzer. 1995; Labuschagne. 2004; Leube and Stumpfl. 1963a; Phillips 1982; Rozendaal, Misiewicz, and Scheepers, 1995; Rozendaal, Toros, and Anderson, 1986):
1. Flat-dipping bedded lodes (vein deposits) with an approximate thickness of 10-15 cm and an average dip of 8-15°. The bedded lodes are laterally extensive and form parallel to sub-parallel to the sedimentary bedding of the quartzites in the lower Boschoffberg Member, part of the Leeuwpoort Formation (Kent and Matthews 1980).
2. Steeply dipping fissure and faulted lodes (vein deposits) that have a variable thickness ranging from 1-20 cm and dips ranging from 45-90°.
These tin lodes were formed when ascending mineralized fluids moved from the underlying granites of the Lebowa Granite Suite through pre-existing fissure and faults created by the emplacement of the Bushveld Complex. At the time of mine closure in October 1993, 39 known tin lodes (22 bedded lodes and 17 fissure and faulted lodes) had been identified. Displacement of the lodes occurred due to the development of a complex faulting system after the formation of the tin deposits. Various normal and thrust faults developed omnidirectionally from the main Rooiberg thrust zone (Leube, 1960; Leube and Stumpfl, 1963b; Stumpfl and Leube, 1963).
Historical database
When the mine closed down, the only available electronic media was a 5-inch floppy disk containing the map catalogue. During the closure, some of the information was lost or misplaced, resulting in incomplete data for the exploration drill-holes such as missing survey, assay, lithological, and spatial data. The historical data consisted of:
1. Surface, underground, regional, geological, civil, and surveying maps
2. Old handwritten borehole logs stored in books and files, in some cases recorded in the imperial and/or metric systems.
During an extensive data recovery process, the data for 476 surface and 2402 underground boreholes was obtained along with all the 777 maps noted in the digital map catalogue. A digital catalogue was created for 14 106 peg positions recorded in surveyor logbooks. Extensive data validation and verification was conducted on the historical data, which was subsequently used to create a 3D geological model of the mine using Leapfrog Geo software (Harris, 2018). It is important to emphasise that the 3D geological model generated was created using limited historical data and that any estimations or simulations run from this model will introduce some uncertainty (Griffith 2007; Lindsay et al., 2013, 2012; Rossi and Deutsch, 2013; Thore et al., 2002).
Methodology
Identifying points of tin intersection
The first exploration simulation was designed to identify known points of tin intersections based on random drilling within a defined boundary of the 3D geological model. The following assumptions were made for the simulation:
1. We assume that exploration is required in a tinfield that was formed by the same geological conditions (geochemical and geophysical) as the study area - a stratigraphically and structurally controlled exogranitic hydrothermal process (Rozendaal, Misiewicz, and Scheepers, 1995; Rozendaal, Toros, and Anderson, 1986). This assumption may limit the applicability of the 'favoured procedure' established in this paper but could be used as the blueprint for further study on this topic.
2. The exploration simulation aims to identify the locations where the simulated drill-holes intersect an economic tin lode (tin lode of economic significance). This exploration test simulates greenfield exploration.
3. 500 random drill-holes (boreholes) will be simulated within a specified boundary. These simulated boreholes will be drilled vertically from the surface to a depth of 300 m and will henceforth be referred to as 'exploration phase 1'. Beyond 300 m there is no reliable geological information based on the 3D geological model.
4. The simulated drill-holes and all related information obtained are based on the 3D geological model of the mine.
Determining the confining boundary
It is necessary to confine the simulation to an area where sufficient information is available (Figure. 2). The simulation boundary encloses the historical mining area, which is also the area where the majority of the drill-holes used to create the three-dimensional geological model are located. The surface drill-holes have an average spacing of 100 m, whereas the underground drill-holes are on average 50 m apart. This means that the defined spatial boundary coincides with the drill-lhole boundaries of both the surface and underground drill-holes. Drill-holes that fall outside the central portion where the majority of the drill-holes are located were excluded because the distance between them is too large. Any correlation between these sets of drill-hole data will not lead to meaningful estimation because the data density is too low.
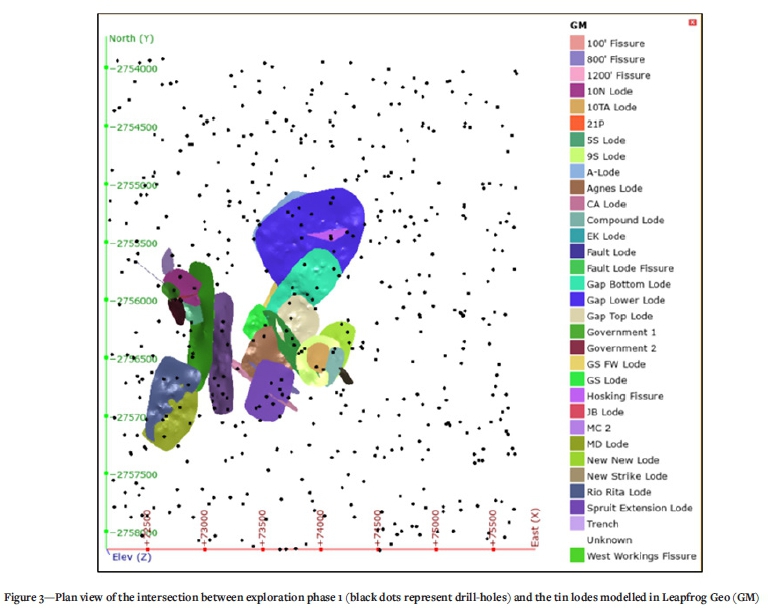
Generating the data for exploration phase 1
In order for the exploration simulation to be unbiased, the locations (x-, y-, and z-coordinates) of 500 drill-holes (exploration phase 1) were randomly generated using 'random functions' in Excel. The boundary limits were used as maximum and minimum coordinate values for the selected random coordinates to fall inside the boundary. Each drill-hole was given a unique name from PB1 to PB 500 (PB indicating planned borehole), a depth of 300 m, and a dip of 90°. These drill-holes were then imported into Leapfrog Geo as 'planned drill-holes' and evaluated against the existing 3D geological model in order to identify the location of known points of tin intersection (Figure. 3).
The exploration simulation indicated that of the 500 random drill-holes simulated (exploration phase 1), 83 drillholes intersected one or more economic tin lodes. This means that if greenfield exploration was conducted based on the 500 planned drill-holes, there would be a 16% chance of any particular drill-hole intersecting an economic tin lode within the selected boundary. This leads to the next question of the simulated exploration investigation: what is the probability of intersecting an economic tin lode a certain radial distance around a known point of intersection?
Application of a 3D model to brownfield exploration predictions
The second phase of the exploration simulation evaluates the probability of intersecting an economic tin lode using the known locations of the 83 economic intersections identified in exploration phase 1 as 'central points'. These are the central drillhole points from which the brownfield exploration simulation is conducted. The following assumptions were made:
1. We assume that brownfield exploration (Whiting and Schodde 2006) is required in a tinfield that formed under similar geological conditions (geochemical and geophysical) as the Leeuwpoort deposit.
2. The brownfield exploration simulation tests the probability of intersecting an economic tin lode, using known location points (identified in exploration phase 1). A constant area around each of the 83 drill-holes is used for the brownfield explorations to be consistent.
3. Five test drill-holes from exploration phase 1 (PB2, PB38, PB122, PB192, PB267) were selected randomly to establish the favoured procedure for the parameters to be applied to the rest of the identified economic drillholes. The 'favoured procedure' thus refers to the optimal parameters based on this case study, i.e. the historical data and 3D geological model. The following parameters were investigated:
(a) The effect of change in the constraining area on the probability of intersecting an economic lode was investigated by choosing areas of 1 ha, 10 ha, and 100 ha.
(b) 50 and 100 random drill-holes within the constraining area were simulated to test the effect of the number of drill-holes per constraining area.
(c) The number of iterations used for the bootstrapping statistical method. The effect of using different numbers of simulations during the bootstrapping analysis was evaluated for 10, 50, 100, 200, 500, 1 000, 2 000, 5 000, 7 000, 10 000, 20 000, 50 000, 100 000, and 1 000 000 iterations.
(d) The amount of resamples selected per bootstrap analysis. The effect of changing the number of drill-holes resampled from exploration phase 2 was investigated by using 20 and 40 samples.
Determining the constraining areas around each economic drill-hole
For the simulation to be consistent for each of the planned drill-holes (exploration phase 2), a consistent area must be used to constrain the brownfield exploration simulation around the location of the economic drill-holes identified in exploration phase 1 (central points). The second step is to investigate what effect changing the area will have on the probability of intersecting an economic tin lode within the specified confining area. Areas of 1 ha, 10 ha, and 100 ha were chosen for this investigation and were subsequently used to calculate the respective radii around each of the 'central points' for the five test drill-holes to remain consistent in the simulation. The radial distance around each central point can be defined as the 'constraining boundary'.
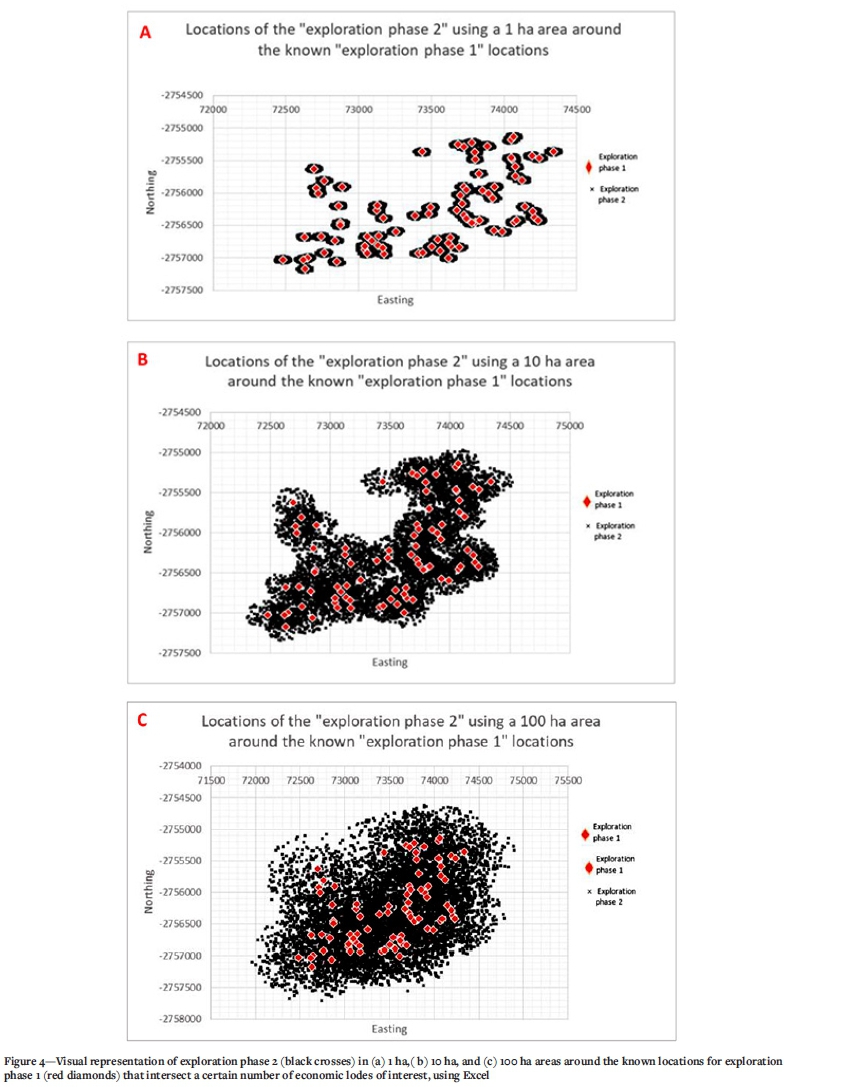
Generating drill-hole data for exploration phase 2
The second parameter investigated was the effect of having 50 or 100 simulated boreholes within the constraining boundary, and how this influenced the chance of intersecting an economic tin lode. For exploration phase 2 to be comparable to exploration phase 1, the drill-holes had to be randomly generated within the constraining boundary by using 'random functions' in Excel. The radial distance around each central point of 1 ha, 10 ha, and 100 ha (Figure. 4) was set as the boundary limit, which meant that the random coordinates generated for exploration phase 2 fell within the constraining boundary.
The drill-holes were simulated from surface vertically to a depth of 300 m, as this correlated to the depth of the deepest drillholes used to create the 3D geological model. The drill-holes for exploration phase 2 were imported into Leapfrog Geo as 'planned drill-holes' to evaluate the number of lodes intersected per drillhole using the existing 3D geological model.
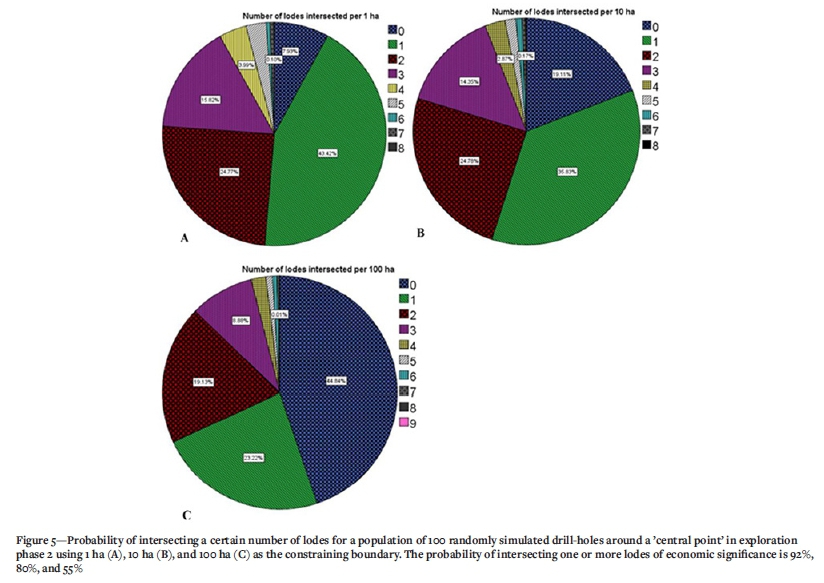
Determining the number of lodes intersected in Leapfrog Geo Evaluations were conducted in Leapfrog Geo to determine the number of tin lodes intersected per drill-hole for exploration phase 2 within constraining areas of 1 ha, 10 ha, and 100 ha. Descriptive statistical analysis (pie charts) of the number of lodes intersected within these constraining boundaries was conducted in IBM SPSS Statistics 23 (Figure. 5).
Statistical analysis of the brownfield exploration results using bootstrapping
The bootstrapping statistical method was used to analyse the results obtained in the brownfield exploration simulation. The statistical investigation will further determine what the effect on the probability will be if (1) the samples population is changed, and (2) the number of iterations used during bootstrapping changes.
Bootstrapping and resampling
The bootstrapping method is a resampling process that is repeated thousands of times to build a distribution that will most likely be Gaussian (Efron and Tibshirani, 1994; Good, 2006; Rossi and Deutsch, 2013). By resampling the original data multiple times, statistical inferences can be made about the population from which the data came (Curran-Everett. 2009; Grunkemeier and Wu. 2004; Simon. 1997; Simon and Bruce. 1991; Wilcox. 2010; Yu. 2003). Bootstrap analysis has become increasingly popular for hypothesis testing (Davidson and MacKinnon. 2000; Efron and Tibshirani. 1991) as it is considered to be a more thorough technique compared to other resampling methods such as jackknife, cross-validation, and randomization exact tests (Yu 2003). With the bootstrapping method, two types of resampling techniques are possible: sampling with replacement and sampling without replacement.
When a sample of a population has multiple chances to be selected it is referred to as sampling with replacement (Bardossy, Szabo, and Vaga, 2003; DiCiccio and Efron, 1996; Good, 2006; Grunkemeier and Wu, 2004; Olken and Rotem, 1986; Simon, 1997). However, when the sample has only one chance of being selected (zero per cent chance of reselection) from the population it is referred to as sampling without replacement (Horvitz and Thompson, 1952; Narain, 1951; Olken and Rotem 1986; Raj ,1956; Rao, Hartley, and Cochran, 1962; Sampford, 1967; Vitter, 1985; Yates and Grundy, 1953).
Sampling without replacement is used for the bootstrap analysis of the simulated brownfield exploration conducted on the 3D geological model. Because the drill-holes are randomly simulated within the constraining boundary around a central point, we assume that no hole was drilled (simulated) twice and that a drill-hole can therefore be selected only once during a resample.
Defining the parameters for the bootstrap simulation Before the bootstrap can be scripted, the simulation criteria need to be defined. The data generated in exploration phase 2 is resampled. The bootstrap simulation was conducted on the five test drill-holes identified in exploration phase 2: PB2, PB38, PB122, PB192, and PB262. The probability and standard deviation of each resampling event are recorded and analysed to determine which parameters are considered to be the 'favoured procedure' to use based on the historical data and 3D geological model.
Setting up the bootstrap simulation
The bootstrap simulation was created using V3.6.0 of the R software environment. R is a programming language and a software environment that is freely available and is widely used for statistical analysis and visualization. For data result visualization 'ggplot2' is used in conjunction with R to create graphs, in this case, to visualize the bootstrap results. A bootstrap simulation needed to be created for each of the five test boreholes where the change in the parameters discussed above can be evaluated. The full R source code can be downloaded from https://github.com/fas-r/BoreholeBootstrap.
Results and discussion
Effect of using 50 and 100 drill-holes
Two different sets of drill-holes were generated for exploration phase 2. In each case, 50 drill-holes and 100 drill-holes (Table I) were simulated within the confining boundaries (areas) to test the effect on the probability of intersecting an economic tin lode. For both bootstrap simulations, 20 and 40 samples were investigated, using 1000 iterations per bootstrap within a 1 ha confining area; the only difference is the number of drill-holes simulated. Table I indicates that the probability of intersecting an economic tin lode increases when a larger number of drill-holes are used within the confining area. In this instance, a higher chance of intersecting a tin lode can be expected when using 100 drill-holes per confining area. However, the probability of intersecting a tin lode seems to decrease for test drill-holes PB192 and PB267 when 100 simulated drill-holes are compared to 50 simulated drill-holes. This phenomenon can be ascribed to statistical noise, as these two test drill-holes are located within the sector where the majority of the tin lodes have been identified. The fluctuations of the probability and standard deviation values are due to the small number of iterations used for the bootstrap analysis.
Effect of changing the confining area
The chance of intersecting a tin lode is dependent on the size of the confining area. In order to test the effect of using 1 ha, 10 ha, and 100 ha (Table II) as a confining boundary around the central points, bootstrap simulations were conducted using 1000 iterations, 100 simulated drill-holes, with 20 samples and 40 samples per simulation. The number of iterations, sample size, and drill-holes remained constant with each bootstrap simulation; the only parameter that was changed was the confining area.
From the probability table (Table II) it becomes evident that the probability of intersecting a tin lode decreases with increasing area size (confining area) around the central points. The greater the distance around each central point, the smaller the chance of intersecting a tin lode since a larger area is now included in the confining area where tin lodes do not occur (see Figure 4 and 5).
The statistical effect of the different confining areas on the sample size selected for the bootstrap simulation (20 or 40 samples) should also be observed in the tables. One important aspect to note for this simulation is that even though the same bootstrap parameters were used (100 drill-holes, 1000 iterations, 1 ha confining area, 20 and 40 samples), a slight variation occurs for the results obtained for the probability and standard deviation. With each bootstrap simulation conducted, new samples are reselected for the simulation, which will result in a slight difference in the probability as each set of samples reselected will have different probabilities of intersecting an economic tin lode.
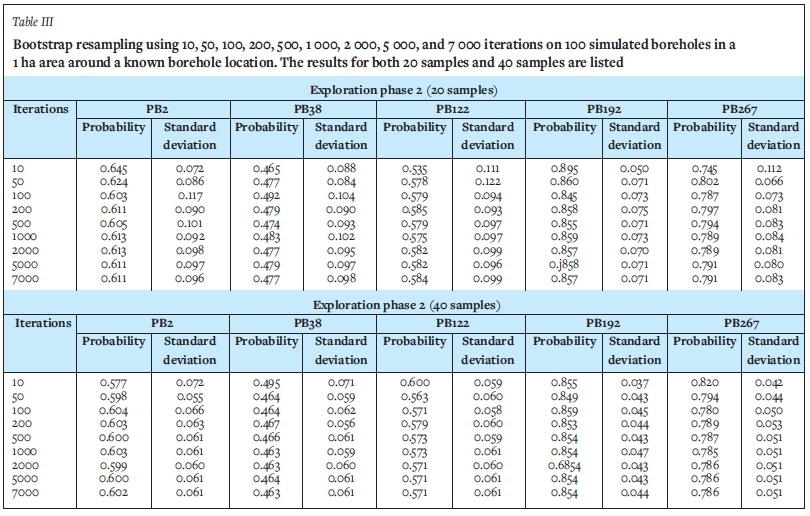
Effect of sample size and number of iterations in bootstrap simulations
The number of samples selected from the population and the number of iterations chosen influences the probability and, subsequently, the standard deviation. In the case of the bootstrap simulations conducted on the exploration simulation, 20 samples and 40 samples were investigated. For the bootstrap simulations, 100 drill-holes were simulated in a 1 ha confining area where 20 and 40 samples were randomly selected. The number of iterations per bootstrap simulation was changed to determine the effect on the probability of intersecting an economic tin lode. The results obtained using 10, 50, 100, 200, 500, 1 000, 2 000, 5 000, and 7 000 iterations are listed in Table III.
Bootstrap tests are dependent on a finite number of samples (Davidson and MacKinnon, 2000). In practice, thousands to tens of thousands of iterations are used during the bootstrap test as this minimizes any fluctuation in the results, generally smooths the data, and represents a more Gaussian distribution. Thus, the number of samples selected for resampling and the number of iterations used for the bootstrap simulation will depend on the data-set. When the bootstrap simulations were being set up, the general assumption was made that more samples selected from the population should yield a higher probability. However, the number of iterations used per bootstrap simulation needs to be considered as well. Consider test drill-hole PB2 (Table III). If 20 samples are selected from the population there is a 64% chance of intersecting a tin lode, whereas if 40 samples are selected the probability of intersecting a tin lode is 55%. In this instance, the probability decreased with an increase in samples selected per bootstrap analysis.
The decrease in the probability of intersecting an economic tin lode can be ascribed to more drill-holes falling outside the lode boundaries identified within the 3D geological model. In other words, more drill-holes have a higher chance of intersecting barren geology (containing no ore), especially if the random drill-hole is simulated off the modelled tin lode. It is generally expected that with an increase in the number of iterations, the fluctuations for the probability and standard deviation for the samples will smooth out. The use of fewer iterations for the bootstrap simulation will result in more variability in the data (standard deviation).
The fluctuation noted in the probability and standard deviation for the 20 and 40 samples selected indicates that an inadequate number of iterations were used. To determine the minimum number of iterations needed to minimize the variation in the data, 10 000, 20 000, 50 000, 100 000, and a million iterations were tested using 40 samples reselected from the 100 drill-holes simulated in exploration phase 2 within a 1 ha confining area around the central points for the bootstrap simulations (see Table IV). For these simulations, 40 samples were selected instead of 20 samples from the population, as the results indicated that 40 samples lowers the variability of the data, and also generally increases the probability. The study found that for a greater number of iterations, the variability decreases, as is evident by the reduction in the fluctuation of both the probability and standard deviation for the five test drill-holes.
To finally determine the minimum number of iterations needed to conduct a bootstrap simulation using the 3D model, the point where a negligible change took place in fluctuation in the variability needed to be determined. A summary of all the bootstrap simulations conducted on the five test drill-holes of exploration phase 2 is given in Table V. Variability graphs for PB2, PB38, PB122, PB192, and PB267 (Figure. 6) were constructed by plotting the probability of intersecting an economic tin lode for these samples against the number of iterations used (using a logarithmic scale). The fluctuation in the variability as a factor of the number of iterations can now be graphically viewed to help determine where the data is sufficiently smoothed to have minimal fluctuation in the bootstrap analysis. These graphs indicate that the minimum number of iterations needed to conduct a bootstrap simulation is 2000 iterations.
Defining the 'favoured procedure'
One of the main aims of these simulations was to establish a 'favoured procedure' for bootstrap simulations conducted at Leeuwpoort tin mine; in other words, the optimal parameters that are best suited for a statistical analysis applicable to the mine. From the multiple bootstrap simulations conducted, the following points were determined:
1. When choosing the number of drill-holes needed for the bootstrap simulation to determine the probability of intersecting a tin lode, a larger sample size is favourable.
For this case study, 100 simulated drill-holes have a higher chance of intersecting a tin lode than 50 drill-holes.
2. The confining boundary (area) used for the bootstrap simulation conducted for each of the drill-holes identified in exploration phase 2 around the central points must be constant in order to be able to compare the results. The optimal confining area to conduct the bootstrap analysis is 1 ha rather than 10 ha and 100 ha because a 1 ha confining area results in a higher probability of intersecting a tin lode.
3. For the tested bootstrap simulations, 20 samples and 40 samples were selected from the population. The results indicate that the variability decreases with an increasing number of samples selected. For this case study, 40 samples give better probability results with less variability.
4. The extensive bootstrap tests run on exploration phase 2 indicate that a greater number of iterations reduces variation in the data for this data-set. In the case study, a million iterations was used to test the smoothing effect of bootstrapping to the extreme. The number of iterations required to reduce variation is dependent on the data used for the bootstrap analysis. The case study found that variation is reduced at 2 000 iterations for the data obtained during the bootstrap analysis. Statistically, 2 000 iterations should be considered to be the minimum amount. The recommended number of iterations is 100 000, just to reduce computational time, and because there is no notable statistical difference between using 100 000 and a million iterations.
Conclusions
Exploration is crucial for any mining venture, whether it is greenfield exploration or brownfield exploration. This case study aimed to evaluate the potential success of greenfield and brownfield exploration drilling using the three-dimensional geological model of Leeuwpoort tin mine. For the first exploration simulation, 83 (16%) of the 500 randomly simulated drill-holes intersected an economically significant lode. These drill-holes were then used as central points, around each of which 100 drill-holes were simulated to establish 'exploration phase 2' as part of the brownfield exploration simulation.
The overall probability of intersecting a tin lode for exploration phase 2 is calculated at 92% (Figure. 5). However, the distribution of the probability is positively skewed for exploration phase 2, which gave rise to various bootstrap simulations conducted for the distribution to resemble a more Gaussian distribution. The bootstrap simulations aimed to establish a first-pass attempt at developing a 'favoured procedure' for the parameters used in this case study that would result in a small amount of variability. The favoured procedure was established by investigating the effect of changes in the number of simulated drill-holes, constraining boundary, bootstrap sample size, and number of iterations based on the probability of intersecting a tin lode determined in exploration phase 2.
From the statistical analysis of the exploration simulation, the optimal statistical parameters that should be used to identify future exploration targets in the case study area are 100 simulated drill-holes within a 1 ha constraining boundary (area) of the known location point of a drill-hole that intersects a tin lode, using 100 000 iterations for the bootstrap simulation with 40 samples selected from the population without replacement.
The exploration simulations conducted on the 3D geological model concluded that potential exploration projects could be simulated successfully and that 3D models can be used to identify future mining targets. However, it is important to note that 3D models cannot be considered to be 100% accurate; any 3D geological model created is subject to uncertainty and variability because the models are dependent on the quality of the data, and are also dependent on the interpretation by the geologist that creates the model.
The paper is intended to illustrate a first attempt on the approach to determining the probability of success in exploration drilling rather than a generalized procedure or best practice method. These parameters could potentially be used for future brownfield exploration to identify potential mining targets comprising ore deposits that have the same geological and geochemical characteristics as those of Leeuwpoort tin mine. However, these estimations cannot be accepted as accurate without knowing the geochemical and geophysical heterogeneity of the orebody. Nonetheless, this case study can be used for the prediction of successful drilling and can aid in budgeting for drilling programmes because the minimum number of drill-holes needed can be determined.
The 'favoured procedure' parameters identified for the statistical analysis of the historical data using bootstrap simulations indicate that the potential exploration success can be evaluated by simulating various parameters such as the number of drill-holes required in a confined area. However, in order to develop a generally applicable approach, or for our findings to be transferable to other mineralized areas of similar type, a broader base of similar studies is required.
Computer code availability
Name of code: BoreholeBootstrap
Developer: F.A.S. Reyneke
Contact email: stephan.reyneke7@gmail.com; zandri.harris27@gmail.com
Telephone number: +27 82 462 4311; +27 83 707 9501
Year first available: 2020
Hardware requirements: At least 2 GHz or faster processor, 4 GB RAM, and 1 GB of free hard disk space to store results. A faster machine is recommended if available to speed up bootstrap analysis time.
Software requirements: R version 3.6.0 with the 'ggplot2' package installed. The script automatically installs this package.
Program language: R
Program size: 10.1 KB
Source code:
To access the source code, navigate to the following GitHub repository: https://github.com/fas-r/BoreholeBootstrap Click on the 'Clone or download' button, and select 'Download ZIP'. The source code is now downloaded to your machine. Open the README.md file in a text editor application (such as Notepad) for usage and test instruction information.
Compliance with ethical standards
Funding: No funding was received for the research conducted for this article.
Conflict of interest: The authors declare that they have no conflict of interest.
References
Aug, C., Chiles, J-P., CouRRioux, G., and Lajaunie, C. 2005. 3D geological modelling and uncertainty: The potential-field method. Proceedings of Geostatistics Banff 2004. Springer. pp. 145-154. [ Links ]
Bardossy, G., Szabo, I., and Varga, G. 2003. A new method of resource estimation for bauxite and other solid mineral deposits. Berg Und Huttenmannische Monatshefte, vol. 148. pp. 57-64. [ Links ]
Barnes, J and Gossage, B. 2014. The dos and don'ts of geological and grade boundary models and what you can do about it. Mineral Resource and Ore Reserve Estimation: The AusIMM Guide to Good Practice. Australasian Institute of Mining and Metallurgy, Melbourne. pp. 75-188. [ Links ]
Benning, I. 2000. Bankers' perspective of mining project finance. Journal of the South African Institute of Mining and Metallurgy. vol. 100. pp. 145-152. [ Links ]
Bye, A. 2006. The strategic and tactical value of a 3D geotechnical model for mining optimization, Anglo Platinum, Sandsloot open-pit. Journal of the Southern African Institute of Mining and Metallurgy, vol. 106. pp. 97-104. [ Links ]
Calcagno, P., Chiles, J-P., Courrioux, G., and Guillen, A. 2008. Geological modelling from field data and geological knowledge: Part I. Modelling method coupling 3D potential-field interpolation and geological rules. Physics of the Earth and Planetary Interiors, vol. 171. pp. 147-157. [ Links ]
Chiles, J-P., Aug, C., Guillen, A., and Lees, T. 2004, Modelling the geometry of geological units and its uncertainty in 3D from structural data: the potential-field method. Proceedings of the International Symposium on Orebody Modelling and Strategic Mine Planning, Perth, 23-24 November. Australasian Institute of Mining and Metallurgy, Melbourne. p. 24. https://www.researchgate.net/publication/237449268_Modelling_the_Geometry_of_Geological_Units_and_its_Uncertainty_in_3D_From_Structural_Data_The_Potential-Field_Method [ Links ]
Cowan, E. 2012. The deposit model paradox. Structural Geology and Resources 2012. Extended Abstracts Volume. Vearncombe, J. (ed.). Australian Institute of Geoscientists Bulletin, vol. 56. pp. 48-49. [ Links ]
Cowan, E. 2017. Why can't we interpret near-mine drilling data effectively? Proceedings of Mineral Exploration 2017. Extended Abstracts Volume. Australian Institute of Geoscientists. http://www.orefind.com/docs/default-source/orefind-research-papers-in-pdf/Cowan_2017_AIG.pdf [ Links ]
Cowan, E., Beatson, R., Fright, W., McLennan, T., and Mitchell, T. 2002. Rapid geological modelling.. Applied Structural Geology for Mining Exploration and Mining. http://www.orefind.com/docs/orefind-research-papers-in-pdf/rapid_geological_modelling.pdf [ Links ]
Cowan, E., Spragg, K., and Everitt, M. 2011. Wireframe-free geological modelling - An oxymoron or a value proposition? Proceedings of the Eighth International Mining Geology Conference. Australasian Institute of Mining and Metallurgy, Melbourne. pp. 247-260. [ Links ]
Cowan, .EJ., Lane, R.G., and Ross, H.J. 2004. Leapfrog's implicit drawing tool: A new way of drawing geological objects of any shape rapidly in 3D. Bulletin, no. 41. Australian Institute of Geoscientists. pp. 23-25. https://www.researchgate.net/publication/303917795_Leapfrog's_implicit_drawing_tool_A_new_way_of_drawing_geological_objects_of_any_shape_rapidly_in_3D/link/575d630c08aed8846216382b/download [ Links ]
Curran-Everett, D. 2009. Explorations in statistics: The bootstrap. Advances in Physiology Education, vol. 33. pp. 286-292. [ Links ]
Davidson, R. and MacKinnon, J.G. 2000. Bootstrap tests: How many bootstraps? Econometric Reviews, vol. 19. pp. 55-68. [ Links ]
DiCiccio ,T.J. and Efron, B. 1996. Bootstrap confidence intervals. Statistical Science, vol. 11, no. 3. pp. 189-212. https://doi.org/10.1214 [ Links ]
Du Toit, M. and Pringle, I. 1998. Tin. The Mineral Resources of South Africa. Handbook 16. Council for Geoscience, Pretoria. pp. 613-620. [ Links ]
Efron, B, and Tibshirani, R. 1991. Statistical data analysis in the computer age. Science, vol. 253. pp. 390-395. [ Links ]
Efron, B. and Tibshirani, R.J. 1994. An Introduction to the Bootstrap. CRC Press. [ Links ]
Falcon, L. 1989. Tin in South Africa. Journal of the South African Institute of Mining and Metallurgy, vol 89. pp. 59-72. [ Links ]
Good, P.I. 2006. Resampling Methods. Springer. [ Links ]
Griffith A. 2007. SPSS for Dummies. Wiley. [ Links ]
Grunkemeier, G.L., and Wu, Y. 2004. Bootstrap resampling methods: Something for nothing? Annals of Thoracic Surgery, vol. 77. pp. 1142-1144. [ Links ]
Harris, Z. 2018. A three-dimensional model for the Leeuwpoort tin mine and its application to exploration prediction. MSc dissertation, University of Pretoria. [ Links ]
Hartzer, F. 1995. Transvaal Supergroup inliers: Geology, tectonic development and relationship with the Bushveld Complex, South Africa. Journal of African Earth Sciences, vol. 21.:pp. 521-547. [ Links ]
Horvitz, D.G. and Thompson, D.J. 1952. A generalization of sampling without replacement from a finite universe. Journal of the American Statistical Association, vol. 47. pp. 663-685 [ Links ]
Jessell, M. 2001. Three-dimensional geological modelling of potential-field data. Computers & Geosciences, vol. 27. pp. 455-465. [ Links ]
Jessell M., Aillères. L., de Kemp, E., Lndsay, M., Wellmann, F., Hillier, M., Laurent, G., Carmichael, T., and Martin, R. 2014. Next-generation three-dimensional geologic modelling and inversion. Special Publication no. 18. Society of Economic Geologists. pp. 261-272. [ Links ]
Kent, L. and Matthews, P. 1980. Stratigraphy of South Africa. Part 1. [ Links ]
Lithostratigraphy of the Republic of South Africa, South West Africa/Namibia, and the Republics of Bophuthatswana, Transkei and Venda. Handbook 8. Geological Survey of South Africa, Pretoria. 690 pp. [ Links ]
Knight, R., Lane, R., Ross, H., Abraham, A., and Cowan, J. 2017. Implicit ore delineation. Exploration 07. Proceedings of the Fifth Decennial International Conference on Mineral Exploration, Toronto, 9-12 September 2007. Milkereit, B. (ed.). Decennial Mineral Exploration Conferences, Toronto. pp. 1165-1169. [ Links ]
Labuschagne, L.S. 2004. Evolution of the ore-forming fluids in the Rooiberg tin field, South Africa. Council for Geoscience, Pretoria. [ Links ]
Lemon, A.M. and Jones, N.L. 2003. Building solid models from boreholes and user-defined cross-sections. Computers & Geosciences, vol. 29. pp. 547-555. [ Links ]
Leube, A. 1960. Structural control in the Rooiberg Tin-fields, South Africa. Transactions of the Geological Society of South Africa, vol. 63. pp. 265-282, [ Links ]
Leube, A. and Stumpfl, E. 1963a. The Rooiberg and Leeuwpoort tin mines, Transvaal, South Africa. Economic Geology, vol. 58. pp. 527-557. [ Links ]
Leube, A. and Stumpfl, E. 1963b. The Rooiberg and Leeuwpoort tin mines, Transvaal, South Africa; Part I, General and structural geology. Economic Geology, vol. 58.pp.. 391-418. [ Links ]
Lindsay, M., Jessell, M.W., Ailleres, L., Perrouty, S., de Kemp, E., and Betts, P.G. 2013. Geodiversity: Exploration of 3D geological model space. Tectonophysics, vol. 594. pp. 27-37. [ Links ]
Lindsay, M., Jessell, M.W., Ailleres, L., Perrouty, S., de Kemp, E., and Betts, P.G. 2013. Geodiversity: Exploration of 3D geological model space. Tectonophysics, vol. 594. pp. 27-37 . [ Links ]
Lindsay, M.D., Ailleres, L., Jessell, M.W., de Kemp, E.A., and Betts, P.G. 2012. Locating and quantifying geological uncertainty in three-dimensional models: Analysis of the Gippsland Basin, southeastern Australia. Tectonophysics, vol. 546. pp. 10-27. [ Links ]
Mallet, J-L. 2002. Geomodeling. Oxford University Press. [ Links ]
McInerney, P., Guillen, A., Courrioux, G., Calcagno, P., and Lees, T. 2005. Building 3D geological models directly from the data? A new approach applied to Broken Hill, Australia. Open-File Report 1428. US Geological Survey. pp. 119-130. [ Links ]
Narain, R. 1951. On sampling without replacement with varying probabilities. Journal of the Indian Society of Agricultural Statistics, vol. 3. pp. 169-174. [ Links ]
Olken, F. and Rotem, D. 1986. Simple random sampling from relational databases. https://www.vldb.org/conf/1986/P160.PDF [ Links ]
Phillips. A.H. 1982. The geology of the Leeuwpoort tin deposit and selected aspects of its environs. MSc thesis, University of Pretoria. [ Links ]
Raj, D. 1956. A note on the determination of optimum probabilities in sampling without replacement. Sankhyä: The Indian Journal of Statistics (1933-1960), vol. 17. pp. 197-200. [ Links ]
Rao, J.N., Hartley, H., and Cochran, W. 1962. On a simple procedure of unequal probability sampling without replacement. Journal of the Royal Statistical Society: SeriesB (Methodological). vol. 24. pp.482-491 [ Links ]
Reid, R. 2017. Implicit modelling disasters in the making - Part 1. https://www.linkedin.com/pulse/implicit-modelling-disasters-making-part-1-ron-reid. [ Links ]
Renard, D., Wagner, L., Chiles, J-P., Vann, J., and Deraisme, J. 2013. Modeling the geometry of a mineral deposit domain with a potential field. Proceedings of the 36th APCOM Symposium on the Applications of Computers and Operations Research in the Mineral Industry, Porto Alegre, Brazil, 4-8 November 2013. Costa, J.F. Koppe, J., and Peroni, R. (eds). Fundaçâo Luiz Englert, Porte Alegre. pp. 21-39. [ Links ]
Rossi, M.E. and Deutsch, C.V. 2013. Mineral Resource Estimation. Springer Science & Business Media. [ Links ]
Royse, K., Rutter, H., and Entwisle, D. 2009. Property attribution of 3D geological models in the Thames Gateway, London: New ways of visualising geoscientific information. Bulletin of Engineering Geology and the Environment, vol. 68. pp. 1-16. [ Links ]
Rozendaal, A., Misiewicz, J., and Scheepers, R. 1995. The tin zone: Sedimenthosted hydrothermal tin mineralization at Rooiberg, South Africa. Mineralium Deposita, vol. 30. pp. 178-187. [ Links ]
Rozendaal, A., Toros, M., and Anderson, J. 1986. The Rooiberg tin deposits, west-central. Transvaal Mineral Deposits of Southern Africa,. vol, 2. Anhaeusser, C.R. and Maske, S. (eds). Geological Society of South Africa, Johannesburg. pp. 1307-1328. [ Links ]
Sampford, M. 1967. On sampling without replacement with unequal probabilities of selection. Biometrika, vol. 54. pp. 499-513. [ Links ]
Schodde, R. and Guj, P. 2012. Where are Australia's mines of tomorrow? AusIMM Bulletin, vol. 2013, no. 3. pp. 76-82 [ Links ]
Shehu, A. and Lipo, S. 2016. 3D modeling and interpretation of Fe/Ni deposit in Skroska mine using Micromine. Albanian Journal of Natural and Technical Sciences, vol. XXI. pp. 47-60. [ Links ]
Simon, J.L. 1997. Resampling: The New Statistics. Resampling Stata, Arlington, VA. [ Links ]
Simon, J.L. and Bruce, P. 1991. Resampling: A tool for everyday statistical work. Chance, vol. 4. pp. 22-32. [ Links ]
Singer, D.A. 1993. Basic concepts in three-part quantitative assessments of undiscovered mineral resources. Nonrenewable Resources, vol. 2. pp. 69-81. [ Links ]
Srivastava, R.M. 2005. Probabilistic modelling of ore lens geometry: An alternative to deterministic wireframes. Mathematical Geology, vol. 37. pp. 513-544. [ Links ]
Stumpfl, E. and Leube, A. 1963. The Rooiberg and Leeuwpoort tin mines, part 2: Petrology, mineralogy and geochemistry. Economic Geology, vol. 58. pp. 527-557. [ Links ]
Thore, P., Shtuka, A., Lecour, M., Ait-Ettajer, T., and Cognot, R. 2002. Structural uncertainties: Determination, management, and applications. Geophysics, vol. 67. pp. 840-852. [ Links ]
Vitter, J.S. 1985. Random sampling with a reservoir. ACM Transactions on Mathematical Software (TOMS), vol. 11. pp. 37-57. [ Links ]
Wang, G., Zhang, S., Yan, C., Song, Y., Sun, Y., Li, D., and Xu, F. 2011. Mineral potential targeting and resource assessment based on 3D geological modelling in Luanchuan region, China. Computers & Geosciences, vol. 37. pp. 1976-1988. [ Links ]
Whiting, T. and Schodde, R. 2006. Why do brownfields exploration? Proceedings of the International Mine Management Conference, Melbourne, 16-18 October 2006. Austalasian Instirute of Mining and Metallurgy, Melbourne. [ Links ]
Wilcox, R.R. 2010. Fundamentals of Modern Statistical Methods: Substantially Improving Power and Accuracy. Springer. [ Links ]
Wu, Q. and Xu, H. 2004. On three-dimensional geological modelling and visualization. Science in China Series D: Earth Sciences, vol. 47. pp. 739-748. [ Links ]
Wu, Q., Xu, H., and Zou, X. 2005. An effective method for 3D geological modelling with multi-source data integration. Computers & Geosciences, vol. 31. pp. 35-43. [ Links ]
Yan-lin, S., Ai-ling, Z., You-bin, H., and Ke-yan, X. 2011. 3D geological modelling and its application under complex geological conditions. Procedia Engineering, vol. 12. pp. 41-46. [ Links ]
Yates, F. and Grundy, P.M. 1953. Selection without replacement from within strata with probability proportional to size. Journal of the Royal Statistical Society: Series B (Methodological), vol. 15. pp. 253-261. [ Links ]
Yu, C.H. 2003. Resampling methods: concepts, applications, and justification. Practical Assessment, Research & Evaluation, vol. 8. pp. 1-23. [ Links ]
Zu, X.F., Hou, W.S., Zhang, B.Y., Hua, W.H., and Luo, J. 2012. Overview of three-dimensional geological modelling technology. IERI Procedia, vol. 2. pp. 921-927. [ Links ]
 Correspondence:
Z. Harris
Email: zandri.harris27@gmail.com
Received: 25 Jun.2020
Revised: 26 Feb. 2021
Accepted: 12 Dec. 2021
Published: February 2022

