


Services on Demand
Article
 English (pdf)
 Article in xml format
 Article references
Indicators

Related links
-
 Cited by Google
 -
 Similars in Google
Share

 Permalink
Journal of the Southern African Institute of Mining and Metallurgy
On-line version ISSN 2411-9717
Print version ISSN 2225-6253
J. S. Afr. Inst. Min. Metall. vol.121 n.11 Johannesburg Nov. 2021
http://dx.doi.org/10.17159/2411-9717/1150/2021
ARTICLES
http://dx.doi.org/10.17159/2411-9717/1150/2021
Comparison of normalized and non-normalized block caving comminution models
R. GómezI; R. CastroII, III; F. BetancourtI; M. MoncadaI
IDepartment of Metallurgical Engineering, University of Concepción, Concepción, Chile. ORCID: R. Gómez: https://orcid.org/0000-0003-4273-0522
IIAdvanced Mining Technology Center, University of Chile, Santiago, Chile
IIIDepartment of Mining Engineering, University of Chile, Santiago, Chile
SYNOPSIS
In block cave mining, rock fragmentation is a key parameter that influences the production level design and mine planning. Fragmentation occurs mainly by natural breakage during the caving process and in the draw column. The breakage that occurs within the column is known as secondary fragmentation. Secondary fragmentation has been successfully described using the block caving comminution model, which replicates the fragmentation mechanics between particles under drawn and vertical loads in a draw column. This model is based on a kinetic and population balance approach, in which non-normalized and normalized assumptions can be used depending on material and comminution system behaviour. In this paper, the non-normalized and normalized approaches are applied and compared to laboratory data to determine which assumption should be used for secondary breakage in block caving. Approaches are compared graphically, with the mean square error and the Fisher test with a false-rejection probability of 0.05. Based on a statistical analysis, the results show that the normalized model can be applied to all the rock types tested.
Keywords: block caving, breakage, comminution, mass balance, secondary fragmentation, modelling.
Introduction
The block caving method has been widely used in the mining industry for over 30 years. In this process, three stages can be identified: in-situ fragmentation, and primary and secondary fragmentation. The rock size obtained after secondary fragmentation has a strong influence on design stages, ore extraction and haulage, and mineral processing (Laubscher, 1994, 2000; Eadie, 2003; Brown, 2004). Particularly, in cave mining, the process is also influenced by the geometry of draw zones, which defines the drawpoint spacing, draw control, rate of draw, and secondary breakage (Laubscher 1994; Kurniawan and Setyoko, 2008). During ore draw, the rock fragment size can cause operational problems such as hangups, oversized material, fine material migration, inrush of fines, and mudrush events. These are some of the main reasons to study and estimate the rock fragmentation in block caving mines.
During block caving, fragmentation of the ore column occurs mainly by natural breakage induced by mining or by blasting applied in the base of the ore column from the undercut level or production level (Paredes et al., 2020 ). Additionally, preconditioning can be used to create new fractures or expand existing ones by hydraulic fracturing, confined blasting, or both. However, the fragmentation of the ore occurs mainly during caving and ore draw.
Fragmentation takes place in three stages. in-situ fragmentation is the natural fragmentation in the rock mass prior to mining activity, and which can be modified using preconditioning (Brzovic et al., 2016). Primary fragmentation occurs during caving, where the rock around the cave back is fragmented and then falls. Secondary fragmentation occurs in the broken column during draw and is the last stage of fragmentation before extraction at the drawpoint. In this stage the rock fragmentation is due mainly to compression and abrasion (splitting and attrition). Some authors also include impact fragmentation, which is highly influenced by the air gap height, as a mechanism of secondary fragmentation (Laubscher, 2000; Brown 2004; Pierce, Weatherley, and Kojovic, 2010; Dorador, 2016).
The breakage of the granular material under stress depends on various factors such as particle size distribution (PSD), particle shape, the state and trajectory of effective stresses, void ratio, material strength, presence of water, and extraction rate (Hardin, 1985; Brown, 2004; Liu et al., 2018). Among these factors, strength is one of the most relevant. Low rock strength implies early breakage of the rock block under a stress arch (Laubscher, 2000). Conversely, increasing strength decreases the amount of fragment breakage under a given stress (Lade, Yamamuro, and Bopp, 1996). Similarly, for an individual block, it is well known that strength decreases as size increases (Brady and Brown, 2004; Cundal, Pierce, and Mas Ivars, 2008). Particularly in block caving, where large volumes of rock are common, rock strength is a consequence of the intact rock strength, the presence of discontinuities, and the deformation capacity (Brady and Brown, 2004). Dorador (2016) observed that rock strength has more influence on fragmentation than parameters such as shape and size distribution. On the other hand, it has been reported that the strength ratio between large and small blocks plays an important role in crushing (McDowell and Bolton, 1998; Wood and Maeda, 2008). Furthermore, strength has been shown to decrease in the presence of moisture, as seen during crushing tests on individual particles (Manso, Marcelino, and Caldeira, 2021). An explanation for this phenomenon is that the infiltration of water into microcracks increases the pressure on the rock, facilitating its rupture (Miura and Yamanouchi, 1975; Lee and Farhoomand, 1967; Lee and Coop 1995).
In terms of material shape, angular particles suffer greater breakage than rounded or cubic ones of equal size and under similar levels of stress (Lee and Farhoomand, 1967; Dorador, 2016). This behaviour is explained by the load concentration in small areas of the particles, increasing the stress and facilitating fracture (Lade, Yamamuro, and Bopp, 1996). Another possible explanation is that angular particles fracture preferentially by abrasion (breaking of the edges), while rounded ones fracture by compression, presenting a greater apparent resistance (Nakata et al., 1999).
Breakage is also affected by fine material transported through the extraction column via the voids between the larger blocks, with fines more concentrated towards the base of the mineral column (Hashim, Sharrock, and Saydam, 2008; Dorador et al., 2014). This fine material imparts a cushioning effect to the coarse material, thus reducing the degree of breakage (Brown, 2004). Such a phenomenon occurs because the presence of fine material prevents direct contact between coarse blocks, increasing the number of contacts and reducing their probability of breakage by avoiding a high concentration of stresses in a small area of the block (McDowell, 2002).
The extraction rate determines the residence time of a block in the column of broken material. Increasing the extraction rate decreases the magnitude of the shear stresses, thus reducing fragmentation (Sainsbury, 2010). At low extraction rates, fracturing of the material depends on the effective time during which it is under stresses associated with caving and/or under arc conditions (Laubscher, 2000). Another relevant aspect in fragmentation is material transport through the ore pass. The impact of the distance travelled during transfer through the ore pass has been quantified - Landriault (2001) cites a 78% decrease in the average size (d50after travelling 257 m. A similar result was obtained in Brunswick and Kidd Creek mines, where the maximum particle size was reduced by 50% after travelling 300 m of vertical distance (Yu, 1989).
Various models can be used to estimate the fragmentation in block caving, in particular the secondary fragmentation reported as the final fragmentation at the drawpoint (e.g. Merino, 1986; Nicholas and Srikant, 2004; Esterhuizen, 2005; Pierce, 2009; Rogers et al., 2010 ; Dorador, 2016; Gómez et al., 2017). The Block Cave Fragmentation (BCF) Model (Esterhuizen, 2005) is probably the most widely used in industry. This approach estimates primary and secondary fragmentation based on empirical rules. The REBOP (Rapid Emulation based on PFC) secondary fragmentation model is based on Bridgewater's attrition model (Bridgewater et al., 2003 ). Srinkant and Rachmandl (2004) combined CoreFrag2 (to estimate primary fragmentation) and BCF (for secondary fragmentation), obtaining good results in medium and coarse sizes (d50 and d80). Dorador (2016) divided the broken column into a far field, characterized by plug flow, and a near field, characterized by mixed flow, to estimate secondary fragmentation. In the Block Caving Comminution Model (Gómez et al., 2017), the rock flow is simulated considering compression and abrasion, the main fragmentation mechanisms during secondary fragmentation, and is validated through experiments. In this work we extend the model by Gómez et al. (2017) by studying a hypothesis about the model and performing experiments with different types of rock. An example in which the extended model is applied to real data is given In the Appendix.
Block Caving Comminution Model
Block caving is widely used in massive underground mining because of the high production rates and low operational costs. With this method, rock fragmentation occurs naturally during ore extraction while caving propagates to the surface. Thus, fragmentation is determined mainly by rock mass properties, stress fields, and draw policies. Here we focus our analysis on a model used to estimate the secondary fragmentation presented as the Block Caving Comminution Model (BCCM) (Gómez et al., 2017).
The BCCM in its batch version is determined by the following mass conservation equation:
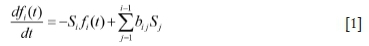
where fi is the solid mass fraction of size interval i, Si is breakage velocity of the ith interval, and byis the breakage function and represents the fraction of the primary breakage product of material in the jthinterval, which appears in the zith interval after fragmentation. Extraction in block caving is a continuous process that is usually modelled by plug flow. Then, incorporating this plug flow assumption in Equation [1] and using the Reid solution for the batch population balance (Reid, 1965), we obtain
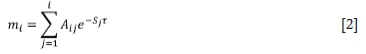
where miis the mass in the zith interval, t is the residence time and Aij is given by
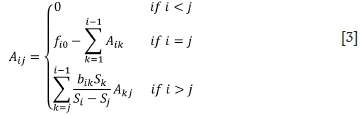
where fi0 is the initial particle size distribution.
In order to compute Equation [2] it is necessary to know the values of the functions Bij and Sj- The common way to determine these functions is by assuming a constitutive parametric form and performing a back-calculation from experimental data (Klimpel and Austin, 1977). In this work we consider for Sjthe parametric expression proposed by Herbst and Fuertenau (1980) and later modified by Gómez et al. (2017):
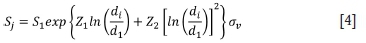
Here Z1 and Z2 are parameters depending on the material properties, and ovis a variable that represents the mean vertical load. It is common to use the cumulative fraction of breakage product Bij = (instead of bij) as bij = Bij-Bi+1j, the so-called normalized expression for Bij is given by
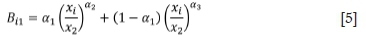
where a1, a2, and a3 are model parameters (0 < a1 < 1; a2 < a3), is the mesh size for the ith interval, and x2, which corresponds to the second mesh size interval, is the normalizing parameter. We remark that in the normalized expression Equation [5], it is assumed that all particles have a rupture distribution with dimensional similarity.
The non-normalized model raises this hypothesis, which is given by the expression (Austin and Luckie, 1972):
where
and δ is a new parameter to be adjusted (δ > 0) for 0 < aj< 1. For I >j, it must be noted that the normalized expression presented in Equation [5] is a simplified case of Equation [6] when δ = 0 and xj= x2. According to the constitutive expressions selected in this work, the back-calculation method yields a nonlinear optimization problem with six parameters (S1E, Z1, Z2, a1, a2, a3) in the normalized framework and seven parameters (S1E, Z1, Z2, a1, a2, a3 ò) in the non-normalized framework.
In milling processes, normalized models are typically suitable (Austin and Concha, 1994), but in the block caving process the normalization of the model has not been studied. The aim of this paper to compare the normalized and non-normalized models using statistical analysis of a variety of rock types to identify which approach should be used with block caving methods.
Methodology
Laboratory set-up
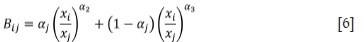
The confined flow model set-up consisted of a steel cylinder able to retain rock fragments while vertical pressure was applied through a hydraulic press machine. The model geometry consisted of an inside diameter of 0.34 m, height of 0.70 m, and steel width contour of 0.03 m. Fragmented material was drawn from a drawbell at the bottom, emulating a block caving mine extraction system using a scaled LHD to draw the material. A constant vertical pressure was applied in each test.
Material was drawn from the bottom until the flow reached the top of the fragmented material (around 10% of the total fragmented material in over two hours). Then all material was homogenized, and the fragment size distribution was measured by sieving.
Mineral materials
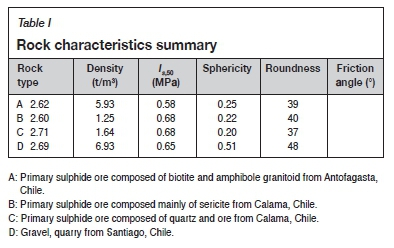
Four rock types were tested in the same confined flow system. Table I shows the rock density, IS50 (point load index) and internal friction angle obtained through standard laboratory tests. Sphericity and roundness were determined using the methodology proposed by Cho, Dodds, and Santamarina (2006).
Tests and data fitting
The four materials with different initial size distribution curves were used with constant vertical pressures applied during the comminution tests:
The normalized and non-normalized model parameters were adjusted using the fragment size distribution curves from the comminution tests. The trust-region-reflective least squares algorithm was used to obtain the model parameters (Moré and Sorensen, 1983), minimizing the square of the difference between experimental and modelled data.
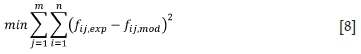
where fij,expand fif,modi are the experimental and modelled mass fraction of size interval i at pressure j respectively. We note that the non-normalized case includes the δ parameter with the constraints (δ > 0) for 0 < aj< 1.
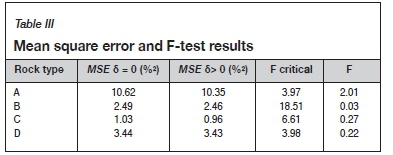
In order to evaluate whether the addition of the parameter 5 is relevant, an F-test was performed. The null hypothesis is the normalized model with δ = 0 nearly equal to the non-normalized model with δ > 0. The F-value was calculated using Equation [9]:
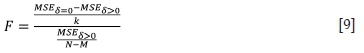
where MSE is the mean square error, k is the number of conditions (here δ = 0), N is the number of data points, and M is the number of parameters of the model i.
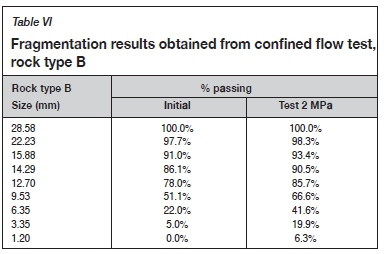
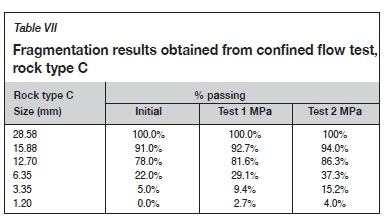
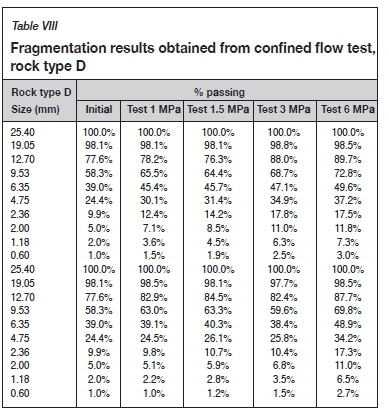
Results
In this section we present the results of the parameter identification for the normalized and non-normalized approaches, the selection and breakage functions, and the Fisher test. The complete experimental data can be found In the Appendix.
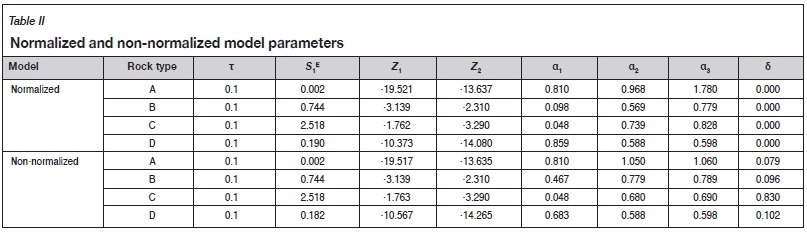
Fitted parameters
The non-normalized model parameters obtained for each rock type are summarized in Table II. In all cases the residence time t is kept constant and equals the average residence time of the tests (approx. 0.1 day).
In general, the non-normalized and normalized model parameters do not present significant differences: for example, rock types A and C present the same a1. These similarities between the models are also observed in the selection and breakage functions as shown in Figures 2 and 3.

Selection and breakage functions
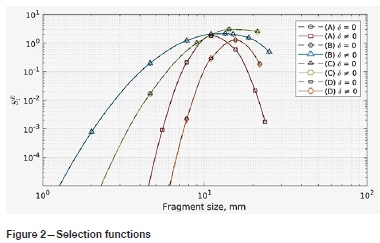
Figure 2 shows the rate of breakage (SiE), and Figure 3 shows the breakage functions (Bij of rock types A, B, C, and D.
The influence of fragment sizes on the rate of breakage when δ = 0 is not significant. Thus, ai (Equation [7]) could be assumed constant, depending on fragment size. This is also noticed in the breakage function in Figure 3 for δ > 0, where for each rock type data-point, the breakage functions follow the same resulting fragment size distribution, independent of initial fragment size (as modelled by the normalized BCCM presented in Gómez et al. 2017).
Fisher test
Using a false-rejection probability of 0.05, the critical values of the F-distribution are presented in Table III. Here, all the F-values are lower than the respective critical values; therefore, the use of the simplified normalized model is recommended in these cases.
Conclusions
The literature indicates that in milling systems the normalized model (Equation [5]) can be applied in almost all cases. However, this assumption cannot be considered a priori in the block caving method since the mechanism of breakage differs from that in the milling process. The non-normalized model implies that in the breakage function, Bij, the resulting fragment size distribution depends on the original fragment size. According to the experimental results and parameter fitting, we found that the fragment size distribution is independent of the initial fragment sizes. Thus, for the materials and confined flow system examined here, a simplified normalized model should be used, independent of the material.
It must be noted that abrasion and compression are the fragmentation mechanisms observed in the experiments, but compression is probably the dominant mechanism. Compression generates a narrow particle size distribution with relatively low quantities of fine and large particles, which we speculate explains the results of this work. It is well known that the stress over the rock depends on the height at which it is located. In the present model, this stress is supposed to be constant throughout the column, which can lead to differences with respect to experimental data. In a later work, we will extend the present model by incorporating this dependence into the governing equations.
Acknowledgments
This work was funded by the CONICYT PFCHA/DOCTORADO BECAS CHILE/2018 - 21180046. The Block Caving Laboratory and the Advanced Mining Technology Center of the University of Chile, CONICYT project FB0809. F.B. acknowledges the support of ANID/PIA/AFB170001 and ANID/FONDAP/15130015.
Conflict of Interest
The authors declare that they have no conflict of interest.
References
Austin, L. and Concha, F. 1994. Discrete mill kinematic: Population mass balance of sizes. Design and Simulation of Mill and Classification Circuits. Austin L. and Concha F. (eds). CYTED, Concepcion, Chile. pp. 65-82 [in Spanish]. [ Links ]
Austin, L. and Luckie, P.T. 1972a. Estimation of non-normalized breakage distribution parameters from batch grinding. Powder Technology, vol. 5, no. 5. pp. 267-271. [ Links ]
Brady, B.H.G. and Brown, E.T. 2004. Rock Mechanics for Underground Mining. Springer. [ Links ]
Brown, E.T. 2004. Fragmentation assessment. Block Caving Geomechanics. 2nd edn. Brown, E.T. (ed.). JKMRC, Queensland. pp. 184-227 [ Links ]
Brunton, I., Lett, J., and Thornhill, T. 2016. Fragmentation prediction and assessment at the Ridgeway Deeps and Cadia East cave operations. Proceedings of the 7th International Conference & Exhibition on Mass Mining: Massmin 2016. Australasian Institute of Mining and Metallurgy, Melbourne. pp.151-160. [ Links ]
Brzovic, A., vallejos, A., Arancibia, E., Burgos, L., Delonca, A., Gaete, M., and Barrera, v. 2016. Analysis and modelling of the fragmentation process - Case studies at El Teniente mine. Proceedings of the 7th International Conference & Exhibition on Mass Mining. Australasian Institute of Mining and Metallurgy, Melbourne. pp. 305-310. [ Links ]
Cundall, P.a., Pierce, M.E., and Mas Ivars, D. 2008. Quantifying the size effect of rock mass strength. Proceedings of the First Southern Hemisphere International Rock Mechanics Symposium. Australian Centre for Geomechanics, Perth. pp. 3-15. [ Links ]
Cho, G., Dodds, d., and Santamarina, J.C. 2006. Particle shape effects on packing density, stiffness and strength: natural and crushed sands. Journal of Geotechnical and Geoenvironmental Engineering, vol. 132, no. 5. pp. 591-602. [ Links ]
Dorador L. 2016. Experimental investigation of the effect of broken ore properties on secondary fragmentation during block caving. PhD thesis, University of British Columbia. [ Links ]
Dorador, L., Eberhardt, E., Elmo, d., and Aguayo, A. 2014. Influence of secondary fragmentation and column height on block size distribution and fines migration reaching drawpoints. Proceedings of the 3rd International Symposium on Block andSublevel Caving, Santiago, Chile. Castro, R. (ed.). Universidad de Chile. pp. 5-6. [ Links ]
Eadie, B.A. 2003. A framework for modelling fragmentation in block caving. PhD thesis, University of Queensland. [ Links ]
Gómez, R., Castro, R., Casali, A., Palma, S., and Hekmat, A. 2017. A comminution model for secondary fragmentation assessment for block caving. Rock Mechanics and Rock Engineering, vol. 50. pp. 3073-3084. [ Links ]
Hardin, B.O. 1985. Crushing of soil particles. Journal of Geotechnical Engineering, vol. 111, no. 10. pp. 1177-1192. [ Links ]
Hashim, M.H.M., Sharröck, G.B., and Saydam, S. 2008. A review of particle percolation in mining. Proceedings of the First Southern Hemisphere International Rock Mechanics Symposium. Australian Centre for Geomechanics, Perth. pp. 273-284. [ Links ]
Herbst, J.A. and Füerstenaü, D.W. 1980. Scale-up procedure for continuous grinding mill design using population balance models. International Journal of Mineral Processing, vol. 7, no. 1. pp. 1-31. [ Links ]
Hurtado, J.P., Pereira, J., and Campos, R. 2007. Pre-feasibility study project NNM -NNM-ICO-GEO-INF N° 003. Teniente, Internal Report. [ Links ]
Klimpel, R.R. and Austin, L.G. 1977. The back-calculation of specific rates of breakage and non-normalized breakage distribution parameters from batch grinding data. International Journal of Mineral Processing, vol. 4, no. 1. pp. 7-32. [ Links ]
Kurniawan, C. and Setyökö, T.B. 2008. Impact of rock type variability on production rates and scheduling at the DOZ-ESZ block cave mine. Massmin 2008. Proceedings of the 5th International Conference and Exhibition on Mass Mining, Luleá, Sweden, 9-11 June 2008. Luleá University of Technology. [ Links ]
Lade, P.v., Yamamurö, J.A., and Böpp, P.A. 1996. Significance of particle crushing in granular materials. Journal of GeotechnicalEngineering, vol. 122, no. 4. pp. 309-316. [ Links ]
Landriault, D. 2001. Backfill in underground mining. Underground Mining Methods, Engineering Fundamentals and International Case Studies. Hustrulid, W.A. and Bullock, R.L. (eds). SME. pp. 601-614. [ Links ]
Laubscher, D.H. 1994. Cave mining - The state of the art. Journal of the South African Institute of Mining and Metallurgy, vol. 94, no. 10. pp. 279-293. [ Links ]
Laubscher, D.H. 2000. Secondary fragmentation. A Practical Manual on Block Caving. https://www.resolutionmineeis.us/sites/default/files/references/laubscher-2000.pdf [ Links ]
Lee, K.L. and Farhöömand, I. 1967. Compressibility and crushing of granular soil in anisotropic triaxial compression. Canadian Geotechnical Journal, vol. 4, no. 1. pp. 68-86. [ Links ]
Lee, I.K. and Coop, M.R. 1995. The intrinsic behaviour of a decomposed granite soil. Géotechnique, vol. 45, no. 1. pp. 117-130. [ Links ]
Liu, H., Xia, Z., Ren, f., and He, R. 2019. Study on discrete element simulation of secondary rock failure characteristics in granular media. Geotechnical and Geological Engineering, vol. 37, no. 4. pp. 2503-2511. [ Links ]
Manso, J., Marcelino, J., and Caldeira, L. 2021. Single-particle crushing strength under different relative humidity conditions. Acta Geotechnica, vol. 16, no. 3. pp. 749-761. [ Links ]
McDowell, G.R. and Bolton, M.D. 1998.. On the micromechanics of crushable aggregates. Géotechnique, vol. 48, no. 5. pp. 667-679. [ Links ]
McDowell, G.R. and Humphreys, A. 2002. Yielding of granular materials. Granular Matter, vol. 4, no. 1. pp. 1-8. [ Links ]
Merino, L 1986 Predicting the size distribution of ore fragments in block caving mines. MSc thesis, Imperial College, London. [ Links ]
Miura, N. and Yamanouchi, T. 1975. Effect of water on the behavior of a quartz-rich sand under high stresses. Soils and Foundations, vol. 15, no. 4. pp. 23-34. [ Links ]
Moré, J.J. and Sorensen, D.C. 1983. Computing a trust region step. SIAM Journal on Scientific and Statistical Computing, vol. 3. pp. 553-572. [ Links ]
Nakata, y., Hyde, A.F.L., Hyodo, M., and Murata, H. 1999. A probabilistic approach to sand particle crushing in the triaxial test. Géotechnique, vol. 49, no. 5. pp. 567-583. [ Links ]
Nedderman, R.M. 1992. Statics and Kinematics of Granular Materials. Cambridge University Press. [ Links ]
Nicholas, D. and Srikant, A. 2004. Assessment of primary fragmentation from drill core data. Proceedings of Massmin 2004. Instituto de Ingenieros de Chile. pp. 55-58. [ Links ]
Pierce, M., Weatherley, D.K., and Kojovic, T. 2010. A hybrid methodology for secondary fragmentation prediction in cave mines. Proceedings of Caving 2010. Australian Centre for Geomechanics, Perth. pp. 567-582. [ Links ]
Reid, K.J. 1965. A solution to the batch grinding equation. Chemical Engineerng Science, vol. 20, no. 11. pp. 953-963. [ Links ]
Yu, T.R. 1989. Some factors relating to the stability of consolidated rockfill at Kidd Creek. Innovations in Mining Backfill Technology. Proceedings of the 4th International Symposium on Mining with Backfill, Montreal, 2-5 October 1989. Vol. 4. Hassani, F.P., Scobie, M.J., and Yu, T.R. (eds). Balkema, Rotterdam. pp. 279-286. [ Links ]
Wood, D.M. and Maeda, K. 2008. Changing grading of soil: Effect on critical states. Acta Geotechnica, vol. 3, article no. 3. [ Links ]
 Correspondence:
R. Gómez
Email: regomez@udec.cl
Received: 3 Mar. 2021
Revised: 4 Aug. 2021
Accepted: 10 Aug. 2021
Published: November 2021
Appendix A: BCCM applications
First, it is necessary to determine the parameters of the model (S1E, Zv Z2, a1, a2, a3) to apply the BCCM, by making an adjustment from experimental laboratory tests. Subsequently, it is possible to solve the governing equations of the model if we know the input curve (primary fragmentation), physical characteristics of the column, and the operational conditions.
The model was evaluated for five reported mine cases. The first fragmentation reported is considered as the primary fragmentation. The laboratory calibration parameters of rock type A (Table IV), which has a strength similar to the selected mine cases, were used. The mean vertical stress in the broken column was estimated through the Janssen equation (Nedderman, 1992).

The fragmentation rate is scaled with respect to laboratory experiments so that

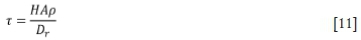
The residence time for all cases was estimated using
The results obtained using the residence time calculated by the previous equation show that the model overestimates the rock fracture. This behaviour had already been reported in Gómez et al. (2017). These differences can be ascribed to three reasons: (i) the material suffers the greatest fractures at the beginning of the process; (ii) the vertical forces are usually low close to the movement zones, and (iii) the draw rate and vertical force are dependent on the height of the column, which changes over time. Figure 4 shows the results considering a residence time between 1.5 and 3.7% of that calculated by Equation [11]. In this case, the data provided by the model fit well to the real data of the cases studied.
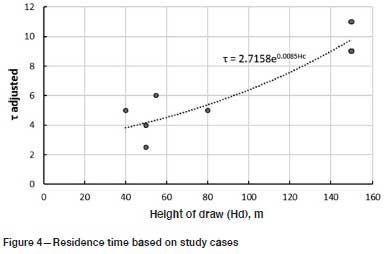
Figure 5 shows the fragmentation results using the model considering the real residence time (Equation [11], blue points in Figure 5) and the adjusted residence time (red squares in Figure 5). Importantly, we need to use a shorter residence time to obtain a good fitting. Also, the effect of the greater extraction height of the same mine can be observed in Figures 5C and D, and Figures 5E and F.

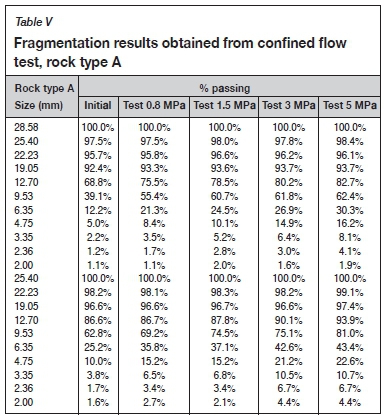
Appendix B: Experimental data
Experimental data used to calibrate both models is presented here.

