


Services on Demand
Article
 English (pdf)
 Article in xml format
 Article references
Indicators

Related links
-
 Cited by Google
 -
 Similars in Google
Share

 Permalink
Journal of the Southern African Institute of Mining and Metallurgy
On-line version ISSN 2411-9717
Print version ISSN 2225-6253
J. S. Afr. Inst. Min. Metall. vol.121 n.11 Johannesburg Nov. 2021
http://dx.doi.org/10.17159/2411-9717/1301/2021
PROFESSIONAL TECHNICAL AND SCIENTIFIC PAPERS
http://dx.doi.org/10.17159/2411-9717/1301/2021
Local magnitude calibration of seismic events in the West Rand, Far West Rand, and Klerksdorp-Orkney-Stilfontein-Hartebeesfontein gold mining areas
M.B.C. Brandt
Council for Geoscience Engineering and Geohazards, Unit, South Africa
SYNOPSIS
Richter magnitudes for seismic events were calibrated for use as a Local magnitude scale in the West Rand (WR), Far West Rand (FWR), and Klerksdorp-Orkney-Stilfontein-Hartebeesfontein (KOSH) gold mining areas. Richter magnitudes are currently calculated from seismograms recorded by local surface cluster networks using tabulated calibration values for Southern California, published in 1958. The Richter (1958) model is incorrect for distances of less than 30 km and should be applied only to crustal earthquakes in regions with similar attenuation properties to those of Southern California. When compared to the South African National Seismograph Network (SANSN), the cluster networks, on average, overestimate seismic event magnitudes by approximately 0.1 of a magnitude unit. A calibrated Local magnitude scale was derived by means of a multiple regression analysis between the Local magnitudes reported by the SANSN and the largest zero-to-peak trace amplitudes measured on the cluster network horizontal seismograms, after modelling the attenuation of the seismic waves as these progress from the epicentre to the station position. Magnitudes reported by individual stations for the same event show a significant scatter around the average magnitude owing to the near-surface amplifications of the seismic waves at the recordings sites. Average magnitude should be estimated using as many magnitudes of individual stations as possible to ensure an accurate estimate. Larger event magnitudes should be compared with those recorded by the SANSN.
Keywords: Richter magnitude, local magnitude calibration, seismic event, Witwatersrand Basin.
Introduction
Magnitude in seismology is a concept that describes the size of a seismic event based on instrumental measurements of some kind. The first magnitude scale was introduced by Richter (1935) for Southern California, USA. This scale only requires the location of the seismic event to be known and the ground motion amplitudes to be recorded by a standard Wood-Anderson seismograph. The maximum zero-to-peak trace amplitudes of the earthquake signals are measured on both horizontal-component seismograms (NS and EW) and the magnitude is calculated using the greater of the two measurements. Richter (1935) quantified the scale as follows: 'The magnitude of any shock is taken as the logarithm of the maximum trace amplitude, expressed in microns, with which the standard short-period torsion seismometer... would register that shock at an epicentral distance of 100 km.'
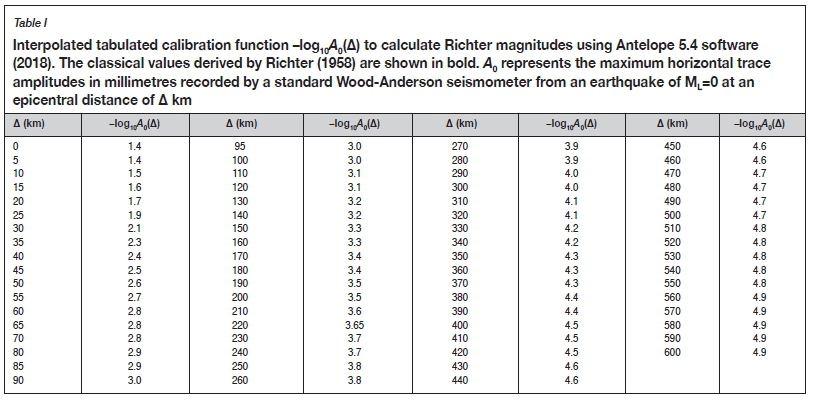
To calculate magnitudes for other distances, Richter (1958) provided tabulated attenuation corrections (calibration values) for distances from 0-600 km, assuming a focal depth of 18 km. Accordingly, Richter magnitude ML is calculated using the equation:

where Amax is the largest measured zero-to-peak trace amplitude in millimetres on a Wood-Anderson recorded horizontal seismogram, A0represents the trace amplitudes in millimetres from an earthquake of ML=0, and -log10(A0) represents the tabulated calibration values (Richter, 1958). Hutton and Boore (1987) derived the following parametric equation for the calibration values:

where R is the hypocentral distance in kilometres.
In Equation [2], the largest trace amplitude is measured in nanometres on a synthetic seismogram recorded by a modern horizontal-component seismograph. The seismogram is filtered so that the response of the seismograph and filter system replicates that of a standard Wood-Anderson seismograph, but with a static 1 X magnification. Modern synthetic seismograms more closely resemble the signal recordings than the actual standard Wood-Anderson seismograph because the manufacturer specifications for magnification published in the 1930s were found to be inaccurate (Uhrhammer and Collins, 1990).
Standard Equation [2] should be used when calculating Richter magnitudes for crustal earthquakes in regions with attenuation properties similar to those of Southern California. For regions with different attenuation properties, the standard equation is of the form:

where Amax and R are the same as in Equations [1] and [2] and where C(R) and D need to be calibrated to adjust for the different regional attenuation. The maximum amplitude may be measured on a vertical-component seismogram after adjusting for any systematic differences between the amplitudes recorded by the horizontal seismographs and the vertical seismographs (Bormann, 2012).
The South African national geological survey (the Council for Geoscience) is mandated to operate the South African National Seismograph Network (SANSN). A calibrated Richter magnitude scale, referred to as a Local magnitude scale, was derived using vertical-component seismographs for the SANSN (Saunders et al., 2008; 2012):

where A0 and R are the same as before. Vertical-component maximum amplitudes were selected for continuity because, until the 1990s, the SANSN comprised mostly vertical-component seismometers. Dissimilarities in the coefficients for log10(R) and R in Equations [2] and [4] reflect the different attenuation properties between Southern California and South Africa.
In addition to the SANSN, the Council for Geoscience also operates cluster networks of dense local, surface stations within the Far West Rand (FWR), West Rand (WR), Central Rand, and the Klerksdorp-Orkney-Stilfontein-Hartebeesfontein (KOSH) gold mining areas. The magnitudes reported by the cluster networks have not yet been calibrated. Richter magnitudes are currently calculated using Equation [1] and the tabulated values of Richter (1958) for Southern California. This causes discrepancies between the Local magnitudes reported by the SANSN and Richter magnitudes reported by the cluster networks. On average, the cluster networks overestimate seismic event magnitudes by approximately 0.1 of a magnitude unit. The seismograms recorded by the stations of the cluster networks are automatically processed and manually re-analysed using Antelope 5.4 software (2018). This software calculates Richter magnitudes with the largest zero-to-peak trace amplitudes measured on the horizontal-component seismograms with Equation [1], identical to the original method of Richter (1935). The calibration values in Equation [4] for the vertical-component seismograms of the SANSN that resemble a synthetic Wood-Anderson seismograph with a static magnification 1 x can therefore not be simply transferred to the cluster network.
The purpose of this article is to derive tabulated calibration values for log10(A0) in Equation [1] for the cluster network horizontal components such that, on average, the Local magnitudes reported by the cluster networks have the same sizes as those reported by the SANSN. This will be accomplished by means of a multiple regression analysis between the Local magnitudes reported by the SANSN, the largest zero-to-peak trace amplitudes measured on the cluster network horizontal seismograms, where -log10(A0) is modelled using Equation [3] and where C(R) + D have the same respective variables as in Equation [2].
Richter magnitudes currently reported by surface mine cluster networks
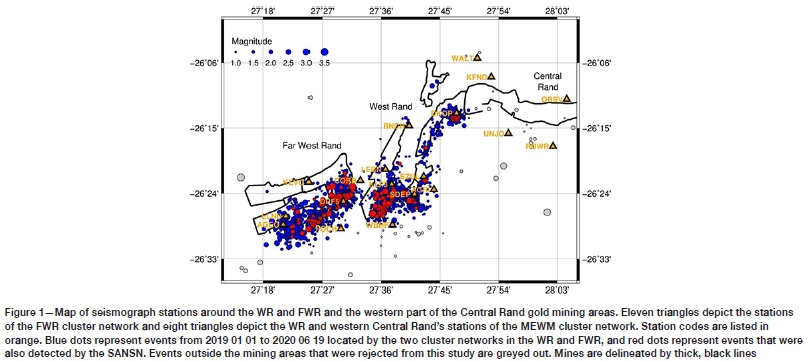
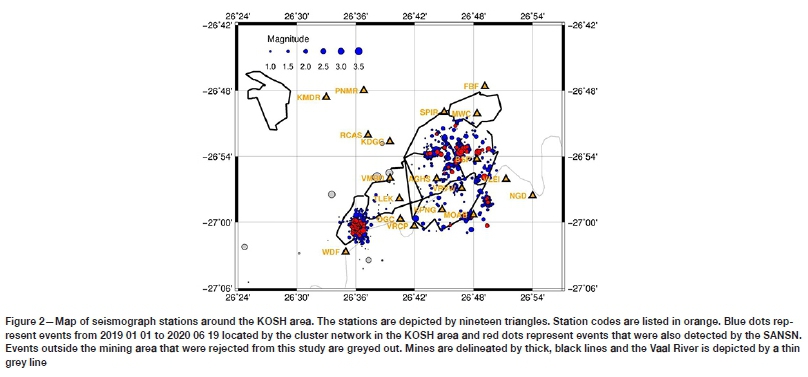
The Council for Geoscience operates three mine surface cluster networks, and the event origin times, epicentres and magnitudes may be obtained from the web page <http://196.38.235.147:8070/livemines/>. The mine and environmental water management programme (MEWMP) network consists of ten stations across the West, Central, and East Rand. The purpose of this network is to monitor seismicity that may be linked to the ingress of water into abandoned mines in and around the City of Johannesburg. The FWR network comprises 11 stations situated in the Carletonville region. The network was installed as part of a research project initiated by the Japanese International Cooperation Agency. The KOSH network consists of 19 stations installed in the Klerksdorp-Orkney-Stilfontein-Hartebeesfontein region, as part of a project sponsored by the Mine Health and Safety Council.
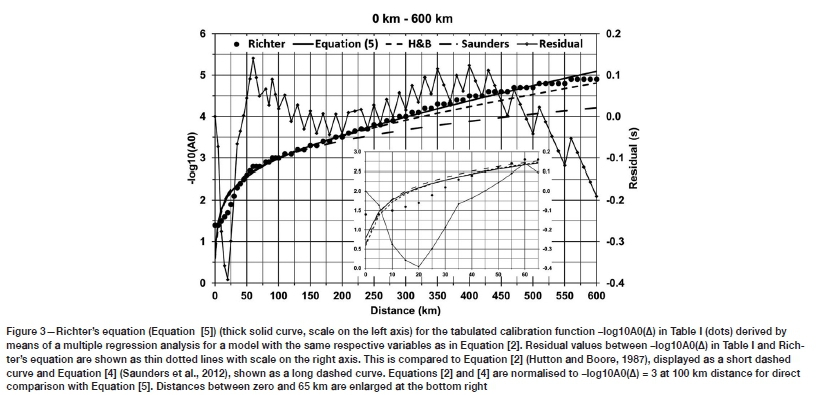
The positions of stations and the seismic events for the period 1 January 2019 to 19 June 2020 used in this study are shown in Figures 1 and 2. The tight clustering of seismic events detected by both the SANSN and the surface cluster network is an artefact of the event density; in other words, most of the events were located at the centre of the cluster. The Richter magnitudes in Figures 1 and 2 were calculated by means of Antelope 5.4 software (2018) using Equation [1] and the calibration values for log10(A0), listed in Table I. The calibration values in Table I, as well as those for Equations [2] and [4], are graphically depicted in Figure 3. Richter's equation for the tabulated calibration function -log10A0(A) in Table I is derived (Figure 3) by means of a multiple regression analysis for an equation with the same variables as Equation [2]:
R2 is the goodness-of-fit measure where 0 <R2 <1 for the linear regression model, and 1 indicates a perfect fit.
There is a significant offset between the constant value 0.787 and the constants -2.09 and -2.04 in Equation [2] (Hutton and Boore, 1987) and Equation [4] (Saunders et al., 2012), respectively. This is because Richter (1935) measured the largest trace amplitude in millimetres as recorded by a standard Wood-Anderson seismograph, whereas modern simulated Wood-Anderson seismograms have a static amplification of x 1. Unit amplification implicitly means that true ground motion amplitudes in nanometres are measured for the recorded frequency range. Hutton and Boore (1987) updated the coefficients for log10(R) and R in Equation [2] and determined that Richter's (1958) calibration values for near distance A <30 km are incorrect (Figure 3). Bakun and Joyner (1984) drew the same conclusion for near-distance weak events recorded in Central California. Richter's 1958 calibration values causes magnitude estimates from nearby stations to be smaller than those from more distant stations (Bormann, 2012). Hutton and Boore (1987) further suggested deriving calibration values based on a shallow focal depth of 0 km for crustal earthquakes, as values measured in this way provide a better fit than those calculated using the 18 km focal depth proposed by Richter (1958).
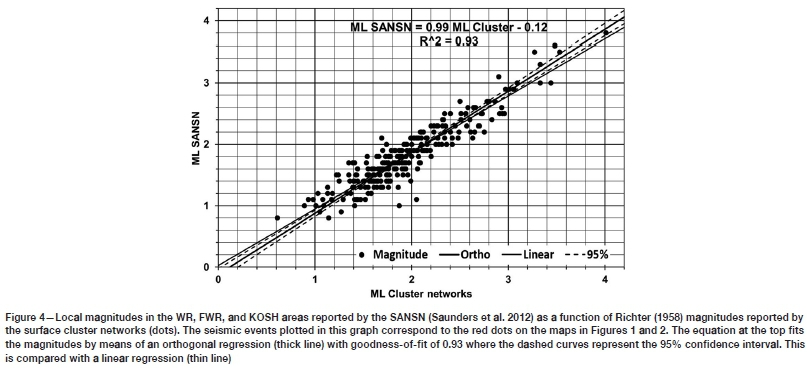
An orthogonal regression between 256 Local magnitudes reported by the SANSN (Saunders et al., 2012) and the Richter magnitudes reported by the surface cluster networks (Richter, 1958) in Figure 3 produces the equation:

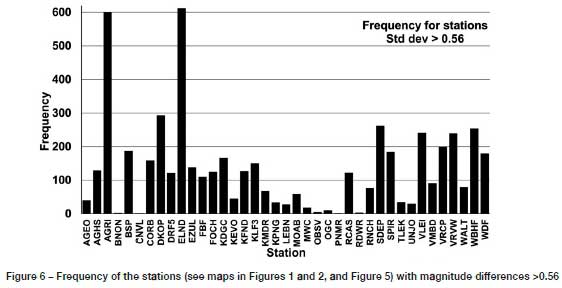
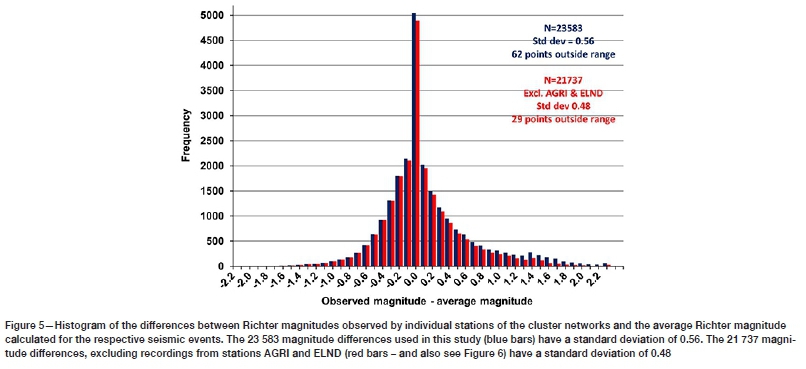
where R2 is defined as before. The cluster networks, on average, overestimate seismic event magnitudes by approximately 0.1 of a magnitude unit. Even though the goodness-of-fit is high and the 95% confidence level indicates a credible match, the scatter of the magnitudes around the best fit orthogonal relation is significant. The scatter is investigated in the histograms and bar graph in Figures 5 and 6. The differences between the Richter magnitudes observed by individual stations of the cluster networks and the average Richter magnitudes calculated for the respective seismic events have a standard deviation of 0.56 (Figure 5). The frequency bar graph in Figure 6 for stations with magnitude differences of more than 0.56 revealed incorrectly calibrated stations AGRI and ELND. The magnitude differences, excluding recordings from stations AGRI and ELND, have a standard deviation of only 0.48. The rejected magnitudes reported by AGRI and ELND cause the distribution of the histogram to become more symmetrical in regard to positive magnitude differences, especially for those >0.6. However, magnitude differences <0.6 also decrease, indicating that stations AGRI and ELND were not malfunctioning throughout the whole study period. Hence, for the remainder of this article, only observations where the Richter magnitude difference is <0.56 will be used.
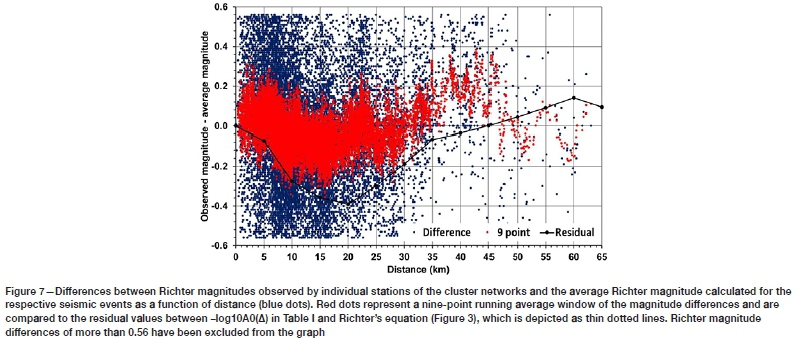
Next, we investigate whether the finding by Hutton and Boore (1987) and by Bakun and Joyner (1984), that Richter's (1958) calibration values for near distance A <30 km in California are incorrect, can be extrapolated to the WR, FWR, and KOSH mining areas. To accomplish this we plot the Richter magnitude differences (<0.56) as a function of distance in Figure 7. A comparison between the Richter magnitude differences and the residual values between -log10A0(A) in Table I and Richter's equation (Figure 3) confirms that Richter's (1958) calibration values are indeed also incorrect for the WR, FWR, and KOSH mining areas for near distances. We conclude that the calibration values for log10(A0) should be modelled with Equation [3], where C(R) + D have the same respective variables as in Equation [2]. However, calculating Richter magnitudes with incorrect calibration values for near distances of A <30 km is not the only cause of the large scatter in magnitudes around the best fit orthogonal relation in Figure 4 and the large scatter in the histogram of Richter magnitude differences (Figure 5). The rapid changes of the nine-point running average window between about -0.18 and +0.1 at distances of 47 km, 51 km, 55 km and 59 km in Figure 7 indicate that neighbouring stations have observed significantly different magnitudes for the same seismic event. These rapid changes are not visible at shorter distances owing to the many observed magnitudes that plot on top of one another, but which probably also exist. These rapid changes provide evidence of near-surface amplifications where a seismometer has not been installed on competent bedrock. Bormann (2012) reports that the closely spaced stations of a seismic array may measure relative amplifications to one another in ground amplitudes of 10 to 30 times when installed on soft soil such as alluvium. Security is the primary criterion for the selection of a site to install a seismograph station in a mining area as a result of the high risk of theft or vandalism. Many of the seismometers are therefore not installed on competent bedrock, thus providing the option of relocating a station if the security situation worsens or if the host mine or landowner closes or suspends operations. However, magnitude differences of >0.56 are likely the result of equipment malfunction or processing errors. Antelope 5.4 software (2018) rejects outliers when calculating the average magnitude, and weighs individual magnitude observations according to the signal-to-noise ratio of the maximum measured amplitude.
Local magnitude calibration
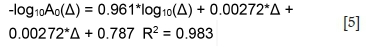
Calibration values for -log10(A0) in Equation [1] for the cluster networks are derived by means of a multiple regression analysis between the Local magnitudes reported by the SANSN, ML, and the largest zero-to-peak trace amplitudes measured on the cluster network horizontal seismograms, Amax, and are shown in Figure 8, with the tabulated values in Table II. The attenuation of the seismic waves as these progress from the epicentre to the station position is modelled with Equation [3] and where C(R) + D have the same variables as in Equation [2]. Values for Amax, where the Richter magnitude difference in Figure 5 is >0.56, were excluded from the analysis.
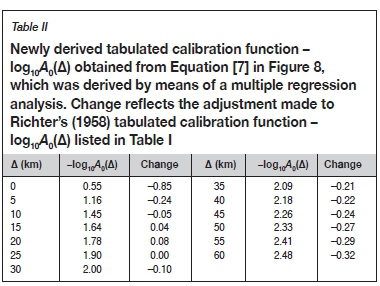
The derived equation is:

where distance 0 <A <60 km and R2 indicates a poor fit to the large scatter of the values for -log10A0(A) = ML - log10(Amax) around the model. The poor fit is unsurprising, given the large scatter of the magnitudes around the best fit orthogonal (Equation [6]) in Figure 4 and the large scatter in Richter magnitude differences (within one standard deviation of 0.56) in Figure 5. However, the average values of -log10A0(A) in 5 km bins (Figure 8) compare well with Equation [7] except for the 40 km bin, which may indicate a significant near-site amplification at that distance station compared to most of the seismic events. This shows that good estimates of Local magnitudes by the cluster networks are possible if outliers are rejected and a sufficient number of measurements with appropriate weights for signal-to-noise ratios are averaged, as is currently the practice with Antelope 5.4 software (2018). Most of Richter's (1958) tabulated calibration values are adjusted downward to account for the magnitude overestimate of approximately 0.1 of a unit established in Equation [6] when taking the incorrect model into consideration. This is as expected, since seismic waves show less attenuation with distance in South Africa than is the case in Southern California (Brandt, 2015). The largest adjustment is made at the epicentre, at 0 km distance, in line with the proposal by Hutton and Boore (1987) to derive calibration values for a surface focal depth of 0 km for shallow events as these will provide a better fit for crustal events. This is especially relevant in respect of mine seismic events, where the typical focal depth is 2 km (Brandt, 2014). The newly derived calibration values are similar to those in Equation [4] (Saunders et al., 2012) when adjusted for the constant difference between amplitudes recorded by horizontal seismographs and vertical seismographs.
Discussion and conclusions
Tabulated calibration values -log10(A0) were derived for the cluster network horizontal components, such that the Local magnitudes reported by the cluster networks on average have the same sizes as the Local magnitudes reported by the SANSN. This is an improvement on the current situation where the cluster networks, on average, overestimate seismic event magnitudes by approximately 0.1 of a magnitude unit.
The large scatter in magnitudes reported by individual stations for the same event is accounted for by the near-surface amplifications of the seismic waves at the recording sites. Antelope 5.4 software (2018) does not allow for the application of static corrections to the magnitudes of an individual station to compensate for its systematic over- or underestimation in comparison to the average magnitude of an event. The software was selected for its ability to automatically locate large numbers of mining events and to undertake a quick magnitude assessment. This is followed by manual re-analysis with a user-friendly graphical interface and is suitable for processing a large number of events. Even if it were possible to apply a static correction this would not be practical, because stations are re-located if the security at a site deteriorates. Hence, average magnitudes should be calculated from as many as possible individual stations to ensure the best possible magnitude estimates.
Magnitudes for larger events recorded by both the SANSN and cluster networks should be compared to one another. The seismometers of the SANSN are installed on bedrock inside high-quality vaults at sites with low background noise. The SANSN estimates of magnitudes for larger events should therefore be more accurate than those reported by the cluster networks.
Acknowledgements
This research was funded as part of the operation and data analysis of the South African National Seismograph Network and Cluster Mine Networks. The multiple regression analyses for this article were generated by means of the Real Statistics code (Zaiontz, 2020) in Microsoft® Excel® 2016. The maps were drafted using generic mapping tools (Wessel et al., 2013) and graphs were prepared using Microsoft® Excel® 2016. I wish to thank the Council for Geoscience for permission to publish my results. Zahn Nel undertook the language editing. Two anonymous reviewers are thanked for their suggestions to improve the article.
References
Antelope. 2018. Boulder Real Time Techologies Incorporated. Antelope 5.4. http://www.BRTT.com [ Links ]
Bakun, WH. and Joyner, W. 1984. The ML scale in Central California. Bulletin of the Seismological Society of America, vol. 74, no. 5. pp. 1827-1843. [ Links ]
Bormann, p. (ed.), 2012. New Manual of Seismological Observatory Practice (NMSOP-2), IASPEI, GFZ German Research Centre for Geosciences, Potsdam. http://nmsop.gfz-potsdam.de doi: 10.2312/GFZ.NMSOP-2 [ Links ]
Brandt, M.B.C. 2014. Focal depths of South African earthquakes and mine events. Journal of the Southern African Institute of Mining and Metallurgy. vol. 114. pp. 1-8. [ Links ]
Brandt, M.B.C. 2015. Qc and QS wave attenuation of South African earthquakes. Journal of Seismology. doi 10.1007/s10950-015-9536-6 [ Links ]
Hutton, L.K. and Boore, d.M. 1987. The ML scale in Southern California. Bulletin of the Seismological Society of America, vol. 77. pp. 2074-2094 [ Links ]
Richter, CF. 1935. An instrumental earthquake magnitude scale. Bulletin of the Seismological Society of America, vol. 25. pp. 1-32. [ Links ]
Richter, CF. 1958. Elementary Seismology. W. H. Freeman, San Francisco and London. 768 pp. [ Links ]
Saunders, I., Brandt, M.B.C., Steyn, J., Roblin, D.I., and Kijko, A. 2008. The South African National Seismograph Network. Seismological Research Letters, vol. 79. pp. 203-210. doi: 10.1785/gssrl.79.2.203 [ Links ]
Saunders, I., Ottemöller, I., Brandt, M.B.C., and Fourie, C.J.S. 2012. Calibration of an ML scale for South Africa using tectonic earthquake data recorded by the South African National Seismograph Network: 2006 to 2009. Journal of Seismology. doi 10.1007/s10950-012-9329-0 [ Links ]
Uhrhammer, R.A. and Collins, E.R. 1990. Synthesis of Wood-Anderson seismograms from broadband digital records. Bulletin of the Seismological Society of America, vol. 80. pp. 702-716. [ Links ]
Wessel, p., Smith, W.H.F., Scharroo, R., Luis, J.F., and Wobbe, F. 2013. Generic Mapping Tools: Improved version released. EOS Transactions of the American Geophysical Union, vol. 94. pp. 409-410. [ Links ]
Zaiontz, C. 2020. Real statistics using Excel. http://www.real-statistics.com [ Links ]
 Correspondence:
M.B.C. Brandt
Email: mbrandt@geoscience.org.za
Received: 29 Jul. 2021
Revised: 11 Oct. 2021
Accepted: 15 Oct. 2021
Published: November 2021

