


Serviços Personalizados
Artigo
 Inglês (pdf)
 Artigo em XML
 Referências do artigo
Indicadores

Links relacionados
-
 Citado por Google
 -
 Similares em Google
Compartilhar

 Permalink
Journal of the Southern African Institute of Mining and Metallurgy
versão On-line ISSN 2411-9717
versão impressa ISSN 2225-6253
J. S. Afr. Inst. Min. Metall. vol.121 no.11 Johannesburg Nov. 2021
http://dx.doi.org/10.17159/2411-9717/1502/2021
PROFESSIONAL TECHNICAL AND SCIENTIFIC PAPERS
http://dx.doi.org/10.17159/2411-9717/1502/2021
The effect of non-standard loading platen usage on point load index value of rocks
D. AkbayI; R. AltindagII
IÇanakkale Onsekiz Mart University, Çan Vocational School, Department of Mining and Mineral Extraction, Çan, Çanakkale, Turkey. https://orcid.org/0000-0002-7794-5278
IISüleyman Demirel University, Faculty of Engineering, Department of Mining Engineering, Isparta, Turkey. https://orcid.org/0000-0002-5397-7312
SYNOPSIS
The point load index is a simple, fast, and inexpensive method for determining rock strength and can be applied both in the field and in the laboratory. There are, however, some disadvantages and limitations to the method, and the test results can be affected by the person carrying out the test, the rock characteristics, or the test device. In this study we describe an investigation into how the point load index value is affected by the shape of the conical platens used in the test. Point load index tests were carried out using different devices fitted with conical platens of different spherical radii, and on a modified device which circumvented the limitations/disadvantages. It was seen that the point load index value increased as the platen radius increased, as expected. In the case of testing using non-standard conical platens, an equation is proposed to normalize the point load index value with respect to the standard spherical radius value.
Keywords: point load strength index, rock strength, limitations, test device.
Introduction
The point load index (PLI) is regarded as a valuable index test that gives a good initial indication of the rock strength in rock mechanics. The PLI test is simple, fast, and inexpensive. One of the biggest advantages of the PLI test is that it can be applied to irregular samples in the field. Many researchers have carried out detailed studies on the PLI test procedure, the effect of different loading configurations, sample size and shape, etc. During these studies, some limitations and errors associated with PLI devices have been identified. To date, these limitations and errors have been neglected in studies related to PLI because the purpose of the test is to find only an index value. However, the results of studies related to PLI demonstrate how important testing is in determining the strength of rocks, especially if the samples cannot be prepared to the required size for the uniaxial compressive strength (UCS) test. In such cases, the PLI test is inevitably used to determine the strength of the rocks.
The first studies related to the PLI are based on studies conducted to determine the tensile strength (TS) of rocks (Hiramatsu and Oka 1966; Reichmuth 1967; Franklin, Broch, and Walton, 1971). The method that was later developed by Broch and Franklin (1972) is still in use today. When the related literature is examined, it is seen that many studies examine the relationship between PLI and the physical and mechanical properties of rocks. The PLI has been the most researched test method for indirectly estimating the UCS of rocks (Bieniawski 1974, 1975; Bowden, Lamont-Black, and Ullyott 1998; Hawkins 1998; Rusnak and Mark 2000; Tsiambaos and Sabatakakis 2004; Akram and Bakar 2007; Sundara 2009; Singh, Kainthola, and Venkatesh, 2012; Alitalesh, Mollaali, and Yazdani, 2015; Elhakim 2015; Karaman, Kesimal, and Ersoy, 2015; Sheshde and Cheshomi 2015; Armaghani et al., 2016; Ferentinou and Fakir 2017; Kabilan, Muttharam, and Elamathi. 2017). Researchers have also carried out studies to estimate both UCS and TS using the PLI (Wijk, Rehbinder, and Lögdström, 1978; Panek and Fannon 1992; Butenuth 1997; Heidari et al., 2012; Li and Wong 2013; Khanlari, Rafiei, and Abdilor, 2014; Momeni et al., 2015; Minaeian and Ahangari 2017).
Many studies have been done on the relationships between the point load strength and some physical and mechanical properties of rocks. However, there are very few studies investigating the limitations and errors of the PLI test (Aston, MacIntyre, and Kazi, 1991; Topal 2000; Akbay and Altindag 2020). Aston, MacIntyre, and Kazi (1991) investigated the effect of worn and chipped conical platens used in PLI test devices on the PLI value. In the tests, they used concrete samples to represent a medium-hard sandstone. To assess the effect of wear (well-worn and chipped platens), a pair of conical platens were ground down to give a surface contact area 16 times greater than new ex-factory conical platens. Another pair of conical platens had 50% of the tip removed. Aston, MacIntyre, and Kazi determined that the PLI values obtained from the worn conical platens were approximately 40% higher than the values obtained from the standard conical platens, and the values obtained from the chipped conical platens were about 30% lower than from the standard platens.
In this study, we aimed to determine the effect of the conical platens spherical radius (r) on PLI value. PLI tests were carried out on 13 different test devices using conical platens with different spherical radius values between 2.2 and 6.2 mm. Further tests were carried out using a modified PLI test device that eliminated the effect of all variables except platen shape on the test result, with platens of r = 3 mm, 5 mm, and 5.5 mm. The modified test device is computer-controlled where the loading is automatic, thus eliminating the human factor from the tests. The test device and all its associated apparatus has been technically checked for compliance with the relevant standards. By this means it was possible to determine the specific effect of the conical platen on the PLI value. The tests were carried out on seven different rock types (three sedimentary, one metamorphic, and three igneous).
Point load index
The PLI test is based on breaking the specimen by compressing it between a pair of spherical conical platens. Specimens in the form of cores, blocks, or irregular lumps can be used (Figure 1). The specimen dimensions and limits are clarified in detail in the methods published by the International Society for Rock Mechanics and Rock Engineering (ISRM, 1985) and American Society for Testing and Materials (ASTM, 1995).
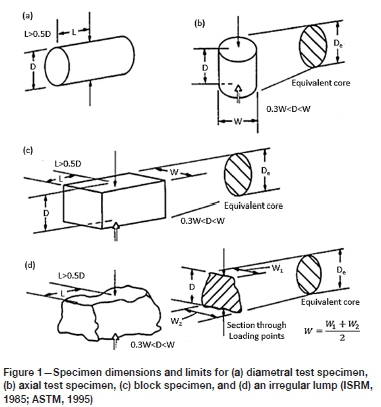
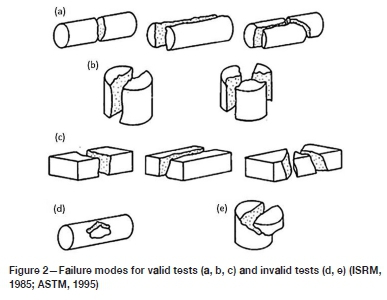
In this study, block specimens were used. Blocks of 50 ± 35 mm size are suitable for testing. The D/W ratio should be between 0.3 and 1.0. Rock failure should occur within 10-60 seconds for the test to be considered valid. Valid and invalid failure modes are depicted in Figure 2 (ISRM 1985; ASTM 1995).
Preferably, at least 10 tests should be done per sample. If the sample is heterogeneous or anisotropic, more tests can be done. After the test is completed, the uncorrected PLI is calculated as follows:
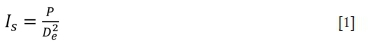
where
P = failure load, N
De= equivalent core diameter = D for diametral tests, m De2= D2 for cores, mm2
De2= 4A/n for axial, block, and irregular lumps, mm2
A = W x D minimum cross-sectional area of a plane through the platen contact points (Figure 1).
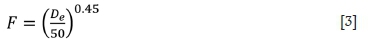
Ischanges as the function of D in the diametral test and the function of D in the axial, block, and irregular lump tests. Thus, a size correction must be applied to obtain a unique point load strength value for the rock sample that can be used for rock strength classification. Therefore, the Isvalue should be corrected for a standard core diameter (D = 50 mm). The size correction can be calculated using the following formula:

where
Is= Uncorrected point load strength value
F = Size correction factor.
F can be obtained from the expression:
The average value of Is(50) should be calculated by discarding the two highest and two lowest values obtained from ten valid tests and by calculating the average of the remaining six values. If fewer samples are tested, only the highest and lowest values are discarded (ISRM 1985; ASTM 1995).
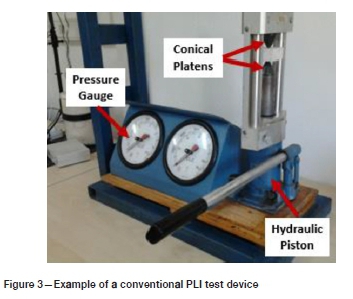
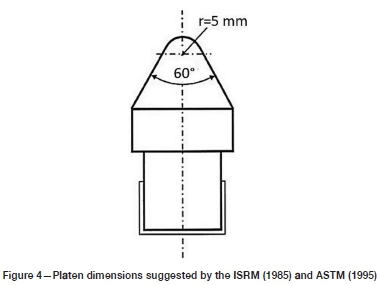
PLI test device
The most widely used (classical) PLI test devices consist of a loading system (hydraulic piston), loading (pressure) gauge, and conical platens (Figure 3). The 60° cone and 5 mm radius spherical conical platens should be used (Figure 4). The platens shall be of hard material (Rockwell 58 HRc) such as tungsten carbide or hardened steel (ISRM. 1985; ASTM. 1995) so they remain undamaged during testing. The use of non-standard conical platens causes the results of the test to differ from the actual value. If a conical platens' tip has a spherical radius of more than 5 mm, it is expected the PLI will be higher than normal, otherwise, lower. The degree of influence is unknown and difficult to predict.
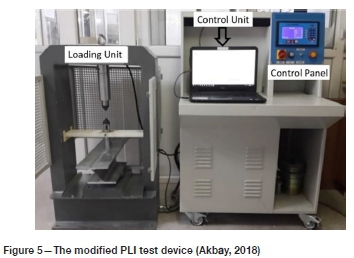
To determine the degree of influence of the spherical radius of the conical platen, a modified PLI test device was used in this study to circumvent the well-known limitations and errors of the classical PLI test device (Figure 5). The modified PLI device was manufactured with the ability to perform computer-controlled automatic loading according to the test conditions and standards recommended by the ISRM (1985) and ASTM (1995). The loading process is computer-controlled to ensure that the conical platen is the only variable. Thus, discrete loading and the effect of the user are eliminated. Each rock sample was tested using three different conical platens, and the influence of the platen spherical radius on the PLI determined.
Materials and method
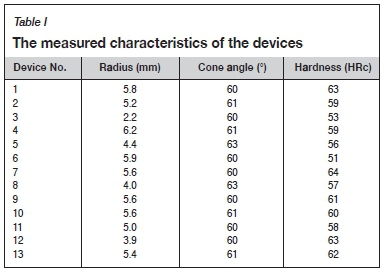
The cone angle, spherical radius, and hardness of conical platens of 13 different PLI test devices were measured. The 60° cone and 5 mm spherical radius conical platens should be used in the PLI test method (ISRM, 1985; ASTM, 1995) and as shown in Figure 4. To control this, a simple mechanism was designed in the laboratory. The platens were placed on this mechanism so that the axis was horizontal and photographed from vertically above. The cone angles and the spherical radius values were measured by AutoCAD. Hardness values of the platens were measured with a hardness tester in the test device. The angle and hardness values, presented in Table I, were almost the same as, or very close to, the standard values. Therefore, it was decided to investigate how the spherical radius value affected the strength value. The PLI tests were carried on the 13 different test devices on the same seven rock samples.
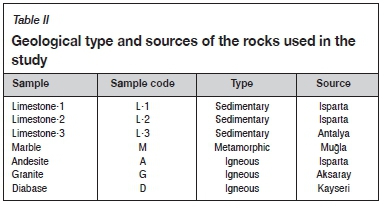
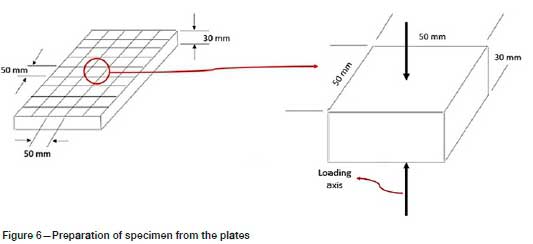
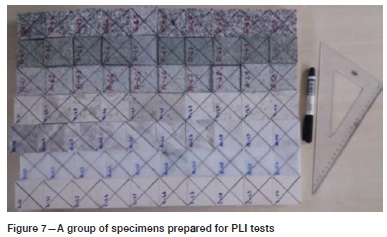
Seven different types of rocks were selected to represent a strength scale from low to high, and were supplied in the form of plates from various marble processing plants. Samples as homogenous as possible were selected (Table II). To avoid variations in the test results caused by depth, the specimens were prepared from the 30 mm thick plates obtained from the rock block in the horizontal direction (Figure 6). The specimens were prepared with the dimensions (50 x 50 x 30 mm) and volume (75 cm3) specified in ISRM (1985), taking into account their planar position. For each pair of conical platens, 10 specimens were prepared from each rock sample. Diagonal lines were drawn on the prismatic specimens to ensure loading at the midpoint (Figure 7).
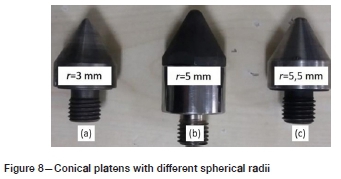
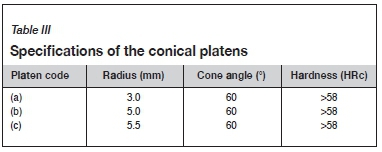
To determine the effect of the spherical radius (r) of the conical platens on the PLI, the PLI tests were performed on the same samples in the modified device using three different pairs of conical platens with different spherical radius values (r = 3 mm, 5 mm, and 5.5 mm) (Figure 8). The cone angle, spherical radius, and hardness values of the conical platens are given in Table III. The only difference between the conical platens was the spherical radius value.
Results
Physical and mechanical properties of rock samples
The physical and mechanical properties of the rocks used in this study were determined according to the standards suggested by the ISRM and the Turkish Standards Institute (TSE). Unit volume weight (TS EN 1936 2010), water absorption percentage by weight (TS EN 13755 2014), apparent and total porosity (TS EN 1936 2010), density (TS EN 1936 2010), seismic velocity (TS EN 14579 2006), and uniaxial compressive strength (TS EN 1926 2013) tests were performed in the laboratory. At least 10 samples were used in the tests and the results calculated by taking the arithmetic average of these 10 values. The results are given in Table IV.
PLI tests on different test devices fitted with conical platens of different spherical radii
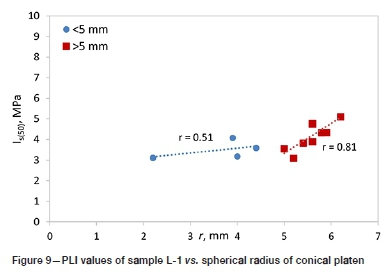
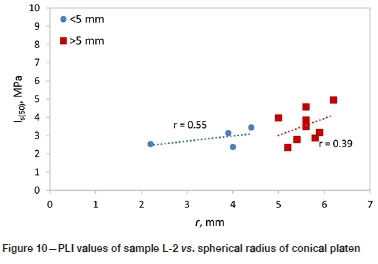
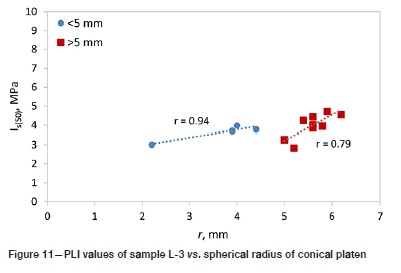
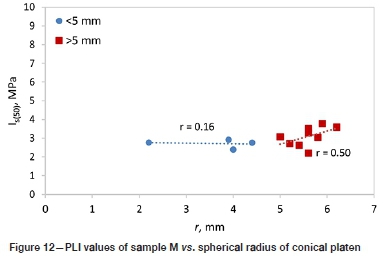
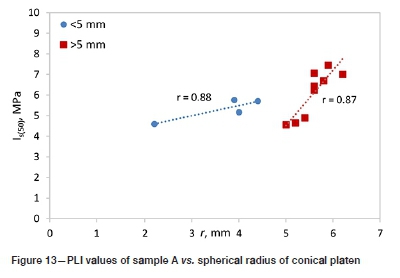
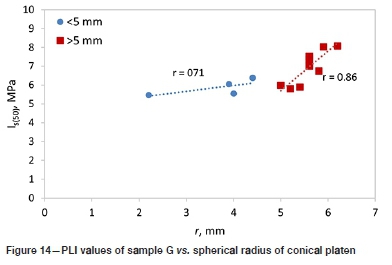
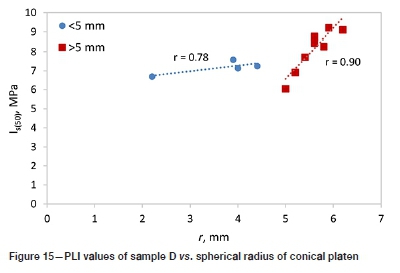
PLI tests were carried out on different PLI test devices fitted with conical platens with different spherical radius values. The results are presented in Table V. The distribution of PLI values corresponding to the spherical radii was plotted and the relationships between them examined. Correlation coefficients of the relationships were determined by adding trend lines. There is no significant relationship between the PLI value and the spherical radius of the conical platen. However, when the situations where the spherical radius is smaller or greater than the standard value are evaluated separately, it is noticed that there are significant relationships between PLI and the spherical radius (Figures 9-15). The tests were carried out by the same operator and the test specimens were prepared from the same rock samples. This means the failure mechanism changes with radii less than or greater than 5 mm, but this change cannot be explained by the change in radius alone because the uncontrollable machine parameters and rock properties that affect the PLI value are ignored here. The correlation coefficients (r) are under 0.50 for the L-2 and M samples. This is probably due to geological defects in the rocks.
Effect of the conical platen's spherical radius (r) on PLI value
The PLI values obtained from the modified PLI test device are plotted against the radius values in Figure 16. It is seen that the PLI increases as the spherical radius increases. The slope values (mi) of the trend lines in Figure 16 were determined to ascertain by how much the PLI values for the various rock types were affected by the change in the spherical radius of the platen (Table III). The ratios of the PLI values obtained from the tests using different conical platens to the values obtained with the standard platen are given in Table VI. A 0.5 mm change (increase or decrease) in the radius of the conical platen changed the strength value of the rock by 4%. The slope values indicate that the change in the radius of the platen had the most effect on the PLI value of the G-coded sample, and the least on the M-coded sample.
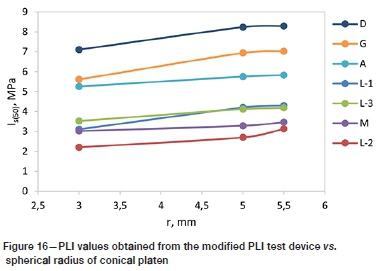
In the case of testing using conical platens with spherical radius values other than 5 mm, an equation is proposed to normalize the PLI values according to r = 5 mm (Equation [4]). The values obtained from the PLI tests and the normalized values are given in Table VII. Figure 16 shows a graph of the PLI values obtained from the tests using r = 5 mm platens corresponding with the normalized PLI values from the tests using r = 3 mm and r = 5.5 mm platens. The PLI values using platen r = 5 mm and normalized PLI values using platens r = 3 mm and r = 5.5 mm were examined and a strong linear relationship was determined between them.

where
Is(50)rs= Normalized PLI value according to spherical radius r = 5 mm, MPa
Is(50)ri = PLI value for spherical radius r * 5 mm (r < 5 mm or r > 5 mm), MPa
ri= Spherical radius value of conical platen, mm
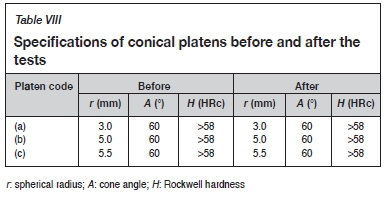
In this study, each conical platen was used to break 70 rock specimens. The cone angle, spherical radius, and hardness of the conical platens were measured both before and after the tests. Table VIII show that there was no change in the measured properties of the conical platens.
Conclusions
PLI tests were carried out on the same rock samples using different test devices fitted with conical platens with different spherical radii. There is no overall significant relationship between the PLI value and the spherical radius of the conical platen, but there are relationships between PLI and radius when radii of less than 5 mm and greater than 5 mm are considered separately. This indicates that the failure mechanism of the specimens changes, but this change cannot be explained by the radius alone, because there are variations in machine parameters and rock properties.
PLI tests were carried out on the same rock samples using a modified PLI test device, which is computer-controlled to eliminate the human factor (the loading is automatic), using three different pairs of conical platens with different spherical radii (3 mm, 5 mm, and 5.5 mm), to determine the effect of the spherical radius (r) of the conical platens on the PLI. The main conclusion arising from this study is that the PLI value increases as the spherical radius of the conical platen increases, but it is very difficult to determine the rate of this change. As the spherical radius decreases, the conical platen easily penetrates the rock sample and a lower PLI value is measured. As the r-value increases, the surface area of the platen in contact with the sample increases and the platen encounters greater resistance, thus the PLI value measured is higher than the actual value. When the radius of the platen becomes too large (contact area), the system switches from point load strength to compressive strength, because the load is applied to an area rather than a point, and the test then loses its validity.
Each ±0.1 mm change in radius value caused a change of ±0.8% in the value of the PLI according to the direction of change.
In the case of tests using conical platens with spherical radius values different from 5 mm, an equation is proposed to normalize the PLI values with respect to r = 5 mm.
The results of this study can be interpreted easily as slightly worn platens do not appear to alter the data significantly, especially when the data scatter due to different rock types is considered.
Breaking of a total of 210 rock samples did not cause any significant wear or damage to the conical platens in this study.
Acknowledgment
This study was supported by Süleyman Demirel University OYP Coordination Unit Project OYP-05286-DR-13 and the Scientific and Technological Research Council of Turkey (TUBITAK) Project 116R070. The authors thank TUBITAK and SDU OYP Project Coordination Unit.
Conflict of interest
The authors declare that they have no conflict of interest.
References
Akbay, D. 2018. Designing A New Testing Apparatus For Preventing The Errors in Point Load Index Test. PhD thesis, Süleyman Demirel University, Turkey. [ Links ]
Akbay, D. and Altindag, R. 2020. Reliability and evaluation of point load index values obtained from different testing devices. Journal of the Southern African Institute of Mining and Metallurgy, vol. 120, no. 3. pp. 181-190. [ Links ]
Akram, M. and Bakar, M.Z.A. 2007. Correlation between uniaxial compressive strength and point load index for salt-range rocks. Pakistan Journal of Engineering and Applied Sciences, vol. 1, no. 50. pp. 1-8. [ Links ]
Alitalesh, M., Mollaali, M., and Yazdani, M. 2015. Correlation between uniaxial strength and point load index of rocks. Proceedings of the 15th Asian Regional Conference on Soil Mechanics and Geotechnical Engineering. https://doi.org/10.3208/jgssp.irn-08 [ Links ]
Armaghani, D.J., For, M., Amin, M., Yagiz, S., Faradonbeh, R.S., and Abdullah, R.A. 2016. Prediction of the uniaxial compressive strength of sandstone using various modeling techniques. International Journal of Rock Mechanics and Mining Sciences, vol. 85. pp. 174-186. https://doi.org/10.1016/j'.ijrmms.2016.03.018 [ Links ]
ASTM. 1995. Standard test method for determination of the point load strength index of rock. American Society for Testing and Materials. https://doi.org/10.1520/D5731-08.2 [ Links ]
Aston, T.R.C., MacIntyre, J.S., and Kazi, H.A. 1991. The effect of worn and chipped points on point load indices. Mining Science and Technology, vol. 13. pp. 69-74. [ Links ]
Bieniawski, z.T. 1974. Estimating the strength of rock materials. Journal of the South African Institute of Mining and Metallurgy, vol. 74, March. pp. 312-320. https://doi.org/10.1016/0148-9062(74)91782-3 [ Links ]
Bieniawski, z.T. 1975. The point-load test in geotechnical practice. Engineering Geology, vol. 9, no. 1. pp. 1-11. https://doi.org/10.1016/0013 [ Links ]
Bowden, A.J., Lamont-Black, J., and Ullyott, S. 1998. Point load testing of weak rocks with particular reference to chalk. Quarterly Journal of Engineering Geology, vol. 31. pp. 95-103. http://citeseerx.ist.psu.edu/viewdoc/download?doi=10.1.1.967.5931&rep=rep1&type=pdf [ Links ]
Broch, E. and Franklin, J.A. 1972. The point-load strength test. International Journal of Rock Mechanics and Mining Sciences, vol. 9. pp. 669-697. [ Links ]
Butenuth, C. 1997. Comparison of tensile strength values of rocks determined by point load and direct tension tests. Rock Mechanics and Rock Engineering, vol. 30. pp. 65-72. [ Links ]
Elhakim, A.F. 2015. The use of point load test for Dubai weak calcareous sandstones. Journal of Rock Mechanics and Geotechnical Engineering, vol. 7, no. 4. pp. 452-457. https://doi.org/10.1016/j.jrmge.2015.06.003 [ Links ]
Ferentinou, M. and Fakir, M. 2017. An ANN approach for the prediction of uniaxial compressive strength, of some sedimentary and igneous rocks in eastern KwaZulu-Natal. Procedia Engineering, vol. 191. pp. 1117-1125. https://doi.org/10.1016/j.proeng.2017.05.286 [ Links ]
Franklin, J.A., Broch, E., and Walton, G. 1971. Logging the mechanical character of rock. Transactions of the Institution of Mining and Metallurgy, vol. 80A. pp. 1-9. [ Links ]
Hawkins, A.b. 1998. Aspects of rock strength. Bulletin of Engineering Geology and the Environment, vol. 57, no. 1. pp. 17-30. https://doi.org/10.1007/s100640050017 [ Links ]
Heidari, M., Khanlari, G.R., Kaveh, M.T., and Kargarian, S. 2012. Predicting the uniaxial compressive and tensile strengths of gypsum rock by point load testing. Rock Mechanics and Rock Engineering, vol. 45, no. 2. pp. 265-273. https://doi.org/10.1007/s00603-011-0196-8 [ Links ]
Hiramatsu, Y. and Oka, Y. 1966. Determination of the tensile strength of rock by a compression test of an irregular test piece. International Journal of Rock Mechanics and Mining Sciences & Geomechanics Abstracts, vol. 3, no. 2. pp. 89-90. [ Links ]
ISRM. 1985. Suggested method for determining point load strength. International Journal of Rock Mechanics and Mining Sciences & Geomechanics Abstracts, vol. 22, no. 2. pp. 51-60. [ Links ]
Kabilan, N., Muttharam, M., and Elamathi, v. 2017. Prediction of unconfined compressive strength for jointed rocks using point load index based on joint asperity angle. Geotechnical and Geological Engineering, vol. 35. 2625-2636. https://doi.org/10.1007/s10706-017-0266-0 [ Links ]
Karaman, K., Kesimafp, i.A., and Ersoy, H. 2015. A comparative study of Schmidt hammer test methods for estimating the uniaxial compressive strength of rocks. Bulletin of Engineering Geology and the Environment, vol. 74, no. 8. pp. 2393-2403. https://doi.org/10.1007/s10064-014-0617-5 [ Links ]
Khanlari, G., Rafiei, B., and Abdilor, Y. 2014. Evaluation of strength anisotropy and failure modes of laminated sandstones. Arabian Journal of Geosciences. pp. 3089-3102. https://doi.org/10.1007/s12517-014-1411-1 [ Links ]
Li, D. and Wong, L.N.Y. 2013. Point load test on meta-sedimentary rocks and correlation to UCS and BTS. Rock Mechanics and Rock Engineering, vol. 46, no. 4. pp. 889-896. https://doi.org/10.1007/s00603-012-0299-x [ Links ]
Minaeian, B. and Ahangari, K. 2017. Prediction of the uniaxial compressive strength and Brazilian tensile strength of weak conglomerate. International Journal of Geo-Engineering, vol. 8, no. 1. https://doi.org/10.1186/s40703-017-0056-9 [ Links ]
Momeni, A.A., Khanlari, G.R., Heidari, M., Sefahi, A.A., and Bazvand, E. 2015. New engineering geological weathering classifications for granitoid rocks. Engineering Geology, vol. 185. pp. 43-51. https://doi.org/10.1016/j.enggeo.2014.11.012 [ Links ]
Fanek, L. A. and Fannon, T.A. 1992. Size and shape effects in point load tests of irregular rock fragments. Rock Mechanics and Rock Engineering, vol. 25, no. 2. pp. 109-140. https://doi.org/10.1007/BF01040515 [ Links ]
Reichmuth, D.R. 1967. Point load testing of brittle materials to determine tensile strength and relative brittleness. Proceedings of the 9 th U.S.Symposium on Rock Mechanics, Golden, CO, 17-19 April 1967. American Rock Mechanics Association, Alexandria, VA. pp. 134-160. [ Links ]
Rusnak, J. and Mark, C. 2000. Using the point load test to determine the uniaxial compressive strength of coal measure rock. Proceedings of the 19th International Conference on Ground Control in Mining, Morgantown, West Virginia, 8-10 August 2000. West Virginia University. pp. 362-371. [ Links ]
Sheshde, E.A. and Cheshomi, A. 2015. New method for estimating unconfined compressive strength (UCS) using small rock samples. Journal of Petroleum Science and Engineering, vol. 133. pp. 367-375. https://doi.org/10.1016/j.petrol.2015.06.022 [ Links ]
Singh, T.N., Kainthola, a., and Venkatesh, A. 2012. Correlation between point load index and uniaxial compressive strength for different rock types. Rock Mechanics and Rock Engineering, vol. 45, no. 2. pp. 259-264. https://doi.org/10.1007/s00603-011-0192-z [ Links ]
Sundara, P.A. 2009. Correlation between uniaxial compressive strength and point-load index strength. https://doi.org/10.1017/CBO9781107415324.004 [ Links ]
Tofal, T. 2000. Nokta yükleme deneyi ile ilgili uygulamada karsilasilan problemler. Jeoloji Mühendislgi, vol. 24, no. I. pp. 73-86. [ Links ]
TS EN 13755, 2014. Natural stone test methods - Determination of water absorption at atmospheric pressure. TSE, Ankara. [ Links ]
TS EN 14579, 2006. Natural stone test methods - Determination of sound speed propagation. TSE, Ankara. [ Links ]
TS EN 1926, 2013. Natural stone test methods - Determination of uniaxial compressive strength. TSE, Ankara. [ Links ]
TS EN 1936, 2010. Natural stone test methods - Determination of real density and apparent density and of total and open porosity. TSE, Ankara. [ Links ]
Tsiambaos, G. and Sabatakakis, N. 2004. Considerations on strength of intact sedimentary rocks. Engineering Geology, vol. 72, no. 3-4. pp. 261-273. https://doi.org/10.1016/j.enggeo.2003.10.001 [ Links ]
Wijk, G., Rehbinder, G., and Lögdström, G. 1978. The relation between the uniaxial tensile strength and the sample size for bohus granite. Rock Mechanics Felsmechanik Mecanique Des Roches, vol. 10, no. 4. pp. 201-219. https://doi.org/10.1007/BF01891959 [ Links ]
 Correspondence:
D.Akbay
Email: denizegeakbay@hotmail.com
Received: 2 Feb. 2021
Revised: 1 Apr. 2021
Accepted: 13 Oct. 2021
Published: November 2021

