


Services on Demand
Article
 English (pdf)
 Article in xml format
 Article references
Indicators

Related links
-
 Cited by Google
 -
 Similars in Google
Share

 Permalink
Journal of the Southern African Institute of Mining and Metallurgy
On-line version ISSN 2411-9717
Print version ISSN 2225-6253
J. S. Afr. Inst. Min. Metall. vol.121 n.10 Johannesburg Oct. 2021
http://dx.doi.org/10.17159/2411-9717/1618/2021
ARTICLES
Correlations of geotechnical monitoring data in open pit slope back-analysis -A mine case study
A.F. SilvaI; J.M.G. SotomayorII; V.F.N. TorresII
IVale, Parauapebas, Brazil. A.F. Silva: https://orcid.org/0000-0003-1369-0103; J.M.G. Sotomayor: https://orcid.org/0000-0003-1523-1138
IIVale Institute of Technology, Ouro Preto, Brazil. https://orcid.org/0000-0002-4262-0916
SYNOPSIS
Geotechnical monitoring plays an important role in the detection of operational safety issues in the slopes of open pits. Currently, monitoring companies offer several solutions involving robust technologies that boast highly reliable data and the ability to control risky conditions. The monitoring data must be processed and analysed so as to allow the results to be used for several purposes, thereby providing information that can be used to manage operational actions and optimize mining plans or engineering projects. In this work we analysed monitoring data (pore pressure and displacement) and its correlation with the tension and displacement of the mass of an established failure slope calculated using the finite element method. To optimize the back-analysis, a Python language routine was developed using input data (point coordinates, parameter matrix, and critical section) to use software with the rock mass parameters (cohesion, friction angle, Young's modulus, and Poisson's ratio). For the back-analysis, the Mohr-Coulomb criterion was applied with the shear strength reduction technique to obtain the strength reduction factor. The results were consistent with both the measured displacements and the maximum deformation contours, revealing the possible failure mechanism, allowing the strength parameters to be calibrated according to the slope failure conditions, and providing information about the contribution of each variable (parameter) to the slope failure in the study area.
Keywords: open pit; slope failure prediction; inverse velocity technique; slope monitoring data; back-analysis.
Introduction
The extraction of minerals by open pit mining is widely practised throughout the world. In some cases, large mines with very high and steep slopes are designed to allow economic gains. However, such designs can also promote high-risk situations, such as disastrous instabilities, with critical social, economic, and environmental consequences, especially in events culminating in the loss of human life. Thus, a balance between operational security and mining economics must be sought. In this context, geotechnical studies play an important role.
During the mining process, excavation activities modify the initial stresses on the rock mass. In an effort to re-equilibrate, these stresses can cause instability, thereby enhancing the possibility of slope failures on the bench scale, inter-ramp scale, and/or mine scale. Geotechnicians must therefore consider (mainly during the operational phase) a variety of factors that can contribute to instabilities, such as increases in shear stresses with the removal of lateral support (resulting in erosion, falling blocks, and subsidence), changes in the groundwater level and corresponding increases in pore pressure, overloading of slopes, rainfall, external vibrations, and natural stress relief mechanisms with movements/displacements of the slope.
Rock mass behaviour during mining can be assessed through geotechnical monitoring with radars, topographic prisms, piezometers, and water level indicators, all of which allow the acquisition of deformation/displacement and pore pressure data and enable the water table position to be identified. To date, with technological advances and automation, these techniques have strengthened the reliability of the acquired data and increased the speed of analysis.
In the back-analysis of failure events, the monitoring data (displacements, pore pressures, and water table levels) can be correlated to calibrate the strength parameters. This approach ensures detailed analyses in geotechnical studies. Moreover, the mining geometry can be optimized, which may result in operational and financial gains for the company.
Geotechnical monitoring
Cawood and Stacey (2006) stated that slope monitoring can provide early warnings of disasters to avoid loss of life, damage to equipment, reduced production, and possibly mine closure. These considerations were subsequently corroborated by Severin et al. (2014).
According to Carlà et al. (2017), the detection of slope deformation, which can cause slope failure, is a critical aspect in the fields of geomechanics and engineering geology. However, mitigating the risk of slope failure requires knowledge of various aspects of structural geology, including the properties of the rock mass and the influences of water and other external forces in the monitored area. Severin et al. (2014) reported that slope monitoring using radars, geodetic prisms, visual observations, and other methods constitutes a key component in modern risk management programmes for most mining companies.
Moore, Imrie, and Baker (1991) noted that effective slope monitoring should incorporate two stages: investigation monitoring and forecast monitoring. Investigation monitoring should provide an understanding of the typical behaviour and response of a slope over time to external events (rainfall and seasonal variations), while forecast monitoring should generate warnings of changes in behaviour, allowing damage to be delimited or enabling interventions to be implemented to prevent dangerous landslides.
According to Eberhardt, Watson, and Loew (2008), imminent failures are prevented by using phenomenological (temporal prediction) techniques that are based on measurements of surface displacements that, if analysed and extrapolated, yield accelerations that may exceed a previously established limit based on published standards.
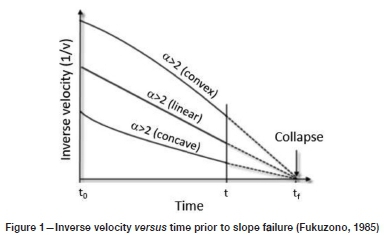
In addition, Fukuzono (1985) proposed an inverse method that consists of calculating the rate of deformation (velocity) of a slope and plotting the inverse of the rate of deformation as a time function (inverse velocity versus time). This technique has been mentioned frequently in the literature (Rose and Hungr, 2007; Osasan and Stacey, 2014; Intrieri and Gigli, 2016). As the velocity or rate of deformation increases, the inverse will tend towards zero. With the use of linear regression, the intersection with the horizontal axis can be obtained; this intercept represents the expected time of collapse (Figure 1).
According to Venter, Kuzmanovic, and Wessels (2013), predictions of the expected collapse time are an important aspect of managing the stability of an open pit since such determinations enable appropriate actions to be taken. However, Severin et al. (2014) noted that false alarms resulting from data acquired from instrumentation and the uncertainties in this data constitute a problem. If an alarm is triggered and a failure occurs, the procedure is a success; otherwise, a false alarm can result in costs associated with stopping and delaying production in addition to a loss of faith in the system.
Stacey, Franca, and Beale (2018) postulated that the main differences among the applications of various monitoring methods can be attributed to the types of failures that can be anticipated. For example, hard, fractured rocks are predisposed to the rapid development of failures and rockfalls, whereas weak rocks fail more slowly, reflecting the occurrence or initiation of plastic deformation.
Most mining companies have modernized their conventional monitoring systems though automation and/or implementing advanced technologies such as radars (terrestrial radars and interferometric synthetic aperture radar (InSAR), global positioning systems (GPS, global navigation satellite systems (GNSS)), robotic stations, piezometers (electric, vibrating wire, pneumatic), and other instruments that reduce the time needed for data acquisition and boast greater reliability. In addition, these updated systems do not expose people to areas of risk (Benoit et al., 2015; Brown, Kaloustian and Roeckle, 2007; Atzeni et al., 2015; Dick et al., 2015; Stacey, Franca, and Beale, 2018; Carlà et al., 2018).
Case study
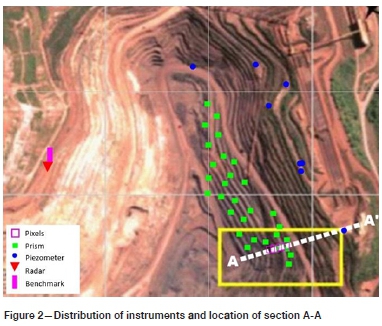
The investigated slope is situated on the east wall of the open pit. In 2017, a failure occurred, involving approximately four benches and the mass movement of material to lower benches. The affected area is shown within the yellow rectangle in Figure 2.
Geological aspects
The study area is located within the geological domain of the Parauapebas and Carajás formations. The former is composed of generally altered metabasic volcanic rocks (basalts and diabases), while the latter contains ore represented by intercalated thick layers of jaspilites and lenses of soft and hard haematite (iron ore) cut by dykes and sills of basic rock. The main geological and structural properties of the eastern sector of the open pit are dominated by a shear zone of ductile to ductile-brittle character with a general strike ranging from E-W to NE-SW. This shear zone constitutes a weak surface that forms the contact between the haematite formation and the metabasic rocks. Dykes (discordant, with a thickness reaching 20 m and striking approximately N and NE) and a sill (with a thickness ranging from 0.5 m to 3.0 m) also occur. The sill underwent a significant failure event in 2017.
Hydrogeological aspects
The groundwater level was efficiently depleted by the mine drainage system. In metabasic and altered rocks (mafic (MS), semi-decomposed mafic (MDS), and the decomposed mafic sill (MD)), the rock mass was assumed to be partially drained, a situation that occurs at a certain distance from the slope surface where the groundwater level drops in advance of the excavation, mainly by the escape of fluids through fractures.
2017 geotechnical event
During geotechnical inspections in February 2017, cracks were observed on the upper slope in the eastern area of the open pit, below the main ramp. The area is characterized by geological, structural, and geotechnical properties that increase the risk of failure events, especially during the rainy season. Thus, taking into account these aspects in conjunction with regular geotechnical inspections, which include a network of prisms, piezometers, and groundwater level sensors to identify risk indicators, a terrestrial radar was installed to gain a deeper understanding of the deformational behaviour of the slope. This area presents geological structural and geotechnical conditions that can lead to instability, with some events having occurred in previous years (2007 and 2013).
The installed instrumentation showed variations in the measurements, mainly in the radar. However, the deformation/ displacement process accelerated only 24 hours before the collapse, which occurred at 08:50 on 12 March 2017.
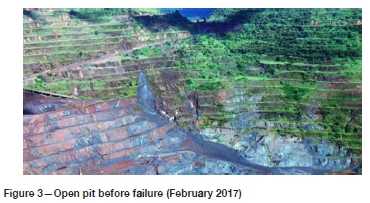
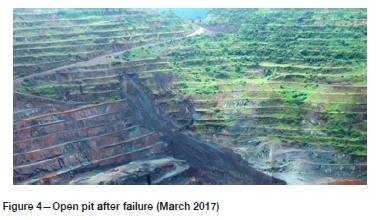
The failure mode was considered planar/circular, with the mechanism developed in the contact between friable materials, the friable haematite (HF) with high permeability, and MD that exists along the entire eastern flank, which is a very low permeability material. The failure surface extended over a height of approximately 60 m. Figures 3 and 4 show the situation before failure and after failure, respectively.
Methodology
Data collection and analysis
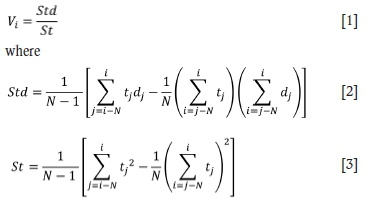
The information applied in this study is based on failure histories, topographic surveys, geotechnical mapping, geological (structural) data, laboratory testing, geotechnical monitoring (piezometric, groundwater level, prism, and surface radar data), and rainfall data. For the prism data, the horizontal displacement vector was utilized in the analysis. The data was filtered to identify possible measurement errors and/or noise. In the case of the rate of displacement (velocity), filtering was performed through linear regression analysis, as suggested by Rose and Hungr (2007).
The results of the displacement monitoring are collected as time series, t1... ti, d1... di, where ti and di are the most recent time and displacement, respectively, and N is the number of observations. Thus, the current rate of displacement is given by:
For the radar data, no filtering of the variables (deformation, velocity and inverse velocity) was performed as this data was extracted directly from the results produced by the software. Thus, the probable periods of collapse were established through analyses of graphs, and the findings were subsequently compared with actual collapse data. Table I describes the instruments used in the back-analysis together with the measurement period.
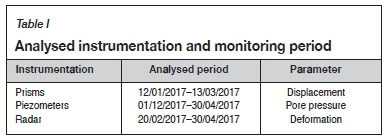
Figure 2 illustrates the location of the instruments on the east flank of the central pit and the section utilized for the back-analysis. The differences in the topography before (28/02/2017) and after (30/03/2017) the event were considered to define the failure surface with the highest possible precision.
In this work, rainfall was considered an equal contributor with the structural conditions in the area (MD). Although the pore pressure varied during the rainy season, the water table was fixed in the back-analysis, and the last measurement obtained with the closest piezometer to the affected region was the level selected to calibrate the strength and elasticity parameters. The recorded pore pressure value was 45.202 mH2O at 08:27 on 13/03/2017, with a groundwater level of 646.901 m.
The Mohr-Coulomb failure criterion was employed in the back-analysis, and the materials within the failure surface (HF and MD) were considered perfectly plastic; the other materials were considered elastic with no variations in their parameters. The back-analysis was performed using RS2 9.0 (Rocscience) software, and the parameters were determined through the finite element method (FEM) to calculate the stresses and displacements in the rock mass using the shear strength reduction (SSR) technique (Matsui and San, 1992) to identify the strength reduction factor (SRF). The critical SRF is defined as the point when the analysis fails to converge and the deformation increases very quickly. Accordingly, the strength parameters (Table II) were obtained from laboratory tests on samples collected in the mine in campaigns from years prior to this work.
The calibration limits (Table III) were established in accordance with the maximum and minimum values obtained from the database of laboratory test results in campaigns prior to this study.
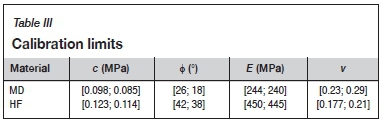
For this study, a routine was written in the Python programming language to assess n sets of variables, namely, the c (cohesion), E (friction angle), E (Young's modulus), and v (Poisson's ratio) of MD and HF. These variables, (which were calibrated n times), were chosen based on their important role in the failure process and to provide the displacement responses of the radar pixels within the line of sight of the equipment. The Python routine uses the X, Y, and Z coordinates of the top and bottom positions of the section in addition to the coordinates of the pixels and position of the radar.
A matrix was generated as the input with 100 combinations of the cohesion, friction angle, Young's modulus, and Poisson's ratio. The predicted displacements were compared with the measured displacements. This process was repeated until, for a given set of input parameters, the predicted displacements approached the measured displacements with an acceptable error of approximately 5%.
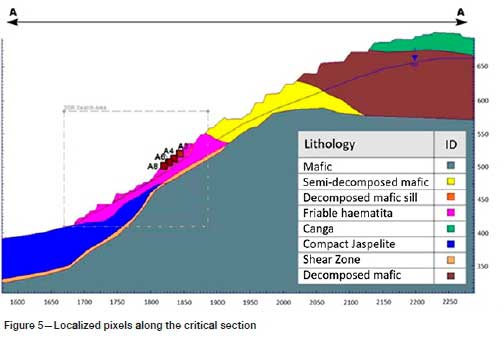
To calibrate the displacements, the pixels imaged along the critical section (Figure 2) were chosen, and their behaviour (trends, cycles, and oscillations) analysed according to the date available prior to the failure. The radar operates using the phase variation between two scans. These measurements are applied to calculate the displacement of the slope surface; the displacement vector is not used for prism monitoring. Table IV presents information about the pixel size, distance to the radar, and values measured at a time near collapse.
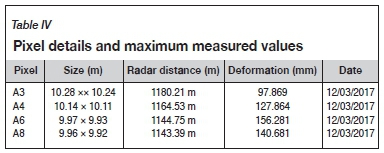
Figure 5 presents the critical section modelled with the materials in the study area, namely the data obtained through geotechnical mapping and field observations. The failure surface, with a thickness of approximately 2 m, is defined, involving the contact between the HF and the MD, with the latter playing a significant role in the failure process. The contact between the materials was modelled taking into account the geological model, geotechnical mapping, and field observations after failure.
Results and discussion
Geotechnical monitoring data
During the rainy season of 2017 (November 2016 to April 2017), the total rainfall reached 1311.10 mm, with a maximum of 920.5 mm before failure. The high rainfall resulted in recharge and saturation in the MD.
The rain that fell on the previous days (a daily amount of 72 mm) contributed to the triggering of the failure, enabling movement accelerations on 11/03/2017 and 12/03/2017, as shown in the graph in Figure 6.
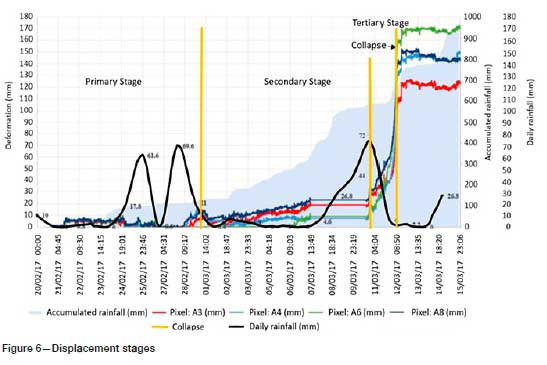
Event prediction was performed using the inverse velocity technique proposed by Fukuzono (1985). This method establishes that the time needed to accelerate the failure, while taking into account the gravitational load, is inversely proportional to the rate of deformation (velocity). In this analysis, the date corresponds to a period of 24 hours, which initially did not show a tendency towards imminent failure until 03/11/17. The deformation was continuous, however, without progressive acceleration.
Figure 7 demonstrates that the deformation started to change at approximately 05:00 on 03/12/17, with a tendency to collapse between 08:49 and 11:30, a forecast very close to the actual time of failure.
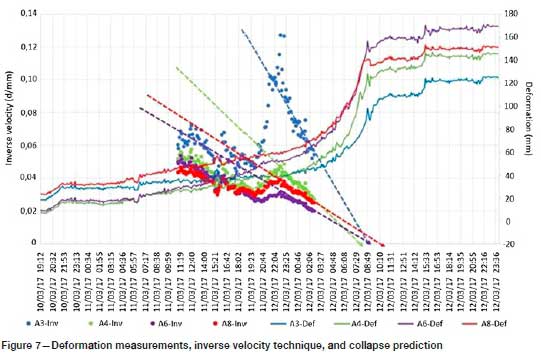
The deformation rates in this short period were so high that, in less than 4 hours from the onset of acceleration, the rock mass lost its strength, causing the slope to fail.
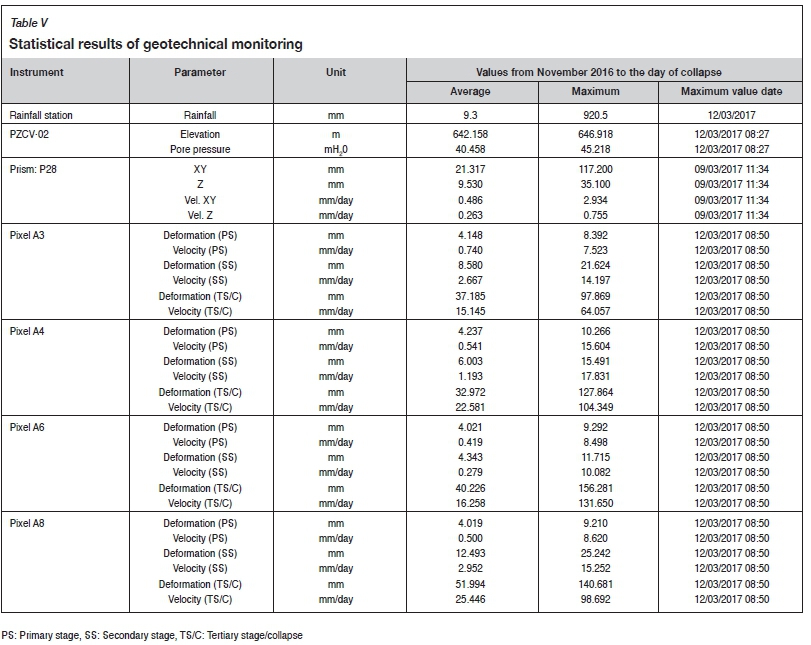
The monitoring data showed precise values. Consequently, analysis of the data enabled not only an intervention in the study area but also a back-analysis to evaluate the correlation and the deformational behaviour of the slope. Table V shows the resulting maximum and average values for all the monitoring data from the failure.
Back-analysis
The results of a series of back-analysis calculations showed SRF values varying between 1.11 and 0.87. The maximum displacements were concentrated near SRF = 0.95.
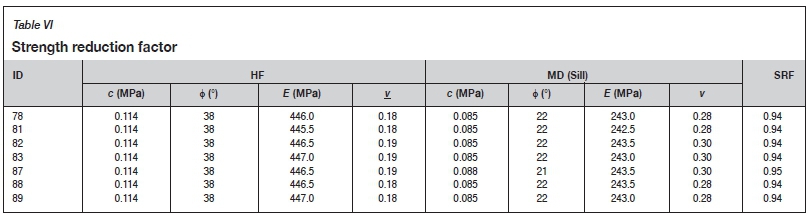
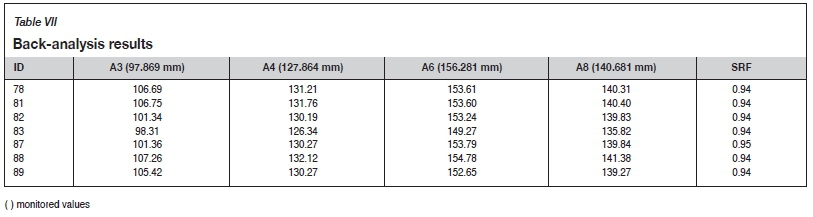
The cohesion, friction angle, Young's modulus, and Poisson's ratio for materials HF and MD varied; these parameters remained constant for the other materials present in the modelled section. The analysis showed that seven series had displacement values similar to those measured in the area (pixels) at the moment of collapse (Tables VI and VII). According to the acceptability criterion defined for this study, which establishes ±5% variation between the measured displacements and the calculated displacements, the series with IDs 78, 81, 88, and 89 were discarded. Therefore, the values calculated for pixel A3 were not acceptable.
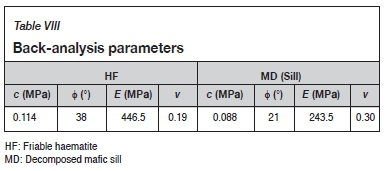
For the remaining three series, the model was calibrated with the set of parameters containing the smallest variation between the measured displacements and the calculated displacements using the pixels at the base of the slope (in this region, the stress concentrations are higher, and in this case, allow greater displacements). Thus, the set of parameters for ID = 87 presented these conditions (Table VIII).
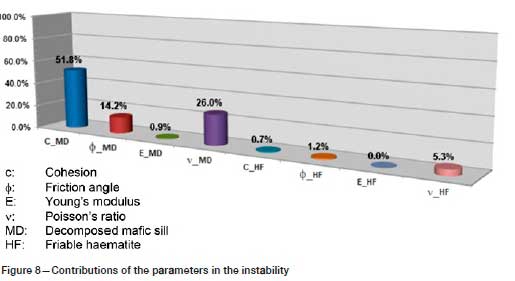
The results obtained from the back-analysis and statistical data show that the variables (parameters) with the greatest contributions to the failure were the cohesion, friction angle, and Poisson's ratio, which influenced the MD (approximately 93%) more than the HF (Figure 8).
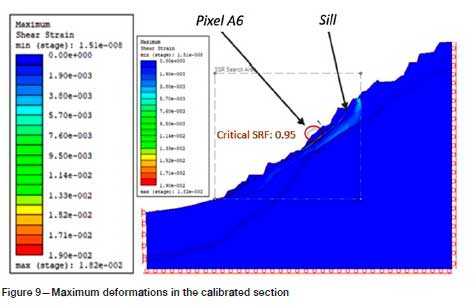
The maximum deformations obtained at the time of failure were calculated from the calibrated parameters, considering that the failure mechanism developed along the contact between the MD and the HF.
The maximum displacements were observed at pixel A6, with a calculated displacement of 153.79 mm and measured displacement of 156.281 mm, thereby defining the region with the greatest acceleration. The collapse originated in this region.
Figure 9 presents the critical section analysed with the calibrated parameters, failure surface defined in the sill, and area where the displacements initiated the collapse.
Conclusions
Rainfall played an important role in the failure event and led to mass saturation and lubrication of the HF/MD sill contact and pre-existing cracks. These processes were pronounced due to the ineffectiveness of the operational drainage system. The rainfall and failure mechanism already established in the flank of the pit acted simultaneously to trigger the event.
The back-analysis using the SSR technique revealed a good correlation between the calculated data and the data measured with ground radar, and the evaluated parameters were acceptably estimated. In this study, the prism data alone was not sufficient for the analysis, but the use of the SSR technique with this data (vectors) could provide more effective parameter calibration than that with ground radar data. Regardless of the type of monitoring, the SSR technique is relevant for calibrating the strength parameters and providing information about the development of the failure mechanism. This information will be particularly helpful for geotechnicians in the evaluation of future projects in the area.
The statistical analysis of the contributions of the strength and elasticity parameters from the back-analysis was not conclusive in relation to Poisson's ratio and Young's modulus for MD sill material. Notably, the divergent representativeness of the results suggests that more detailed studies of these parameters for this type of material are needed for similar failure events.
In general, a circumspect analysis of geotechnical monitoring data serves as a tool for better understanding the deformational behaviour of a slope and provides a more assertive and preventive approach to avoid failures, or if a failure is imminent, to reduce the impacts.
Acknowledgements
We thank Vale S.A. for making the data available and Institute Technologic Vale for guiding and supporting this work.
Contributions
Aristotelina Ferreira Silva carried out the study.
Juan Manuel Girao Sotomayor wrote the manuscript and supervised the study.
Vidal Félix Navarro Torres supervised the study.
References
Atzeni C., Barla M., Pieraccini M., and Antolini F. 2015. Early warning monitoring of natural and engineered slopes with ground-based synthetic-aperture radar. Rock Mechanics and Rock Engineering, vol. 48, no.1. pp. 235-246. [ Links ]
Benoit, I., Briole, P., Martin, O., Thom, C., Malet, J.P., and Ulrich, P. 2015. Monitoring landslide displacements with the Geocube wireless network of low-cost GPS. Engineering Geology, vol. 195, pp. 111-121. [ Links ]
Brown, N., Kaloustian, S., and Roeckle, M. 2007. Monitoring of open pit mines using combined GNSS satellite receivers and robotic total stations. Proceedings of the International Symposium on Rock Slope Stability in Open Pit Mining and Civil Engineering. Perth. Potvin, Y. (ed.). Australian Centre for Geomechanics, University of Western Australia, Nedland. pp. 417-429. [ Links ]
Carla, T., Farina, P., Intrieri, E., Botsialas, Ic, and Casagli, N. 2017. On the monitoring and early warning of brittle slope failures in hard rock masses: Examples from an open-pit mine. Engineering Geology, vol. 228. pp. 71-81. [ Links ]
Carla, T., Farina, P., Intrieri, E., Ketizmen, H., and Casagli, N. 2018. Integration of ground-based radar and satellite InSAR data for the analysis of an unexpected slope failure in an open-pit mine. Engineering Geology, vol. 235. pp. 39-52. [ Links ]
Cawood, F.T. and Stacey, T.R. 2006. Survey and geotechnical slope monitoring considerations. Journal of the South African Institute of Mining and Metallurgy, vol. 106, no. 7. pp. 495-501. [ Links ]
Dick, G.J., Eberhardt, E., Cabrejo-Lévano, A.G., Stead, D., and Rose, N.D. 2015. Development of an early-warning time-of-failure analysis methodology for open-pit mine slopes utilizing ground-based slope stability radar monitoring data. Canadian Geotechnical Journal, vol. 52, no 4. pp. 515-529. [ Links ]
Eberhardt, E., Watson, A.D., and Loew, S. 2008. Improving the interpretation of slope monitoring and early warning data through better understanding of complex deep seated landslide failure mechanisms. Landslide and Engineering Slopes: From the Past to the Future. Chen, Z., Zang, J., Li, Z, Wu, F., and Ho, K. (eds). Taylor and Francis, London. [ Links ]
Fukuzono, T. 1985. A new method for predicting the failure time of a slope. Proceedings of the Fourth International Conference and Field Workshop on Landslides. Japan Landslide Society, Tokyo. pp. 145-150. [ Links ]
Intrieri, E. and Gigli, G. 2016. Landslide forecasting and factors influencing predictability. Natural Hazards and Earth System Sciences, vol. 16, no 12. doi:10.5194/nhess-16-2501-2016 [ Links ]
Matsui, T., and San, K C. 1992. Availability of shear strength reduction technique. Proceedings of the Conference on Stability and Performance of Slopes and Embankments II, Berkley, CA. American Society of Civil Engineers, New York. pp. 445-460. [ Links ]
Moore, D.P., Imrie, A.S., and Baker, D.G. 1991. Rockslide risk reduction using monitoring. Proceedings of the Canadian Dam Association Meeting, Whistler, BC. National Research Council Canada. pp. 245-258. [ Links ]
Osasan, K.S. and Stacey, T.R. 2014. Automatic prediction of time to failure of open pit mine slopes based on radar monitoring and inverse velocity method. International Journal of Mining Science and Technology, vol. 24, no 2. pp. 275-280. [ Links ]
Rose, N.D. and Hungr, 0. 2007. Forecasting potential rock slope failure in open pit mines using the inverse-velocity method. International Journal of Rock Mechanics and Mining Sciences, vol. 44. pp. 308-320. [ Links ]
Severin, J., Eberhardt, E., Leoni, I., and Fortin, S. 2014. Development and application of a pseudo-3D pit slope displacement map derived from ground-based radar. Engineering Geology. vol. 181. pp. 202-211. [ Links ]
Stacey, P., Franca, P., and Beale, G. 2018. Design implementation and operational consideration. Guidelines for Open Pit Slope Design in Weak Rocks. Vol. 1.: Martin, D.and Stacey, P. (eds). CSIRO Publishing, Clayton, Australia. [ Links ]
Venter, J., Kuzmanovic. A., and Wessels, S. 2013. An evaluation of CUSUM and inverse velocity methods of failure prediction based on two open pit instabilities in the Pilbara. Slope Stability 2013: Proceedings of the 2013 International Symposium on Slope Stability in Open Pit Mining and Civil Engineering, Brisbane, Australia. Dight, P.M. (ed.). Australian Centre for Geomechanics, Perth. pp. 1061-1076. https://doi.org/10.36487/ACG_rep/1308_74_Venter [ Links ]
 Correspondence:
J.M.G. Sotomayor
Email: juan.sotomayor@itv.org
Received: 12 May 2021
Revised: 31 Aug. 2021
Accepted: 6 Sep. 2021
Published: October 2021
This paper was first presented at the Mine-Impacted Water from Waste to Resource Online Conference, 10 and 12, 17 and 19, 3 and 24 November 2020

