


Services on Demand
Article
 English (pdf)
 Article in xml format
 Article references
Indicators

Related links
-
 Cited by Google
 -
 Similars in Google
Share

 Permalink
Journal of the Southern African Institute of Mining and Metallurgy
On-line version ISSN 2411-9717
Print version ISSN 2225-6253
J. S. Afr. Inst. Min. Metall. vol.121 n.8 Johannesburg Aug. 2021
http://dx.doi.org/10.17159/2411-9717/1491/2021
PROFESSIONAL TECHNICAL AND SCIENTIFIC PAPERS
UG2 pillar strength: Verification of the PlatMine formula
B.P. WatsonI; W. TheronII; N. FernandesII; W.O. KekanaII; M.P. MahlanguII; G. BetzII; A. CarpedeI
IUniversity of Witwatersrand, South Africa. B.P. Watson: https://orcid.org/0000-0003-0787-8767
IINortham Platinum, South Africa
SYNOPSIS
The research described in this paper was done to confirm the Upper Group 2 (UG2) PlatMine peak pillar strength formula (Watson et al., 2007), which was determined from a back-analysis of failed and unfailed pillars. Underground measurements were made on a stable pillar that was loaded by firstly reducing it's length and then by mining the surrounding pillars until pillar failure took place. The pillar was instrumented with suitably positioned strain cells and closure meters, which allowed both the average pillar stress and strain to be determined. The paper describes the methodology applied to identify a suitable position for the instrumentation, as well as the results. A stress/strain curve is presented for a UG2 pillar with a w/h ratio of 2.0, at Booysendal Platinum Mine. The measured pillar strength was similar to the predicted strength using the PlatMine pillar strength formula for UG2 pillars. The PlatMine formula has been successfully implemented on Booysendal Platinum Mine, and about 3 670 pillars have been cut without a single failure. An additional revenue of US$1.3 billion was calculated for the 25-year life of the mine as a direct result of the improved pillar design, given the January 2020 platinum group metals basket price. An extended life of mine and better mining efficiencies will also be realized.
Keywords: Pillar strength, UG2, PlatMine formula, chromitite, stress measurements, in-situ pillar behaviour, mining-efficiency, socio-economic benefit.
Introduction
Mechanization of the Bushveld Comlpex platinum mines has resulted in an increase in bord-and-pillar mining, particularly in the newer, shallow-depth mines on the eastern side of the Complex. The Upper Group 2 (UG2) chromitite pillars have been designed for many years using the Hedley and Grant (1972) formula to determine peak pillar strength. Generally the k-value in the formula (Equation [1]) is reduced to 35 MPa for these mines (Fernandes, 2020), which is about a third of the uniaxial compressive strength (UCS) of the pillar material (Malan and Napier, 2011).
where k = rock mass strength (35 MPa), w = pillar width, and h = pillar height.
However, the formulation of the equation is based on a large number of unproven assumptions, and its application to the design of pillars in the Bushveld Complex is questionable (Malan and Napier, 2011). A potential consequence of using this uncertain methodology is the cutting of oversized pillars, which lowers the extraction ratio. There is a need, therefore, to optimize pillar sizes, based on an understanding of UG2 pillar behaviour. The PlatMine pillar strength formula (Watson et al., 2007) is based on a back-analysis of failed and unfailed pillars on the UG2 Reef. It suggests that pillar strengths are greater than predicted by Hedley and Grant (1972), if a downrated k-value of 35 MPa is assumed in the Hedley and Grant (1972) formula. The PlatMine formula is as follows (Watson et al., 2007):
The derivation of this formula is described in a separate paper (Watson, Lamos, and Roberts, 2021). In summary, it was based purely on a regression analysis of failed and unfailed pillars, where elastic modelling was used to determine the pillar stresses. In the analysis, failed and unfailed pillar stresses over- and underestimated pillar strength, respectively. A maximum likelihood regression was used to bias the failed and unfailed pillars to the lowest and highest values, respectively. Although the formula has been available for some time there was scepticism as regards its use because there were no pillars in the database for which the actual stress at failure was known. Therefore, none of the UG2 platinum mines used the PlatMine formula (Watson et al., 2007). Booysendal (Pty) Limited wanted to use it because of the better extraction ratios it offered compared to the method according to Equation [1] (k = 35 MPa), which was being used at the time. In addition to the general scepticism, the pillar heights at Booysendal (2.5 m to 2.8 m) were slightly greater than the range in the database (1.5 m to 2.0 m). It was therefore considered necessary to instrument and monitor a pillar and load it to failure. The results of this investigation are described in the paper. To the best of the authors' knowledge, no other such investigations have been successfully completed on UG2 pillars.
Instrumentation was installed to determine the:
> Pillar stress at the start of the project
> Stress change during mining
> Deformation of the pillar.
The instrumentation results were used to construct a stress/ strain curve for the pillar.
Instrumentation site
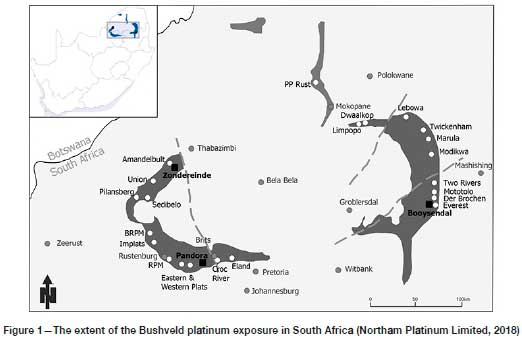
A site was set up on a bord-and-pillar working at Booysendal Platinum Mine, on the eastern side of the Bushveld Complex southwest of the town of Mashishing (Figure 1).
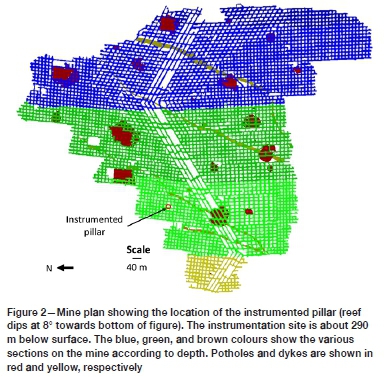
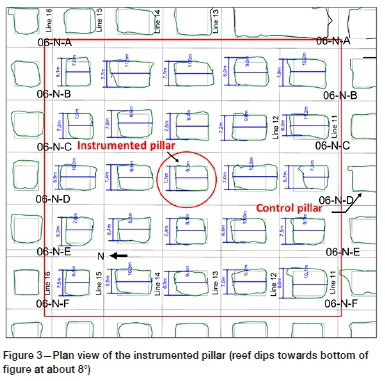
The instrumentation site was about 290 m below surface and is shown in context with the rest of the mine in Figure 2. The figure shows the mining face positions at the start of the project. Little effect of face advance was measured on the pillar stress during the monitoring period. The stress was increased by firstly mining the pillar smaller and subsequently mining out the surrounding pillars until pillar failure occurred. A comparison between Equation [2] and the stress determined by an elastic model was used to define the size of the final pillar and the amount of mining required on the surrounding pillars to cause the instrumented pillar (IP) to fail. The size and shape of IP and the surrounding pillars at the start of the project are shown in Figure 3. The reef dip was about 8°.
Pillar loading
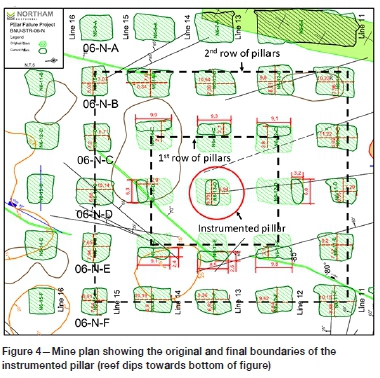
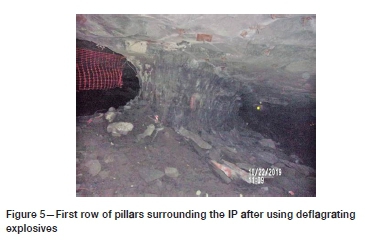
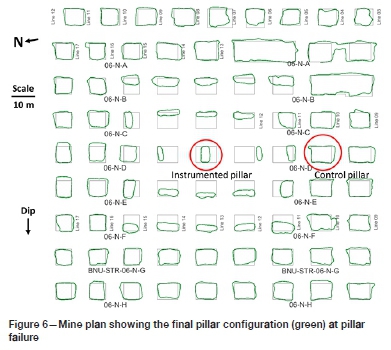
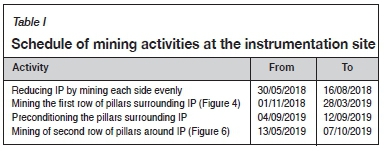
Initially the IP was gradually reduced in size until the final size and shape shown in Figure 4. Subsequently, the surrounding pillars (first row of pillars) were progressively mined to the sizes shown in Figure 4. Some of the surrounding pillars did not fail, and failure had to be induced using low-energy deflagrating explosives (Figure 5). Finally, the pillars in the second row were mined to about half their original size (Figure 6), at which point failure occurred on the instrumented pillar. The schedule of mining activities at the instrumentation site is summarized in Table I.
Elastic numerical modelling
The surface profile at the site was mountainous and the effects of this topography were included in the MAP3D elastic boundary element modelling (Wiles, 2017). An average rock density of 3 000 kg/m3, a k-ratio of unity, Young's Modulus of 85 GPa, and Poisson's ratio of 0.33 were used as input parameters to the model. The elastic constants were determined by uniaxial laboratory tests. In the model, the top of the highest mountain was used as the initial level of surface. A surface length of five times the mining length (in plan) was used all around the mining area and a grid size of 10 m x 10 m was used to evaluate the surface effects. As a first step, the surface was mined out using fictitious force elements to produce the actual topography profile and the virgin stress condition of the reef. The second mining step involved the mining of the reef using displacement discontinuity elements. A grid size of 0.5 m was used to adequately determine the pillar stresses. Subsequently, a second, smaller model was run covering sufficient area around the instrumentation site on a 0.25 m grid. The depth and horizontal stress inputs on the second model were modified to provide the same levels of stress as shown by the first model. An initial horizontal to vertical stress ratio (k-ratio) of unity was assumed, and as a result of mining the surface topography the k-ratio increased to about two.
The second model was used to determine the stress changes that occurred on the IP as it was mined smaller and the surrounding pillars were reduced in size. Benchmark lines were constructed in the model to simulate the measurement boreholes that were drilled over the instrumented pillars. Factors relating the average pillar stress (APS) to point stresses were determined at the positions where the stress measurements were made. Several stages of mining were evaluated.
Geology surrounding the pillar site
The geology at the site needed to be considered when determining the optimum position of the strain cells to determine the APS and stress change during mining. Of particular interest was the abrupt parting between the pyroxenite and leuconorite about 3 m above the hangingwall (Figure 7), as this interface is often the location of parting in the bords. This parting plane is locally known as the Upper Pyroxenite Contact (UPC). The composition of the IP and the surrounding pillars (all about 2.55 m high) is also shown in the figure.
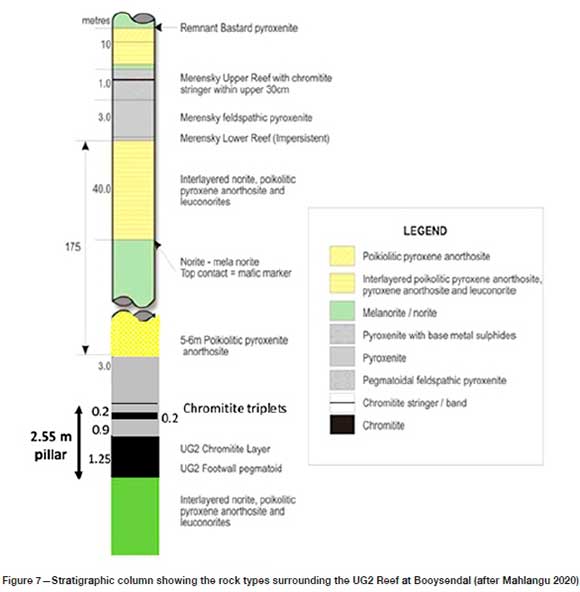
The 2.55 m high pillars extended from the norite footwall up to the triplets, and included several layers of pyroxenite. The immediate pillar hanging- and footwall materials were pyroxenite and norite, respectively (Figure 7).
Geomechanical properties
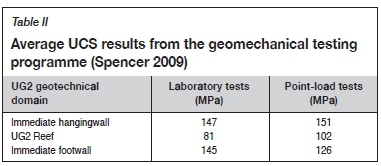
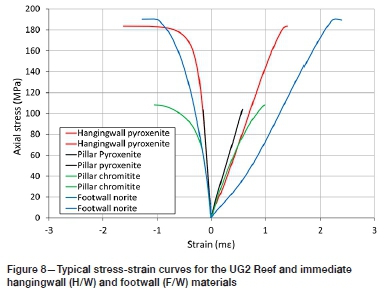
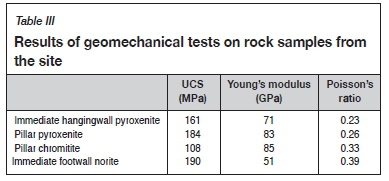
In 2009, a geomechanical testing programme was conducted at the mine on rock samples from the UG2 reef and the immediate UG2 hangingwall and footwall (Spencer 2009). Some 700 point-load samples were selected from 61 boreholes and 40 UCS samples from seven boreholes across the mine. The UCS tests were done by Rocklab in Pretoria in accordance with ISRM standards. The average results are shown in Table II. It should be noted that half of the 16 laboratory UCS samples from the UG2 chromitite reef failed on discontinuities, which would have resulted in an underestimation of UG2 strength (81 MPa). The UCS provided by the point load results is therefore probably more accurate (102 MPa). The UCS values for the immediate foundation to the pillars at the instrumentation site were about 147 MPa and 145 MPa for the hangingwall and footwall, respectively. Typical stress-strain curves from the three rock types at the instrumentation site are shown in Figure 8. The elastic constants for these tests are provided in Table III.
Design of stress measurements
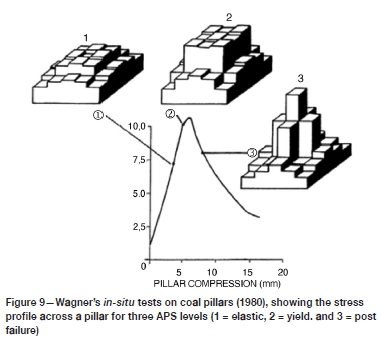
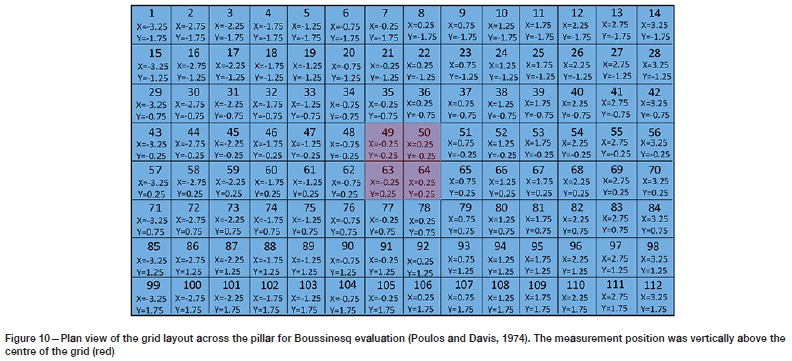
The aim of the stress measurements was to determine the APS of the instrumented pillar from a stress measured at a point in a borehole somewhere above the pillar. It was important that this point should be high enough to determine the APS accurately, whether the stress profile was for a failed or unfailed pillar. Wagner's in-situ tests on coal pillars (1980) showed that stress concentrations change during pillar loading (Figure 9). A matrix of Boussinesq equations (Poulos and Davis, 1974) was set up, using Equation [3] and the grid provided in Figure 10, to determine the effects of failed and unfailed stress profiles on the measurements. For the purposes of the calculations, the reef and measurements were rotated by eight degrees so that the top surface of the pillar could be considered horizontal. A plan view of the Boussinesq coordinate system used across the top boundary of the pillar is shown in Figure 10.
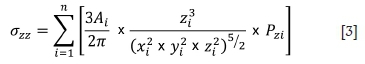
where: σzz= stress at a point in space; Ai = area of the grid 'i'; and pzi= vertical stress carried by the grid 'i'.
Typical profiles of failed and unfailed pillars were determined from the results of measurements made on the Merensky Reef (Watson, Kuijpers, and Miovsky, 2008) and an elastic model, respectively. The profiles were normalized to their respective APS values as shown in Figure 11, and applied across the width of the grid in Figure 10. A series of heights above the centre of the grid were evaluated using Equation [3]. The resulting stresses of failed and unfailed pillars at each of the investigation points were normalized against APS and expressed as a percentage (Figure 12). The percentage difference between the failed and unfailed pillar values at an investigation point was considered to be an indication of the accuracy of the measurement.
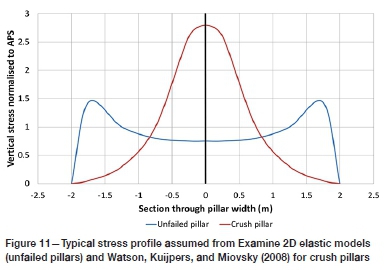
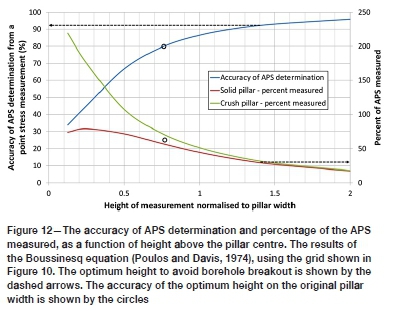
Figure 12 shows a trade-off between the accuracy and percentage of the APS measured with height above the pillar. For example, a measurement height of 1.2 times the pillar width will allow only about 40% of the APS level to be measured. Thus at a peak strength of 160 MPa, the strain cell would measure 64 MPa. However, if the APS dropped to about 20 MPa after failure, which is shown by Merensky crush pillars of that size (Watson, Stacey, and Kuijpers, 2010), the cell would measure 8 MPa. The aim of the exercise would be to maximize the measured residual stress, but not to position the strain cells too close to the pillar so as to measure only a portion of the stress profile (and not the APS), or cause borehole breakout before pillar failure. The optimum cell position was found to be about 1.2 times the pillar width. However, the maximum stress at the measurement point needed to be kept to below 50 MPa to avoid borehole breakout. The height at which the critical 50 MPa value was reached was found to be about 1.4 times the pillar width. At this height, the stress measurement accuracy was about 92%, for the final pillar width of 3.94 m. However, for the same height of measurement, the accuracy was 80% for the initial 7.1 m wide pillar (shown by the circles in Figure 12). A compromise height of 6.2 m above the pillar was used to improve the stress measurements when the pillar was in its original size. This height was about 1.6 times the final pillar width and yielded a stress accuracy of about 94% at the final pillar width.
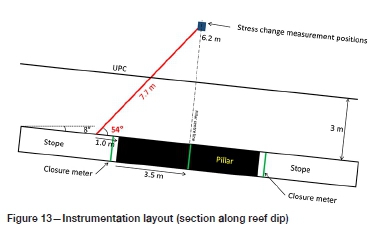
Instrumentation layout
Several strain cells were installed along the 7.7 m long borehole shown in Figure 13, to determine the APS level at the start of the monitoring period. A stress change measurement cell was installed at the final position at about 6.2 m above the pillar. Closure meter instruments were installed at the centres of the pillar sidewalls, in plan view.
During the narrowing of the pillar, pillar deformation was measured by closure stations on the up- and down-dip sides of the pillar. Once the pillar had been mined down to its planned size, two further closure meters were installed so that there was a station adjacent to each of the four pillar sidewalls. The closure results were averaged and used to determine the pillar strain.
Instrumentation results
Field stress measurements over the IP
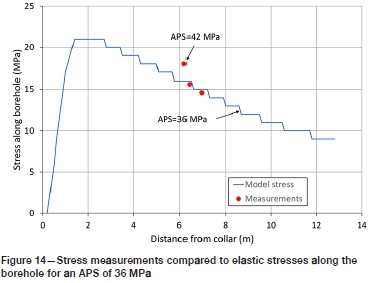
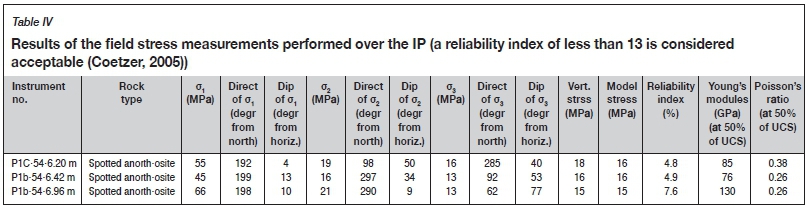
At the start of the project, field stress measurements were done on the IP to determine the actual stress levels of the original 7.1 m X 9.3 m pillar. These measurements were made in the 7.7 m long hole used for the final stress change instrument (Figure 13). The vertical stress results are shown in Table IV. In Figure 14, these results are compared to the vertical elastic model results for the same borehole. All three of the measurement results were made above the UPC. Since the elastic model did not account for the UPC, it is clear from the good correlation between the measurements and the model, that the UPC did not significantly affect the stress results. At the time of the field stress measurements, the model predicted an APS of 36 MPa (starting stress), which was confirmed by the good correlation with the measurements in Figure 14.
Stress change measurements over the IP
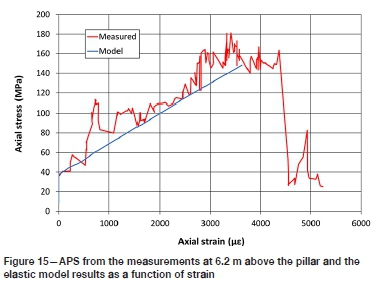
The elastic model was used to determine both the APS and corresponding vertical stress at 6.2 m above the pillar centre, for various pillar sizes (to account for the pillar size reduction during monitoring). Factors were determined from the relationship between these two stresses to evaluate the measured stress change at each pillar size; i.e. these factors were used to backanalyse the APS from the vertical stress-change measurements. A final factor (once the narrowing of the IP was complete) was used to measure the stress build-up due to the mining of the surrounding pillars. The stress change measurements were added to the initial APS and a stress-strain curve was created using the total stress versus the accompanying closure results. Figure 15 shows the stress-strain curve for the IP using this evaluation process. Notice the similarity of the measurements to the elastic result produced by the numerical model, which is shown in the same figure.
Comparison between the instrumentation results and those from the PlatMine UG2 pillar strength formula
Since the IP was a rectangular pillar, an effective pillar width (we) was required to provide for the strengthening effects of the pillar length. The widely used 'perimeter rule', described by Wagner (1974), was used:

where w and L are the pillar width and length, respectively. Using Equation [4], the welh ratio for the final IP was calculated to be 2.0. Using Equation [2], the strength was calculated to be 148 MPa. It is clear from Figure 16 that the measured stress at failure for the IP was close to the calculated strength.
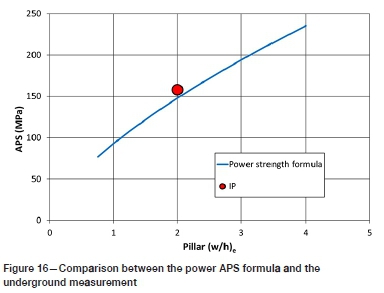
Note the unexpectedly high residual strength for a pillar with a w/h ratio of 2.0. The curve suggests a residual strength of about 30 MPa, but further reductions in strength could have occurred with time if measuring had continued.
Implementation at Booysendal
Booysendal has been using the PlatMine pillar strength formula (Watson et al., 2007), with a FoS of 1.6, for three years without a single pillar failure (i.e. Condition Codes CC3, CC4, or CC5). During this time, an area of 900 000 m2 has been mined, amounting to about 3 670 pillars, designed on the Platmine formula (Watson et al., 2007). These pillars were cut in the height range between 2.2 m and 2.8 m. The success of the PlatMine formula (Watson et al., 2007) at Booysendal adds confidence to the validity of this formula within the range of the database. The formula provides for smaller pillars without compromising safety, within the range of the database.
As a direct result of implementing the PlatMine formula (Watson et al., 2007) for pillar design, the mine will realize R20 billion (US$1.3 billion) in additional revenues over the 25-year life of the mine (Nothnagel, 2020), assuming a rand/ dollar exchange rate of 15:1 (Exchangerates, 2020). The value was calculated using the January 2020 prices for the platinum group metals, produced by the mine (rands per ounce) and the average grade on the mine. Additional benefits include a further 2.6 years life-of-mine and improved efficiencies for underground transportation of ore (Nothnagel, 2020). The application of the 'new' formula fits the policies of the Minerals Council South Africa in almost every respect (van der Woude, 2019), without additional costs. There are also additional benefits.
> Socio-economic impact
• A platinum ounce (includes the basket of platinum group metals for Booysendal) costs approximately R25 000 (van Schalkwyk, 2020) to produce. Due to the additional ounces achieved, R8.0 billion (approximately 60% of the cost) will be put back into society through procurement and labour, excluding royalties and taxes.
• For every job in mining, at least two jobs are created up- and down-stream. The income of each mining employee supports five to ten dependants (Baxter, 2019).
> Mineral resources
• Platinum resources are scarce, and social responsibility demands optimal extraction. The PlatMine formula (Watson et al., 2007) allows a substantial increase in extraction ratios, particularly at deeper levels. One of the top ten risks facing mining is the replacement of production. This replacement is usually achieved by finding new orebodies, or extensions to existing workings. However, exploration is long-term and expensive. In this case, all costs have been paid and better utilization of the orebody is achieved.
> Safety benefits
• Booysendal North Mine has shown that mechanized bord-and-pillar mining is a safe and productive mining method for the UG2 reef (Northam Platinum Limited, 2018). Booysendal has achieved three million fatality-free shifts, a significantly better safety record than the rest of the South African platinum mining industry (MOSH Learning Hub, 2019). The PlatMine formula (Watson et al., 2007) will allow the mine to extend the same mining method to greater depths than the traditional formula (Malan and Napier, 2011). It will thus be possible to maintain a higher safety record than for the average South African platinum mines.
Conclusions
The instrumentation installed at the Booysendal Platinum Mine site successfully measured the stress/strain behaviour of a pillar. The measured failure stress was slightly higher than the strength calculated by the PlatMine formula (Watson et al., 2007). In addition, the general slope of the measured stress/ strain curve was similar to the elastic model produced by MAP3D (Wiles, 2017) and the deformation expected due to the measured elastic constants of the pillar material, suggesting a good set of measurements. An unexpectedly high initial residual strength of about 30 MPa was measured, but this stress may have reduced with time, after the monitoring period.
The significant number of pillars successfully mined on Booysendal using the PlatMine formula (Watson et al., 2007) is further evidence of its legitimacy. Caution should, however, be exercised when applying this formula to w/h ratios and pillar heights outside the range of the database and in areas with different geotechnical and geomechanical properties.
The PlatMine formula (Watson et al., 2007) will have a significant positive impact on the South African Bushveld Complex platinum mines that are mining the UG2 Reef. Pillars can be mined smaller without compromising safety, provided they fall within the range of the database. Booysendal is likely to realize an additional US$1.3 billion over the 25 year life-of-mine as a direct result of mining smaller pillars. The mine will also achieve other benefits such as an extension of the life-of-mine by 2.6 years and improved underground transportation efficiencies.
Recommendations
It is strongly recommended that similar investigations be conducted at various pillar heights and w/h ratios to confirm the PlatMine formula (Watson et al., 2007).
Acknowledgements
The staff and management of Booysendal Platinum mine are thanked for their invaluable assistance and funding of the project. Mr Phillip Luwes is thanked for his patience and the arduous task of installing and manually reading the instrumentation over a period of about two years.
References
Baxter, R. 2019. What's happening economically and how is this impacting the mining industry? Mining in SA today, JohannesburgIndaba, October 2019: 2 pp [ Links ]
Coetzer, S.J. 2005. Personal communication. [ Links ]
Exchangerates. 2020. http://www.exchangerates.org.uk [accessed 26 February 2020]. [ Links ]
Fernandes, N. 2020. Personal communication. Johannesburg. [ Links ]
Hedley, D.G.F. and Grant, f. 1972. Stope pillar design for the Elliot Lake uranium mines. Bulletin of the Canadian Institute of Mining and Metallurgy, vol. 65. pp. 37-44. [ Links ]
Mahlangu, M.P. 2020. Mandatory Code of Practice to combat rock fall and rock burst accidents in metalliferous mines at Booysendal (Pty) limited, Limpopo, South Africa. [ Links ]
Malan, D.F. and Napier, J.A.L. 2011. The design of stable pillars in the Bushveld Complex mines: A problem solved? Journal of the Southern African Institute of Mining and Metallurgy, vol. 111: pp. 821-836. [ Links ]
MoSH Learning Hub. 2019. Minerals Council of South Africa Safety Presentation. Falls of Ground COPA, Welkom. [ Links ]
Northam Platinum Limited. 2018. Annual Integrated Report 2018.: https://www.northam.co.za/procurement/127-investors-and-media/publications/719-annual-report [aAccessed: 7 February 2020] [ Links ]
Nothnagel, S.J. 2020. Personal commication. [ Links ]
Poulos, H.G. and Davis, E.h. 1974. Elastic Solutions for Soil and Rock Mechanics. Wiley, New York. 424 pp. [ Links ]
Spencer, D.A. 2009. Rock engineering designs for the North and South Sections of the Booysendal Project. BPM internal unpublished report. [ Links ]
Van der Woude S. 2019. Challenges in mining for the Fourth Industrial Revolution. Mining Expo and Conference 2019. Chamber of Mines of Namibia, Windhoek. pp. 22, 23, and 26. [ Links ]
Van Schalkwyk, I. 2020 Northam Platinum Limited condensed reviewed interim results for the six months ended 31 December 2019. https://www.northam.co.za/presentations [accessed: 2 March 2020] [ Links ]
Wagner, H. 1974. Determination of the complete load-deformation characteristics of coal pillars. Proceedings of the 3rd International Congress on Rock Mechanics, Denver, CO. International Society for Rock Mechanics. Vol. 2B, pp 1076-1082. [ Links ]
Wagner, H. 1980. Pillar design in coal mines. Journal of the South African Institute of Mining and Metallurgy, vol. 80. pp. 37-45. [ Links ]
Watson, B.P., Kataka, M.O., Leteane, F.P., and Kuijpers, J.S. 2007. Merensky and UG2 pillar strength back analyses. PlatMine 1.2, Johannesburg. [ Links ]
Watson, B.P., Kuijpers, J.S., and Miovsky, p. 2008. In situ measurements of pillar behaviour in the Bushveld Platinum deposits of South Africa. Proceedings of the 42nd U.S. Rock Mechanics Symposium and 2nd U.S.-Canada Rock Mechanics Symposium, San Francisco. American Rock Mechanics Association, Alexandria, VA. Paper no. ARMA-08-072 [ Links ]
Watson, B.P., Stacey, A.T., and Kuijpers, J.S. 2010. Design of Merensky Reef crush pillars. Journal of the South African Institute of Mining and Metallurgy, vol. 110. pp. 581-591. [ Links ]
Watson, B.P., Lamos, R.A., and Roberts, D.P. 2021. PlatMine pillar strength formula for the UG2 Reef. Journal of the Southern African Institute of Mining and Metallurgy, vol.121, no. 8. pp. 437-448. [ Links ]
Wiles, T. 2017. MAP3D User's Manual version 65. Map3d International Ltd, Perth, Australia. [ Links ]
 Correspondence:
B.P. Watson
Email: Bryan.Watson@wits.ac.za
Received: 19 Jan. 2021
Published: August 2021

