


Services on Demand
Article
 English (pdf)
 Article in xml format
 Article references
Indicators

Related links
-
 Cited by Google
 -
 Similars in Google
Share

 Permalink
Journal of the Southern African Institute of Mining and Metallurgy
On-line version ISSN 2411-9717
Print version ISSN 2225-6253
J. S. Afr. Inst. Min. Metall. vol.121 n.6 Johannesburg Jun. 2021
http://dx.doi.org/10.17159/2411-9717/1093/2021
PROFESSIONAL TECHNICAL AND SCIENTIFIC PAPERS
Mechanical properties and damage mode of cemented tailings backfill in an acidic environment
Y. HuangI; G. WangI; Y. RaoII; W. LiuII
ISchool of Civil Engineering, Changsha University of Science and Technology, Changsha, Hunan China
IIJiangxi Key Laboratory of Mining Engineering, Jiangxi University of Science and Technology, Ganzhou, JiangXi, China
SYNOPSIS
The properties and deterioration in strength of cemented tailings backfill (CTB )in the underground acidic environment under oxidizing conditions were studied. X-ray diffraction analysis and scanning electron microscopy of the surface of the CTB was carried out, and the sulphuric acid corrosion mechanism elucidated. The properties tested included compressive strength, elastic modulus, cohesion, internal friction angle, variation in the hydrogen ion concentration, and stress-strain relationship in different corrosion periods. The damage model of the CTB was established considering the effects of parameters such as corrosion time and strain on the damage evolution. It was found that the compressive strength, elastic modulus, cohesion (binder effect), and internal friction angle increased at first and then decreased with exposure time. In the long term, the peak stress decreased with corrosion time while the peak strain increased; elastic modulus, and deformation modulus also decreased. The damage caused by corrosion and by load were related by means of a mathematical model, which revealed the relationships between sulphuric attack, load, and damage to backfill in complex underground environments. During corrosion, the expansion of gypsum and ettringite caused microfractures in the CTB. With increasing corrosion time, micro-cracks developed and proliferated. The mechanism of corrosion damage was found to be the dissolution of hydrogen ions and a sulphate ion reaction that produces an expansive substance, resulting in deterioration of the strength of CTB.
Keywords: underground environment, sulphuric acid corrosion, porosity, cemented tailings backfill, damage evolution model.
Introduction
Underground mining operations can bring problems such as overburden pressure, surface subsidence, and instability of mined-out areas. At the same time, tailings dams occupy large areas of land, are increasingly costly to build, and carry the risk of environmental pollution. Backfilling of underground workings with cemented tailings is one of the effective methods of solving these problems. The backfill plays a structural role in the mining area (Cai, 1985), and thus the strength of the backfill is of paramount importance.
The backfill is composed of water, tailings, and cementing materials, among others. Much research has focused on the influence of different proportions of ingredients on the strength of backfill (Alireza and Fall, 2016; Djurdjevac, Ignjatovic, and Ljubojev 2016; Yang, Yang, and Gao, 2016; Liang, Dong, and Jiang, 2015; Li, Feng, and Guo, 2016a; Li, Jin, and Tan, 2016b; Chang, Zhou, and Qin, 2009; Li et aí., 2005; Cao, Song, and Xue, 2016; Song, Li, and Lei, 2012). This research provides a theoretical basis for the proportions of ingredients. However, backfill strength is determined not only by intrinsic factors, but also by external influences. In addition, Li, Jin, and Tan (2016) found that the loading rate had a significant effect on the uniaxial compressive strength and secant modulus of the backfill. As regards the influence of the properties of the backfill, Nie, Wang, and Huang (2018) found that different water contents have a significant influence on the strength of the backfill. However, only limited research has been done on the influence of corrosion on the strength of the backfill. Such research as has been done has focused mainly on corrosion by salts, such as NaCl, Na2SO4, Na2CO3, and other solutions (Sun et al., 2015a, 2015b, 2015c, 2015d; Zhang, 2017). Acid minewater (Ning, 2000; Dai et al., 2007; Liu, Zhao, and Hun, 2008; Yang et al, 2009; Huang, 2018) produced during mining and beneficiation corrodes the backfill, and affects its strength, thus affecting the stability of the goaf to a certain extent. Furthermore, there is a difference between acid solution and salt corrosion (Wang, 2017), and the tailings composition at each mine is different.
In this research we used accelerated corrosion methods (Zhao et al., 2016) to configure sulphuric acid solutions with pH values of 1, 3, and 5. These solutions are referred to in this paper as P1, P3, and P5 respectively. CTB was configured with a ratio of 1:4 (four parts tailings to one part cement), a slurry concentration of 75%, and a standard curing time of 28 days. The CTB was then immersed in different sulphuric acid solutions. Some experiments were conducted to simulate the mechanical characteristics and deterioration of concrete in an acidic environment. The parameters that were tested included compressive strength, elastic modulus, cohesion, internal friction angle, and stressstrain curves over different corrosion periods. In addition, the effect of different hydrogen ion concentrations was studied, and X-ray diffraction (XRD) and scanning electron microscopy (SEM) of the CTB surface were carried out in order to elucidate the corrosion mechanism. A damage model of corroded concrete was established, taking into account the effects of parameters such as corrosion time and strain on the damage evolution. The results of this study enrich the theory of backfill strength and provide a theoretical basis for the design of durable backfill for use in an acid environment.
Materials
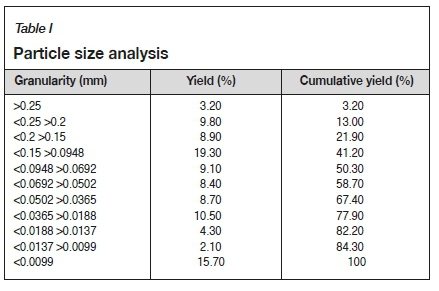
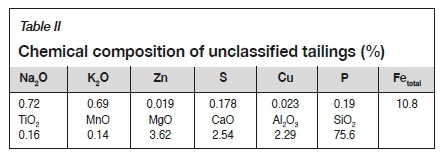
The tailings, which were taken from an iron ore mine, had a specific density of 2.997 g/cm3 and a bulk density of 1.667 g/cm3. A particle size analysis (Table I) showed that the tailings were dominated by fine fractions, and characterized by uneven distribution of the coarse and fine particles. The main chemical constituents of the tailings were SiO2 (75.6%), Fetotal (10.8%), and MgO (3.62%), with minor constituents CaO (2.54%) and Al2O3 (2.29%) as shown in Table II.
The samples were prepared as follows.
1. Prepare the tailings and cement (PC32.5) in a ratio of 4:1, stir evenly, pour mixture into the stirring pot, add tap water, start the mixer, stir for 120 seconds. Stop mixing, wait for 60 seconds, and carefully scrape off the slurry sticking on the blade. Remove the stirrer.
2. Clean the mould before injection moulding, and evenly apply a thin layer of oil on the inner surface of the mould to facilitate demoulding.
3. Put the mixture into the mould (mould dimensions 50 mm diameter χ 100 mm height), shake it on the vibrating table of the mortar to make it uniform and dense, then scrape off and smooth the mixture from the surface of the test block, and label the test block.
After 24 hours, the mould was removed and then placed in a box for maintenance. The curing temperature was 20±1°C, humidity ≥ 95%, and the samples were cured for 28 days before they were transferred to the acid solution. There were three sets of CTB in the experiment, 90 in each group, and a total of 285 CTB samples were prepared.
The pre-test density of the CTB was between 2.04 g/cm3 and 2.16 g/cm3, the longitudinal wave velocity was between 1915 m/s and 1990 m/s, and the porosity was between 5.01% and 6.03%.
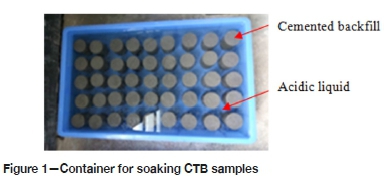
The reagent used in the experiment was 98% concentrated sulphuric acid, and the water was from the laboratory of Jiangxi University of Science and Technology. First, a certain amount of water was filled into a plastic bucket. To ensure that the amount of water was constant in every test, the water level was marked on the bucket. The volume of water in the bucket was chosen so that the solution level in every test was 2 cm above the CTB surface. Then the pH meter probe, calibrated using pH buffer solutions, was inserted into the water. The concentrated sulphuric acid was slowly dripped into the water using a dropper, with continuously stirring using a glass rod, until the pH of the solution reached the required test value. Lastly, the sulphuric acid solution was poured into the plastic frame of dimensions 62 χ 36 χ 13 cm (Figure 1). Using the method of accelerating the corrosion rate, the sulphuric acid solution was discarded after soaking for 10 days. The acidic solution was replenished five times at 10-day intervals to the 60th day.
Methods
The investigation included two main aspects: chemical/ mineralogical characterization and mechanical properties assessment. In order to analyse the reaction mechanism and the relationship between the solution and CTB, the pH value of the sulphuric acid solution was monitored by a pH meter, taking readings on days 3, 7 and 10 of each test. This verifies whether H+ ions participate in the corrosion reaction.
In addition, the corrosion layer of the CTB during the corrosion process was subjected to XRD analysis to verify whether SO42- ions participate in the corrosion reaction. After the CTB had been soaked for the set number of days, the surface layer of the sample was removed, dried, ground, and X-ray microanalysis was performed (XRD; Dandonghaoyuan DX-2700, China). JADE software was used for data processing.
In the electron microscopy experiment, after the CTB had been soaked for the set number of days, the surface layer was removed, dried, and broken into small pieces (<10 χ 10 χ 5 mm), and examined using a scanning electron microscope (MLA650F, USA). Specimens were scanned before corrosion and after exposure for 60 days in the P1 environment.
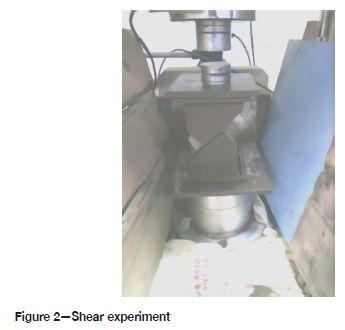
After the CTB samples had been soaked for the set number of days, twelve samples were taken from each of the different acidic solutions and gently rinsed with tap water. The samples were placed in a drying oven for 24 hours at a temperature of 100°C. An RMT-150C rock mechanics test system was used to test the compressive strength (DZ/T 0276.19-2015, China) and the variable angle shear strength of the samples (DZ/T 0276.252015, China). Three samples from a group were tested for uniaxial compressive strength. The shear test was done at angles of 30°, 45°, and 60° (Figure 2). Three samples were tested at each angle. The tests were done on samples with ages of 10, 20, 30, 40, 50, and 60 days.
Results and discussion
Influence of corrosion on mechanical properties of CTB
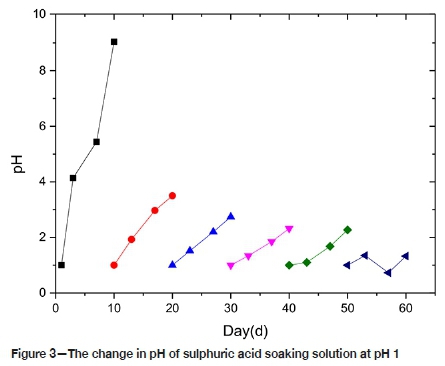
It can be seen from Figure 3 that from zero to 10 days the pH of the solution changes from acidic to alkaline. The pH gradually rises from 1 to 9, and there is a large amount of H+ consumption, mainly by the Ca(OH)2 dissolution reaction. From 10~50 days, the change of pH value is like the change rule for 0~10 days, although the solution remains weakly acidic. This suggests that the dissolution rate of Ca(OH)2 is slowing; the surface of the CTB and the pore structure are covered by gypsum crystals and colloids, hindering the reaction from proceeding inside the CTB, thus the chemical reaction rate is lowered, and the phenomenon becomes more obvious with increasing time.
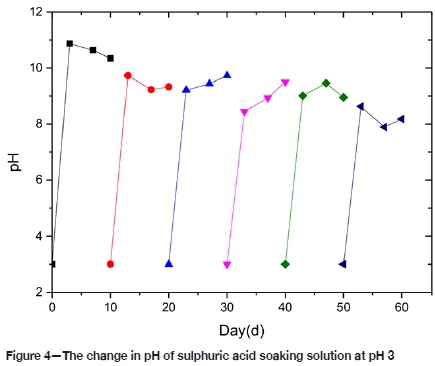
From Figure 4, the pH of the P3 solution changes from 3 to 11 over the first 3 days. Due to the presence of colloidal compounds such as hydrosilicate, tobemullite, etc. it is not easy to store in this alkaline environment, which provides a favourable chemical environment for the formation of colloids. But the colloids are observed in this solution, although the amount is less than for P1, indicating that the rate of chemical reaction in the acidic environment is slowed down. After 3 days, the pH jumps slightly, and the chemical reaction tends to be relatively stable.
The pH change of the solution under P5 condition is like that of P3. As shown in Figure 5, the pH of the solution becomes alkaline at 3 days, and then tends to be stable. The solubility of hydrogen ions in this environment is weaker than that in the P3 environment. No formation of colloids was observed in this acidic environment.
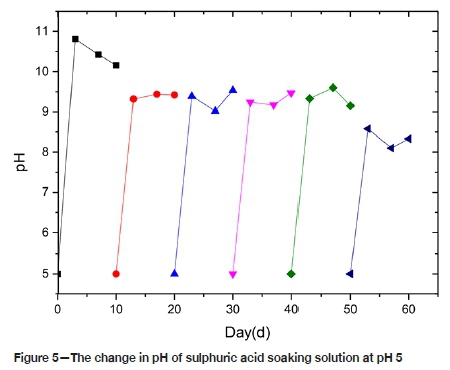
Regardless of whether the initial solution is strongly or weakly acidic, the pH of the solution increases to neutral. The acidic solution is neutralized and becomes alkaline. Three days after the reaction of the sulphuric acid solution with CTB, the neutralization of H+ ions at different pH values is obvious. The neutralization of H+ ions decreases and stabilizes after 3 days, indicating that the water chemistry is closely related to time. Eventually, the change in the water chemistry gradually slows down and stabilizes under alkaline conditions. In weak acidic conditions the neutralization of H+ ions in the solution is substantial; while in strongly acidic conditions the neutralization of H+ ions does not change substantially. It is evident that the water chemistry under weak acid reaction can change the environmental conditions of the solution and affect the subsequent water chemistry. Under the strong acidic environment, the water chemistry does not change the solution environment. This is due to the coating of the reactive mineral surfaces by secondary mineral precipitates, which decreases the effective reactive surface area, so the effect of the sulphuric acid on the CTB is reduced.
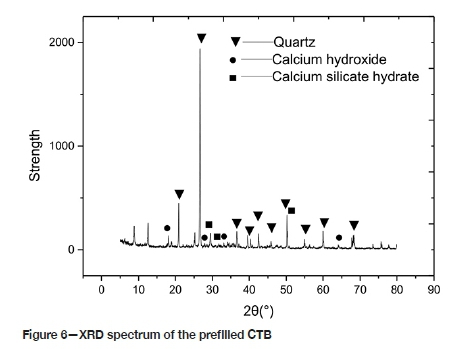
For reasons of brevity, only the XRD spectra of the CTB in the P1 environment, for 60 days of corrosion and before immersion, is presented (Figures 6 and 7). Before corrosion, the spectrum depicts mainly the hydration reaction product C-S-H. When the sample immersed in pH 5 sulphuric acid is corroded for 10 days, in addition to the hydration product, there is a diffraction peak of Aft (6CaO.Al2O3.3SO3.32H2O, Aft). Under these conditions, the amount of ettringite, which filled the micropores of the test piece and optimized the pore structure, was limited. As the etching time increases, the number of Ca(OH)2 and AFt diffraction peaks decreases, and the number of CaS04»2H20 peaks increases. The sample immersed in pH 1 sulphuric acid exhibits a very minor Aft diffraction peak. The number of CaS04»2H20 diffraction peaks decreases, and the sample immersed in pH 3 sulphuric acid shows a similar pattern to that of pH 1. The number of AFt diffraction peaks was larger than that of CTB under the P1 environment, and the number of CaS04•2H20 diffraction peaks greater than in the P1 environment. With the progress of corrosion, the amount of gypsum gradually increases, the porosity of the CTB also increases, and the degree of corrosion increases. A large amount of ettringite and gypsum generates expansion stress inside the test piece. When the expansion stress is greater than the internal tensile stress, micro-cracks are formed and the internal pore structure begins to deteriorate.
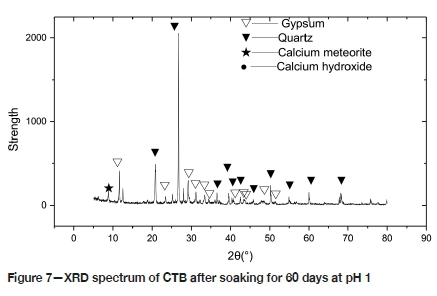
As described above, in a sulphuric acid environment a complex chemical reaction occurs between CTB and the solution. The Ca(OH)2 in CTB increases the porosity, the mesostructure of the test piece is altered, and the mechanical strength of the CTB deteriorates. Gypsum generated by the chemical reaction causes expansion stress in the CTB, resulting in micro-cracks and an increase in volume, thereby decreasing the strength.
Figures 8a and 8b are SEM micrographs of the corrosion products. The backfill is dense before corrosion, and several columnar crystals appear after corrosion. According to Qiao et al. (2019), the morphologies of ettringite and gypsum are needlelike. Several ettringite crystals are visible in Figure 8c.
Effect of corrosion on uniaxial compression behaviour of CTB
Figure 9 shows the change in the uniaxial compressive strength of CTB with time. The trends in the three pH environments are basically similar, rising first and then falling, indicating that the pH has an impact on the strength of CTB. In P1 the CTB reached a peak strength of 5.6 MPa in 10 days, an increase of 45%. In P3 and P5 the CTB reached peak strength of 5.2 MPa in 20 days, an increase of around 34%. This indicates that during the initial stage of corrosion in sulphuric acid the strength of CTB increases. Similar results were obtained by Zhao et al. (2016) and Li et al. (2014). After 60 days of corrosion, the CTB samples in P1, P3, and P5 increased in strength by 7.1%, 16.7%, and 10.4% respectively, compared with the strength before corrosion. Although there is a slight overall gain in strength over time with exposure to sulphuric acid, the initial increase in strength (during the first 10 or 20 days) deteriorates significantly with time. This is because during the first stages of corrosion the ettringite or gypsum crystals fill the pores, so that the strength of CTB is improved. With increasing of corrosion time, sulphuric acid solution gradually penetrates the CTB, weakening it. In the first instance, the reaction results in an increase in the internal porosity of CTB, thus decreasing of effective stress area, with a consequent decrease in compressive strength. Compounding this, the amount of gypsum and other expansion products generated by the chemical reaction increases, resulting in expansion stresses in the CTB, which lead to micro-cracks and a further reduction in strength. The maximum intensity of the three pH environments is different, perhaps due to the aggressiveness of the solution. The aggressiveness of the P1 solution is higher than P3 and P5, hence the rate of chemical reaction is higher, therefore the time to reach the strength peak value is shorter for P1 than for P3 and P5.
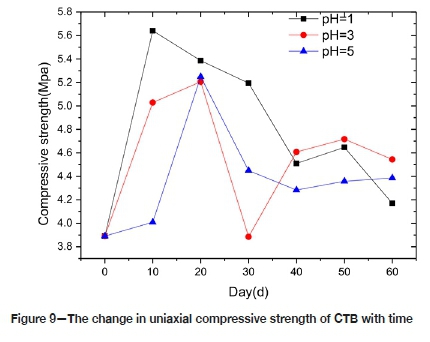
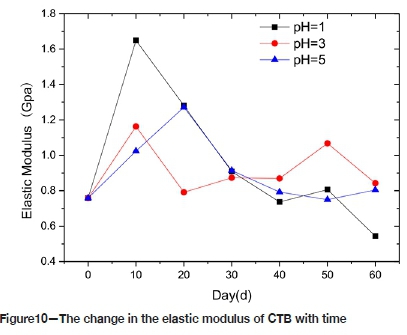
Figure 10 shows the change in the elastic modulus of the CTB with time. The basic trend in the three pH environments is an initial increase in the elastic modulus followed by a gradual decrease. In P1 and P3, the elastic modulus reached its peak value after 10 days. The peak value for P1 was 1.6G Pa, an increase of 118% compared with the pre-corrosion value. The peak value for P3 was 1.2 GPa, 40.5% above the pre-corrosion value, and for P5 the maximum elastic modulus was reached at 20 days, with an increase of 67.8% compared with the pre-corrosion value. Although the pH affected the elastic modulus significantly in the early days, there is no positive correlation between elastic modulus and pH. After 60 days of corrosion, the relative changes for P1, P3 and P5 were 28.3%, 8.4%, and 6.1% respectively, indicating that longer exposure had little effect on the elastic modulus of the filling. The modulus of elasticity can be used as an index for judging the susceptibility of a material to elastic deformation - the larger the elastic modulus, the greater the stress required for elastic deformation, which is basically consistent with the change in compressive strength of backfill. During the initial stage of corrosion, the solution fills the CTB's pores, and the degree of cohesion of the filler particles is high, which makes the elastic modulus increase. The change in behaviour may also be related to the degree of cement hydration of the test piece. With increasing corrosion time the porosity increases, the cohesion between the filler particles decreases greatly, and the elastic modulus of the filler decreases. The test results fluctuate because of the dispersion and the difference in the degree of erosion. The reason may be the different solubilities of the solutions.
Effect of corrosion on cohesion and internal friction angle of CTB
Figure 11 illustrates the trend of cohesion of CTB with time. The cohesion increases at first and then decreases for all the different pH solutions. The cohesion of CTB in P1 and P3 reaches its peak at 20 days, with strengths of 2.8 MPa and 2.96 MPa, respectively, increases of 167% and 150% from the pre-corrosion value. The CTB in P5 reaches its peak strength of 2.5 MPa at 30 days, increasing by 132%. After 60 days of corrosion, the cohesion values of the CTB in P1, P3, and P5 increased by 106%, 40.4% and 57.4% respectively, compared to the pre-corrosion value. This indicates that sulphuric acid enhanced cohesion during the early stages, but this effect deteriorated during the later stages. On the one hand, the gypsum produced by the chemical reaction fills the pores of CTB, which increases the compactness of CTB and its overall cohesion. On the other hand, acid corrosion will destroy the hydration products, such as Ca (OH)2, and destroy the intermolecular cementation. With increasing corrosion time, the damage will intensify, and the cohesion will deteriorate. The cohesion values in P1 and P3 peak earlier than in P5; this is related to the solubility of the ions. The range cohesion values depends mainly related on the dispersion of the samples.
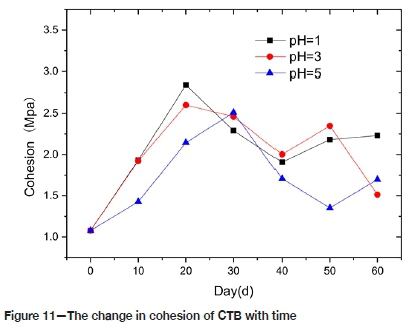
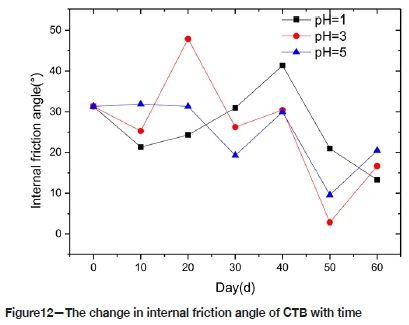
Figure 12 shows the changes in the friction angle of CTB with time. The internal friction angle, although fluctuating, generally decreases in all the solutions. The change range of the internal friction angle of CTB in P5 solution is relatively small, with a maximum of 31.9°, and a minimum of 9.6°. The change in P1 is a maximum of 41.4°, and a minimum of 13.3°. The chemical reaction rate in the P5 solution is slow, and the reaction products are few. The chemical reaction rate in the P1 solution is the fastest, and the reaction products are more than in P3 or P5. Therefore the pores of CTB in P1 are filled more completely than in P3 and P5, thus the change range of friction angle in P1 is smaller than in P3 and P5. It appears that the internal friction angle of CTB is related to porosity.
Damage evolution analysis of CTB in corrosion and loading process
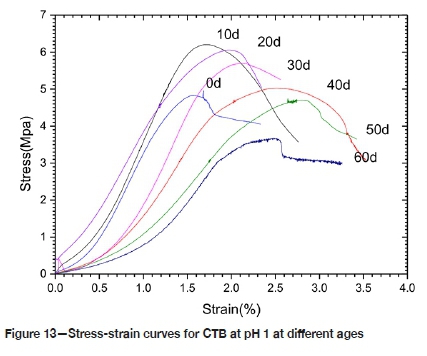
Figure 13 depicts the stress-strain curve of CTB in P1 after corrosion for 0, 10, 20, 30, 40, 50 and 60 days. As corrosion progresses, the peak stressfcof CTB first increases and then decreases. The elastic modulus of the corroded CTB is taken from the slope of the straight line in the elastic deformation stage on the measured stress-strain curve. The peak secant deformation modulus Epis taken from the ratio of the peak stressf to the peak strain econ the measured stress-strain curve. Both Ecand Epat first increase and then decrease. After soaking for 10 days, Ecand Epincreased by 22.2% and 16.1% respectively. After 60 days, the modulus of elasticity decreased to 0.41 times that of the CTB before corrosion, and the peak modulus of deformation reduced to 0.47 times the pre-corrosion value. The peak strain ec is proportional to the corrosion time; this increased by 66.67% after 60 days of soaking.
From examination of the stress-strain curves, the deformation and failure process of CTB can be divided into four stages:
➤The first stage is the initial deformation stage: CTB is in the initial stage of stress-strain, the graph's curved section is slightly concave upward, and the micropores and micro-cracks in the material are compacted. With prolonged corrosion time, the pore content in CTB increases and the compaction process is more obvious in CTB.
➤ The second stage is the elastic deformation stage, in which the stress-strain curve of CTB is approximately linear, and the steeper the straight line, the larger the elastic modulus. At the initial stage of corrosion, the elastic modulus of CTB tends to increase. As the corrosion time increases, the elastic modulus gradually decreases.
➤ The third stage is the yield stage, and the slope of the curve segment decreases as the stress increases. In the initial stage of corrosion, the strength of CTB will increase, and the higher the peak strength, the more obvious is the yield deformation process. As the corrosion time increases, the strength of CTB will gradually decrease.
➤ The fourth stage is destruction. As the deformation increases, the load-carrying capacity of CTB gradually decreases.
The failure of CTB samples is a process of cumulative damage. The damage during the loading process is regarded as a continuous process. The distribution of mesoscopic defects inside the material is relatively random. After CTB is affected by the external environment, the micro-cracks and cracks in the material continue to evolve and develop in some areas, then macroscopic cracks are formed which cause the structure of CTB to be destroyed. The relationship between the damage factor D and the statistical distribution density of CTB micro-destruction can be expressed as dD/dε = φ (ε), where φ (ε) is a measure of the damage rate of the micro-element during loading. If CTB microelement strength obeys the Weibull distribution, the damage evolution equations of the loaded CTB are:
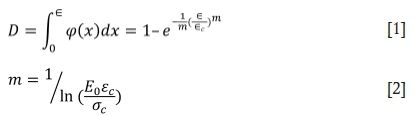
where εcis the strain corresponding to the peak stress oc, m is the material parameter of the damage evolution characteristic of CTB, and Eois the initial elastic modulus before corrosion. There are two kinds of corrosion damage to CTB - the damage caused by sulphuric acid and the damage caused by the load. The strain equivalence promoted by the Lemaitre strain equivalence principle can be used to derive the constitutive relationship of the internal corrosion damage to CTB:

where D is the damage factor due to the load, and Etis the elastic modulus after corrosion for a period.
The corrosion stress-strain relationship of CTB expressed by the corrosion and the total damage variable Dmis:
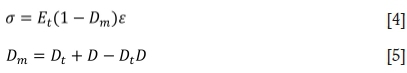
In the formula, D is the damage factor caused by corrosion, D is the damage factor caused by the loading, and DD is the coupling term.
It has been seen that corrosion causes the strength of CTB to deteriorate over time. The degree of deterioration can be quantified by an indicator. Various indicators may be used. Elastic modulus is easy to obtain for the damage variable, and the quantitative description of the corrosion damage is as follows:
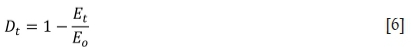
Equations [1], [5], and [6] can be used to derive the total damage evolution equation of CTB under corrosion and load:
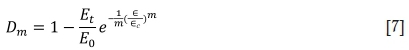
Assuming that CTB is only corroded, the loaded strain ε = 0; at this time Dm= D .. When only the damage is considered, E t= E0; at this time Dm= D. According to the test data and the result of Equation [7], the evolution curve of the corrosion damage model of CTB samples as shown in Figure 14 is obtained.
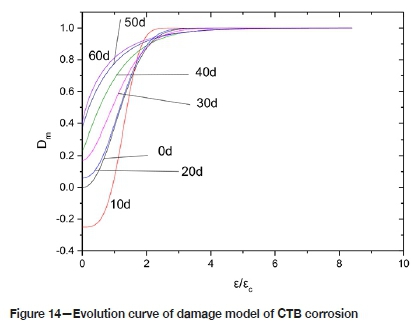
It also can be seen from Figure 8 that in an acidic environment, in the long run, the degree of corrosion damage of the CTB is correlated with the corrosion time. That is, the longer the corrosion time, the more serious the deterioration of the sample. In the first instance, corrosion causes the porosity of the CTB sample to increase, hence the effective force area decreases under the load. Therefore, the mechanical strength properties deteriorate. Compounding this, the amount of gypsum and other expansion products increases due to the corrosion, and when the expansion is greater than the internal cohesiveness of CTB, microfractures are formed. In a corrosive environment, the degree of damage deterioration of CTB increases with increasing strain. At the initial stage of loading, the micropores and defects inside the CTB are 'compacted' (the compaction stage). With the gradual increase of strain, the micropores and micro-cracks in CTB continue to expand and develop into macro-cracks, and the damage is intensified. When the stress on the test piece reaches its peak, the damage is at a maximum.
Conclusions
CTB samples were fabricated and exposed to sulphuric acid solutions with different pH values. The compressive strength and shear strength of the backfill were measured after immersion for different times, and the pH values of the solutions was measured. The backfill after corrosion was analysed by XRD and SEM. The conclusions are as follows.
1. Sulphuric acid solution corrosion influences the mechanical properties of CTB. Although it is beneficial to the strength of the CTB in the early stages, corrosion is unfavourable in the long term. Compressive strength, modulus of elasticity, and cohesion all change similarly in an acidic environment, showing a trend of increasing first and then gradually decreasing. However, the trend for the internal friction angle is not obvious; it fluctuates while decreasing overall.
2. Sulphuric acid corrosion increases the secondary porosity of the CTB; the corrosion product gypsum forms, causing expansion and micro-fractures in the specimen. With increasing corrosion, the micro-fractures gradually proliferate and expand, causing the volume of the CTB to increase. Both of these phenomena affect the mechanical properties of CTB. In summary, the corrosion failure mechanism of CTB is caused by two failure modes - the neutralization of H+ and the formation of expansive substances by S042- reaction (gypsum formation), which result in the change in the strength of CTB.
3. Regardless of whether the initial solution is strongly or weakly acidic, the pH of the solution changes from acidic to neutral over time; that is, the sulphuric acid solution-filler system becomes alkaline.
4. In the long term, the peak stress of the specimens decreases, the peak strain increases, and the elastic modulus and the peak deformation modulus decrease.
Some limitations of this study may be noted. Firstly, the experiments were carried out in an indoor environment. This is different from the actual situation in the field. In the field, the chemical composition of acidic mine drainage from the oxidation of sulphide minerals is complex. Secondly, the tests were carried out under controlled conditions of solubility, cement-to-tailings ratio, and curing days. The effects of variability in solubility, pH, cement-to-tailings ratio, and curing and exposure days have not been assessed. In addition, considering the influence of sulphur in tailings on the strength of backfill, this investigation is exploratory and focuses on the influence of acidic mine drainage on the strength of CTB, thus the tailings samples did not contain sulphur. Further research is required in the underground environment to assess whether the depth of corrosion attack is significant. If the corrosion is shallow (say 300 mm) relative to the backfill (many metres thick), is the weakening of this outer skin a major factor? Especially when backfill is required mainly to stabilize areas until such time as adjacent ore has been mined. If the weakening of this outer skin is a major factor, it is recommended that mitigation measures for the generation of acid mine drainage are considered when tailings are used as backfill to avoid corrosion and deterioration in the strength of the backfill material.
Acknowledgements
The authors gratefully acknowledge financial support from the Hunan Graduate Innovation Fund under Grant No. CX2018B535.
References
Alireza, G. and Fall, M. 2016. Strength evolution and deformation behaviour of cemented paste backfill at early ages: Effect of curing stress, filling strategy and drainage. International Journal of Mining Science and Technology, vol. 5. pp. 809-817. [ Links ]
Cai, S.J. 1985. Strength characteristics and strength design of cemented filling materials. 1. Strength design of cemented filling materials. Journal of South Metallurgy College, vol. 3. pp. 39-46. [ Links ]
Cao, S.A., Song, W.D., and Xue, G.L. 2016. Change rule and failure mode of mechanical properties of layered tailings cemented backfill. Journal of China University of Mining and Technology, vol. 4. pp. 717-722. [ Links ]
Chang, G.L., Zhou, H.O., and Oin, J.Y. 2009. Neural network prediction of paste filling material ratio. Journal of Mining and Safety Engineering, vol. 26. pp. 74-77. [ Links ]
Dai, Y.H., Rao, Y.Z., Wu, H., and Zhang, S.P. 2007. Study on the pollution law of acidic wastewater and heavy metal in mine. Gold, vol. 28. pp. 45-47. [ Links ]
Djurdjevac, L., Ignjatovic, D., and Ljubojev, M. 2016. Change the uniaxial compressive strength of paste backfill depending on change the parameters. Mining & Metallurgy Engineering Bor, vol. 1. pp. 17-24. [ Links ]
Huang, Y.G. 2018. Study on mechanical properties of full tailings cemented backfill in acidic solution. Master's thesis, Jiangxi University of Science and Technology, Ganzhou, Jiangxi, China. [ Links ]
Li, D., Feng, G.R., and Guo, Y.X. 2016. Analysis of strength growth rule of filling body based on response surface method. Journal of Coal Industry, vol. 41. pp. 392-398. [ Links ]
Li, Y.G., Jin, LZ., and Tan, H. 2016. Loading rate effect test of mechanical properties of cemented backfill. Journal of Harbin University of Technology, vol. 48. pp. 49-53. [ Links ]
Li, Y., Zhang, J., Deng, f., and Bai, S.W. 2005. Experimental study on strength characteristics of cemented tailing backfill in deep goaf. Geotechnical Mechanics, vol. 26. pp. 865-868. [ Links ]
Liang, Β., Dong, O., and Jiang, LG. 2015. Orthogonal test for optimal proportioning of cemented filling material of lead zinc tailings. Chinese Journal of Safety Sciences, vol. 12. pp. 81-86. [ Links ]
Liu, W.Y., Xiao, L.P., and Liang, Β. 2008. Study on treatment of mine acid wastewater and prospect of SAPS technology. Mining Research and Development, vol. 28. pp. 71-73. [ Links ]
Liu, J.Z., Zhao, C.J., and Hun, B.c. 2008. Stress analysis of cemented filling body. Nonferrous Mining and Metallurgy, vol. 24. pp. 12-13. [ Links ]
Nie, Y.L., Wang, X.J., and Huang, G.L. 2018. Strength and damage model analysis of pure tailings cemented backfill with different water content. Silicate Bulletin, vol. 37. pp. 201-206. [ Links ]
Ning, S.C. 2000. Treatment and improvement of acid wastewater in Nanshan Coal Mine of Maanshan Iron and Steel Company. Metal Mine, vol. 6. pp. 43-44. [ Links ]
Qiao, H.X., Chen, Z.C., Liang, J.K., and Li, Y.K. 2019. Sulfate erosion resistance of basalt manufactured sand concrete. Journal of Architecture and Civil Engineering, vol. 36. pp. 1422-1428. [ Links ]
Song, W.D., Li, H.F., and Lei, Y.K. 2012. Experimental study on cementation performance of Chengchao iron ore tailings. Mining Research and Development, vol. 1. pp. 8-11. [ Links ]
Sun, O., Li, X.L., Wei, Χ., and Mu, O.W. 2015a. Experimental study on the effect of chloride corrosion on creep characteristics of filling paste. Journal of Experimental Mechanics, vol. 30. pp. 231-238. [ Links ]
Sun, O., Li, X.L., Wei, Χ., and Mu, O.W. 2015b. Experimental study on the effect of mine water corrosion on the strength of fining paste. Journal of Ceramics Bulletin, vol. 34. pp. 1246-1251. [ Links ]
Sun, O., Li, X.L., Wei, Χ., and Mu, O.W. 2015c. Study on creep characteristics of paste filling material under sulfate corrosion. Journal of Safety Science and Technology, vol. 34. pp. 12-18. [ Links ]
Sun, O., Li, X.L., Wei, Χ., and Mu, O.W. 2015d. Study on strength evolution law of filling paste under corrosion and curing. Journal of Ceramics Bulletin, vol. 34. pp. 1480-1484. [ Links ]
Wang, K. 2017. Study on durability of concrete under acid rain and carbonization and freeze-thaw coupling. Master's thesis, Wuhan University of Technology, Wuhan, Hubei, China. [ Links ]
Yang, O., Ning, P., Cheng, F.Y., and Zhang, T.L. 2009. Progress of treatment of acid wastewater in mine. Metal Mine, vol. 1. pp. 131-134. [ Links ]
Yang, O., Yang, Z.O., and Gao, O. 2016. Study on cemented filling strength test and optimal ratio "decision of mixed filling aggregate. Geotechnical Mechanics, vol. 2. pp. 635-641. [ Links ]
Zhang, S.G. 2017. Study on corrosion characteristics and safety protection of reinforcing bars in underground filling. Mining Technology, vol. 3. pp. 58-60. [ Links ]
Zhao, L., Liu, J.H., Zhou, W.J., and Ji, H.G. 2016. Damage evolution and mechanism of concrete erosion at sulfate environment in underground mine. Journal of Coal Science, vol. 41, no.6. pp. 1422-1428. [ Links ] ♦
 Correspondence:
Y. Huang
Email: huangyounger@163.com
Received: 13 Jan. 2020
Revised: 19 Mar. 2021
Accepted: 26 Mar. 2021
Published: June 2021
ORCID
Y. Huang https://orchid.org/0000-0002-8014-405X
G. Wang https://orchid.org/0000-0002-6536-234X

