


Servicios Personalizados
Articulo
 Inglés (pdf)
 Articulo en XML
 Referencias del artículo
Indicadores

Links relacionados
-
 Citado por Google
 -
 Similares en Google
Compartir

 Permalink
Journal of the Southern African Institute of Mining and Metallurgy
versión On-line ISSN 2411-9717
versión impresa ISSN 2225-6253
J. S. Afr. Inst. Min. Metall. vol.121 no.6 Johannesburg jun. 2021
http://dx.doi.org/10.17159/2411-9717/581/2021
PROFESSIONAL TECHNICAL AND SCIENTIFIC PAPERS
A Bayesian network approach for geotechnical risk assessment in underground mines
R. MishraI; L. UotinenII; M. RinneII
IFirst Quantum Minerals Limited, Zambia
IIAalto University, Department of Civil Engineering, Finland
SYNOPSIS
Underground mining gives rise to geotechnical hazards. A formal geotechnical risk assessment can help to forecast and mitigate these hazards. Frequentist probability methods can be used when the hazard does not have many variables and a lot of data is available. However, often there is not enough data for probability distributions, such as in the case of new projects. The risk assessment is often subjective and qualitative, based on expert judgement. The purpose of this research is to present the use of Bayesian networks (BNs) as an alternative to existing risk assessment methods in underground mines by combining expert knowledge with data as it becomes available. Roof fall frequency forecasting using parameter learning is demonstrated with 1141 sets of roof fall data across 12 coal mines in the USA. The prediction is nearly identical for individual mines, but when multiple mines are evaluated it is difficult to find a single best fit distribution for annual roof fall frequency. The BN approach with TNormal distribution was twice as likely to fit the observed data compared to the Poisson distribution assumed in the past. A hybrid approach using BN combining multiple probability distribution curves from historical data to predict annual roof fall is proposed. The BN models can account for variability for multiple parameters without increasing the complexity of the calculation. BNs can work with varying amounts of data, which makes them a good tool for real-time risk assessment in mines.
Keywords: Bayesian network; expert opinion models; geotechnical risk; incident forecasting; parameter learning; roof fall risk.
Introduction
Geotechnical risks increase as mines progress deeper, and these risks are commonly managed using probability-based risk assessment (Dershowitz and Einstein, 1984; Galvin, Hebblewhite, and Salmon, 1999; Baecher and Christian, 2003; Mishra et al., 2017). The challenge with this approach is the lack of suitable data. Often there is not enough data for probability distributions, and historical data cannot be used for new projects in areas with no prior mining activities. The risk assessment is often subjective and qualitative, based on expert judgement. This paper aims to present the use of Bayesian networks (BNs) as an alternative method for risk assessment in underground mines. Spalling depth and roof collapse predictions are used as examples.
While qualitative assessment helps to carry out a quick risk assessment in the absence of data, it can be very broad and vague and can be highly influenced by personal opinion and bias. The variability of the condition of the rock mass compounds the problem as operations can run into previously unknown geological structures. Mining at great depth also means that collecting geotechnical information through conventional methods such as core drilling is very expensive. Non-intrusive geophysical methods involve limitations of coverage, range, and accuracy. Because of the uncertainty of geotechnical conditions with increased depth (e.g. geological contacts, rock properties), a formal geotechnical risk assessment outlining the scope, methodology, and resource requirement is preferable (Mishra and Rinne, 2014). The risk management framework should have a feature that enables it to learn from the data gained as mining progresses deeper.
Where historical frequencies of incidents are available, appropriate probability distributions can be used to forecast future failures. Duzgun and Einstein (2004) demonstrated the use of the Poisson distribution to forecast roof collapses in coal mines. Given the variability in mining conditions associated with each roof failure, it is often difficult to select one distribution which best describes all roof collapses. This paper extends their work by performing parameter learning on roof fall data across 12 mines and 1141 roof fall incidents to create probability distributions.
When extensive data is available, analytical design methods can be used to calculate the factor of safety. Significant variability in data can lead to conservative and expensive reinforcement design.
Probabilistic analyses (PoF) account for the variability in data and are often used today, as opposed to deterministic analyses. This paper combines the factor of the safety method for reinforcement design against roof collapse in underground mines with a Bayesian network to address the variability of the underlying data.
Risk assessment methodologies and approaches for the underground mining industry have been discussed extensively in the past (Brown, 2012; Mishra and Rinne, 2014; Eskesen et al., 2004; Paté-Cornell and Dillon, 2006; Paté-Cornell, 2007). Einstein and Baecher (1983) proposed that mining projects should be evaluated for their geotechnical risk levels through Geotechnical Risk Classification (GRC) from as early as the pre-feasibility study, and these values should be updated as the project progresses and more data becomes available. Kelly and Smith (2009) discussed the current state of the art of Bayesian inference in probabilistic risk assessment. Work has been done in the past using Bayesian networks to model major accidents using near misses (Khakzad, Khan, and Paltrinieri, 2014). Bayesian networks have also been used in dam risk assessment (Smith, 2006; Li, Yan, and Shao, 2007), tunnel risk assessment (Sousa and Einstein, 2007; Spackova and Straub, 2011), modelling uncertainties in rockfall hazards (Sousa and Einstein, 2012), safety assessment in construction projects (Zhang et al., 2014), and dynamic failure assessment in process plants (Meel and Seider, 2006). This paper discusses the use of BNs to convert probabilistic risk assessment from a frequentist approach to a Bayesian approach. It demonstrates how BNs can be used as an alternative to test the goodness of fit of competing probability distributions.
Methodology
Geotechnical risk is defined as a product of the likelihood of the geotechnical hazard and the severity of the consequence if the hazard were to be realized. Bayesian networks can be used to carry out both the likelihood and consequence assessment for a given hazard. In this paper, a BN has been used only to evaluate the likelihood of a roof or block collapse.
Bayesian networks or Bayesian belief networks are based on Bayes' theorem (Bayes and Price, 1763). They describe the conditional relationship between two or more variables using probability as defined in Equation [1].

where H and E represent a hypothesis (H) being tested and corresponding evidence (E) to support this hypothesis. P(HlE) is called the posterior probability, which is the probability of the hypothesis (H) being true given particular evidence (E). P(ElH) is called the likelihood, which is the probability of observing evidence (E) if the hypothesis were true. P(H) is called the priori, which is the prior belief in the hypothesis. P(E) is called the marginal likelihood, which represents the prevalence of the evidence in the base population. For instance, in a mining context, it is assumed that large angular discontinuities cause roof collapse. This assumption can be treated as one of several hypotheses in BNs that lead to roof collapse. P(HlE) for this hypothesis can be written as P(large angular discontinuity / roof collapse). P(large angular discontinuity), or the priori, would be the frequency rate of large angular discontinuities in the mine, such as an 'average of 10 discontinuities per mine'. P(roof collapse), or the marginal likelihood, would be the frequency rate of the roof collapses, such as 'two roof collapses per year'. P(roof collapse / large angular discontinuity), or the likelihood, would be the number of times a large angular discontinuity caused a roof collapse, such as 'one out of two roof collapses was caused by large discontinuities'.
Figure 1 shows the structure of a BN which has been modified from work by Smith (2006) to split the model into a causal model, a BN, and a decision-making model. H_1 and H_2 are examples of two hypothesis nodes leading to the evidence node E. The hypothesis and evidence nodes, along with the solid directional arrows, form the causal model. The circular nodes and solid arrows form the BN causal model, while the dotted arrows represent the flow of information in a BN. The circular nodes at the origin of the solid arrows are called 'parent' nodes (P(H_1), P(H_2)), while the nodes at the end of the solid arrows are called 'child' nodes.
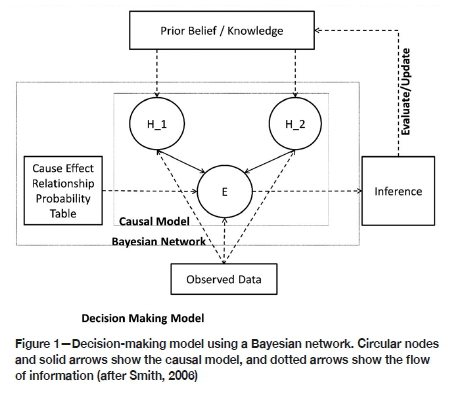
Relationships between the nodes are defined with the use of priors and conditional probability tables or cause-effect relationship tables. This model can now be used to evaluate the likelihood of the evidence if the hypothesis is true. This form of inferencing from hypothesis to evidence is called forward inferencing. Observed data can be fed into the same model to back-calculate the likelihood of the hypothesis being true through backward inferencing. This process of forward and backward inferencing creates a decision-making model. The process helps to evaluate and update our prior beliefs in the light of new evidence and thus improve predictions.
The network shown in Figure 1 can now be converted to carry out risk assessment by defining the risk being assessed as the evidence and the contributing factors as hypotheses. The same model can also be used to carry out backward inferencing and parameter learning (Fenton and Neil, 2012). To carry out parameter learning, the unknown parameter is defined as the evidence, such as the mean and variance for a normal distribution. The available data is entered into the hypothesis nodes, and the model is solved using Equation [1] to arrive at the likely value for the unknown parameter. All the BNs in this paper are created and solved using Agena Risk version 7 (Agena, 2017). Several Bayesian network modelling software packages are available to carry out the modelling. Agena Risk was chosen over the others because of its ability to deal with continuous variables along with non-numeric nodes. Comprehensive literature on the use of Agena Risk (Fenton, Neil, and Caballero, 2007; Fenton and Neil, 2012) across multiple cases was available, which assisted in the modelling of incidents.
Spalling depth forecasting using BN and analytical methods
This section discusses the concept of combining analytical methods for estimating the potential for spalling depth in tunnels with BNs. The usage of BNs allows the variability in the collected data to be taken into account better. To enable a direct comparison with existing frequentist methods, we have chosen a case example where a lot of data is available. To demonstrate the use of a BN in conjunction with the analytical method, we have used the spalling estimation method as described by Martin and Christiansson (2009) and the Olkiluoto case data from Siren et al. (2011). The Olkiluoto case describes a high-level spent nuclear fuel repository at a depth of 420 m in hard crystalline rock in Finland.
The failure mechanism that is studied is the formation of thin slabs. Progressively, these slabs form a continuous wedge of spalled material. To establish the size of the wedge to be supported with tunnel reinforcement, the analytical method requires the uniaxial compressive strength (UCS) of the rock and local principal stresses to be known. The factor of safety (FoS) for the roof reinforcement can then be calculated using Equation [2]:

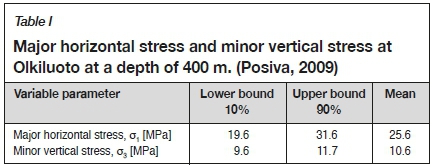
where osmis the rock spalling strength and σθθ is the tangential stress at the rock surface. The spalling strength is extracted from the UCS of the rock by multiplying by a scaling factor, k. For Olkiluoto, UCS is represented by a normal distribution with a mean of 115 MPa and a standard deviation of 23 MPa (Siren et al., 2011), and k = 0.57±0.02 has been used for crystalline rock (Martin and Christiansson, 2009). At a depth of 400 m, the major horizontal stress and minor vertical stresses were taken as in Posiva (2009), and to account for data variability both of these were represented by triangular distributions with corners in the lower 10% fractile, the mean, and the upper 90% fractile (Table I). Using the Kirsch (1898) equations (Equation [3]), these values can be used to calculate the resulting tangential stress at the rock surface. The shape factor A = 2.60 was obtained as a median value calculated from the profiles listed in Siren et al. (2011). The uncertainty of the stress direction is omitted for the sake of simplicity.

The FoS (Equation [2]) can now be calculated (Equation [4]). Using the mean values the FoS becomes
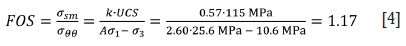
indicating a small risk of spalling damage at Olkiluoto, according to Siren et al. (2011). The damage depth can be calculated with Equation [5] modified after Martin and Christiansson (2009):
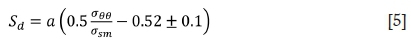
Assuming the nominal tunnel radius to be a = 5 m, the corresponding mean damage depth (Sd) is zero (-0.46 m) and the extreme value using the +0.1 upper limit would, at a maximum, be 0.037 m.
The empirical factor 0.52±0.1 describing the observed damage depth in Martin and Christiansson (2009) was modelled using a triangular distribution with a lower limit of 0.42, mode of 0.52, and upper limit of 0.62. The empirical factor is based on nine published case histories (Andersson, 2005; Martin et al., 2001) in a wide range of rock mass conditions and major in-situ stresses ranging from 10 MPa to 140 MPa. The rock types consisted of limestone (UCS 80 MPa), andesite (UCS 100 MPa), granite (UCS 220 MPa), and quartzite (UCS 350 MPa). The variability of σ1, σ3, and k means that there will be combinations that exhibit spalling despite the FoS being greater than unity.
For spalling strength, the factor k was modelled using a triangular distribution with a lower limit of 0.55, mode of 0.57, and upper limit of 0.59, as suggested in Martin and Christiansson (2009) for crystalline rocks. It should be noted that the factor k is defined for the mean UCS and the UCS is not entered as a distribution. The model allows for any combination of strength and stress, while in reality high stresses are more likely in strong rock and low stresses in weak rock. For weak rocks, the model may result in conservative results. The model may incorrectly predict the spalling phenomenon occurring in weak rocks or the occurrence of high stresses in weak rocks. The analytical method does not reveal what the spatial extent or probability of such damage is. The site-specific acceptance criteria as a function of FoS can be selected based on site-specific observations of FoS when there is no spalling, very minor spalling, or extensive spalling, as suggested in Martin and Christiansson (2009).
For a true deterministic example, the FoS will need to be calculated individually for all combinations of variables. This method requires extensive data collection. In reality, frequentist probability methods are used in conjunction with random sampling (e.g. Monte Carlo) or structured sampling (e.g. Latin hypercube sampling). The disadvantage of the frequentist probabilistic method is that the complexity of the model grows exponentially as the number of uncertain variables increases beyond two (Matarawi and Harrison, 2017). Additionally, the FoS values do not directly give the probability of failure (PoF), but prescribed tables can be used to compare FoS and PoF (Galvin, Hebblewhite, and Salmon, 1999).
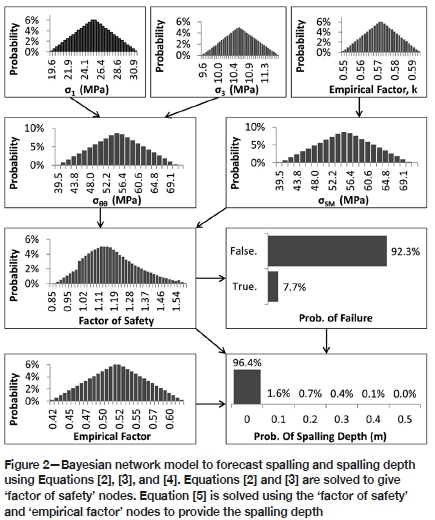
Bayesian networks can be used to take the variability into account directly. Accounting for variability eliminates any need to use FoS and establishes the PoF directly. Figure 2 shows the PoF calculation using the BN. The σ1 and σ3 nodes were used to calculate σθθ using Equation [3]. The osmnode was obtained by multiplying the empirical factor k by the mean UCS of 115 Mpa. Factor of safety and spalling depth nodes were obtained using Equations [2] and [5] respectively. The BN model predicts a 92.3% chance that the FoS will be greater than unity, while deterministic calculation using Equation [2] would have resulted in a single FoS value of 1.17. BNs can thus take into account the variability of multiple variables in analytical assessment to make failure predictions. In the presented example, the analysis was carried out in the least favourable direction. If the actual tunnel direction is known, the BN can be expanded to include the variability of the stress orientations. The current approach with the empirical factor k requires the usage of the mean UCS value. If the distribution of UCS is known, the crack initiation strength can be taken as a lower bound estimate for the spalling initiation strength as formation of cracks precedes the onset of spalling.
Roof collapse forecasting using BN with roof fall frequency data
Parameter learning on roof fall frequency data for roof fall forecasting
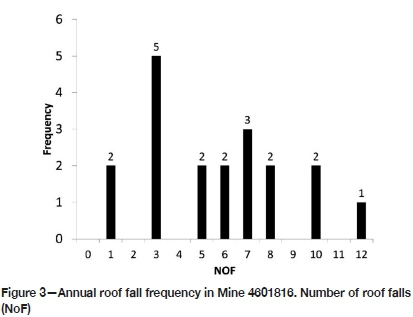
This section discusses the use of parameter learning in a BN to learn distributions from historical roof collapse data in coal mines. It considers the example of roof fall risk estimation using roof fall frequency data collected by the Mine Safety and Health Administration (MSHA) in coal mines situated in the USA. The data is from the period between 1979 and 1997 across 12 anonymized underground mines in the Appalachian region (Duzgun and Einstein, 2004; Mine Safety and Health Administration, 2000). This data has been analysed in the past by curve fitting the accident frequency to an appropriate probabilistic distribution to forecast failure (Duzgun and Einstein, 2004; Einstein, 1997). Mine ID 4601816 was considered for the parameter learning demonstration as it had the largest sample size, with 108 roof fall incidents. Figure 3 shows the annual frequency of the number of roof falls (NoF) in Mine ID 4601816.
Duzgun and Einstein (2004) used an exponential distribution for the time between failures and a Poisson distribution for the annual roof fall frequency (NoF) to fit the roof fall data for roof fall prediction. The Poisson distribution is a one-parameter probability distribution as shown in Equation [6] for annual roof fall frequency.

The Poisson parameter lambda (λ) is the mean roof fall frequency per year and NoF is the annual roof fall frequency whose probability of occurrence (P(NoF)) is being evaluated. Parameter λ for the roof fall frequency for the abovementioned mine is 5.68, using data from Figure 3. In the frequentist approach to risk assessment one value of λ is used to plot the probability distribution. Any frequentist interpretation of a statistical parameter is referred as the 'classical approach' in this paper.
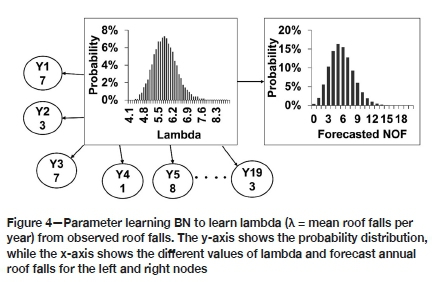
The Bayesian approach to solving this problem considers the λ parameter of the Poisson distribution as a variable itself. The parameter learning capabilities of the BN can then be used to learn the lambda parameters from the population. Figure 4 shows the BN used to learn the probability distribution of λ. The parent node lambda (λ) was assumed to have a uniform prior probability between 0 and 20. Uniform prior probability implies that all values between 0 and 20 had the same probability of being equal to λ. The child nodes to this parent are the number of roof failures occurring in different years, with the annual roof fall frequency on the x-axis and probability distribution (PD) on the y-axis. The conditional probability between lambda and roof fall node is defined by the Poisson equation as shown in Equation [6]. Nineteen child nodes were added to the BN to enter roof fall frequency data available for 19 years, as shown in Figure 4 from Y1 to Y19. An additional node named 'forecasted NOF' was added to show the results of the parameter learning to give the revised roof fall frequency. The BN was solved using the parameter learning to revise the λ distribution from the prior uniform distribution. The revised distribution, in turn, provided the 'predicted roof fall frequency'. As the evidence for year 20 becomes available, it can then be added as an additional child node, which will then revise both the λ and predicted roof fall frequency distribution in the light of the additional evidence.
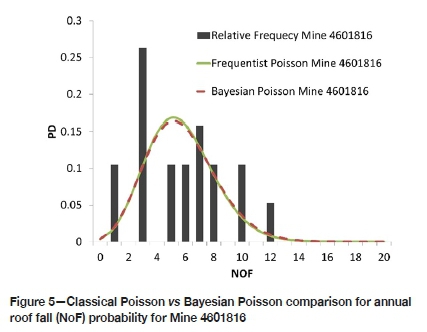
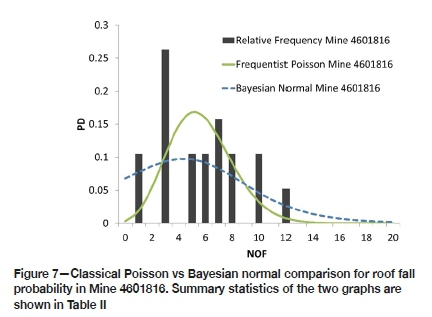
When the Bayesian prediction of annual roof fall frequency (NoF) probability distribution (PD) is compared with the classical Poisson distribution obtained from Equation [6], the Bayesian prediction is nearly identical, as shown in Figure 5. Despite being almost identical in probability distribution, both the classical and Bayesian curves are a poor fit to the observed data when a Poisson distribution is assumed. A mathematical comparison of goodness of fit of competing distributions is discussed later in the paper.
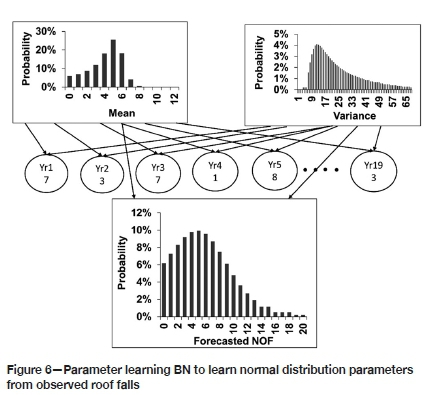
The data for Mine 460186 was then assumed to follow a normal distribution with mean and variance replacing λ as the parent node. The normal distribution was limited to a lower tolerance of zero annual roof falls and an upper tolerance of 20 annual roof falls, resulting in a truncated normal or TNormal distribution (Thompson, 1950). In order to avoid unreal results of non-integer annual roof falls, the TNormal distribution was constructed using integer intervals in Agena Risk (Agena, 2017). The mean and variance parameters were assumed to have uniform priors. The mean and variance parameters for the normal distribution were learned using parameter learning from the observed data for 19 years, similarly to that carried out in Figure 4. The resulting Bayesian network is shown in Figure 6, while a comparison of the classical Poisson distribution, Bayesian TNormal distribution, and the actual observed data is shown in Figure 7.
The relative error of the forecast value was carried out using Equation [7] for both the Poisson and normal distribution (ISO, 1993).

where E is the relative error in the forecast data, Pnis the forecast probability of n roof falls in a year, and RFnis the relative frequency of n roof falls. Using Equation [7], the average relative error in the forecast using classical Poisson distribution was 55%, which was reduced to 37% when the Bayesian TNormal distribution was used.
Using 'goodness of fit' results from multiple distributions for roof fall forecasting
There are mathematical tests, such as Kolmogorov-Smirnov test and the chi-square goodness of fit test, that can be carried out to evaluate how well a proposed distribution fits the data (Ang and Tang, 1984). These tests use statistical parameters such as the mean, which is not directly observed in the population but is inferred from a sample population. An alternative method using BN is to evaluate the frequency with which the historical data (evidence) occurs in the assumed probability distribution (hypothesis) (Fenton and Neil, 2012). This can be modelled using a BN where several probability distributions, in this case truncated normal and Poisson distribution, form the node states for a parent node (Figure 8).
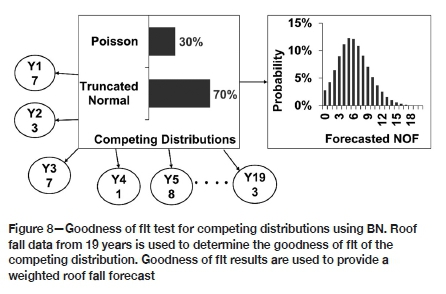
The child nodes are values observed in each of the 19 years for Mine 4601816. The prior probability of the parent node 'Competing distributions' is considered to be 50% for each, meaning that both the distributions are equally likely to be correct. The conditional probability table for the child node is conditional on the parent nodes as shown in Table II for the node 'Roof fall Y_1'.
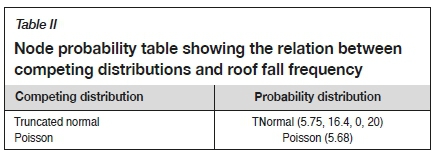
The values in parentheses for TNormal represent the mean, variance, lower bound, and upper bound respectively, while the values in parentheses for Poisson show the λ. These are statistical summary parameters of the Poisson and normal distributions shown in Figure 7. This BN is solved by entering roof fall values from year 1 to year 19, resulting in a posterior probability of 70% for the Bayesian TNormal distribution and 30% for the classical Poisson distribution. The posterior probabilities imply that there is a 70% probability of observing the given data under the Bayesian normal distribution, compared to 30% under the classical Poisson distribution. In other words, the observed data is more than twice as likely under the Bayesian TNormal distribution compared to the Poisson distribution. Therefore, Bayesian TNormal is a better model for forecasting the roof fall frequency in Mine 4601816. This goodness of fit test using the observed parameters was carried out for all 12 mines, and the Bayesian TNormal distribution was found to be a better fit compared to classical Poisson distribution in seven of the 12 mines. The results of this analysis are shown in Table III.
These results indicate that it is unlikely to have one distribution that is the best fit for roof fall data across different mines. Bayesian networks can overcome this problem by creating a hybrid distribution curve weighted according to the goodness of fit test results. The percentage probability values indicate which of the two distributions is more likely to fit the data better when they are compared. For example, if both truncated normal and Poisson distributions are used to forecast a roof fall in Mine 4601816, the forecast is weighted 70% in favour of normal distribution and 30% in favour of Poisson distribution as obtained from the goodness of fit test. Hybrid distributions can be useful in early stages of data collection, where limited data makes it difficult to identify a unique distribution that correctly represents the population. The number of distribution should be limited to two or three as the intention of the hybrid model is to evaluate potential distributions that are expected to describe the population. As additional information becomes available over time, the one distribution that best describes the population should be chosen from the hybrid distribution.
Discussion
Bayesian networks for real-time risk assessment
Geotechnical incidents in deep mines can have severe consequences due to both unfavourable mining conditions and the difficulty of rescue and recovery operations following an incident. Real-time risk assessment can help mitigate both the hazard and the consequences through advance warning. Bayesian networks can work with varying amounts of data, which makes them a good tool to carry out a real-time risk assessment at mine sites. Bayesian networks can either be integrated with the existing on-site information management system or strategic instrumentation and monitoring can be implemented once the Bayesian model has been defined.
The process of incorporating real-time risk assessment using BNs is shown in Figure 9. The first step in the process is to define a causal model for a failure such as stope collapse using nodes and probability tables. The contributing nodes can be numeric nodes with continuous values such as stress around the stope, the number of discontinuities, roof convergence, etc. Alternatively, these nodes can be non-numeric, with subjective states such as the quality of the filling in of the discontinuities. If the nodes are non-numeric, the prior probability of each of the nodes will have to be defined. Numeric nodes can consist of information which is collected, in real time, such as roof convergence measurement using an extensometer, or seismicity using geophones. For these nodes, appropriate site-wide instrumentation needs to be planned in such a way that sufficient data is collected, and their prior probabilities are defined using probability distribution. Numeric nodes can also consist of data, which is collected intermittently through inspection and is not continuous. Joint set numbers, joint roughness, blast vibrations, etc. fall into the category of non-continuous numeric nodes. Either these nodes can be defined using a probability distribution or the distribution can be learnt using parameter learning.
After the nodes and their prior probabilities have been defined, the BN is solved for the current risk level on the basis of the available information. As data is fed from real-time instrumentation, the risks are updated in real time to inform the relevant stakeholders. The same network can also be used to feed information on incidents and near misses that occur in the mine to carry out backward inferencing and revise all the prior probabilities. This method also assists with incident investigation to identify the most likely cause of the incident and improve the accuracy of the forecasting model.
Advantages and limitations of Bayesian network-based risk assessment
Bayesian networks offer the flexibility of working in the absence of historical data by replacing it with expert opinion-based prior probabilities. In conventional frequentist risk assessment, a summary of statistical parameters such as the mean and median is often used to carry out the risk assessment. Even when the full probability distribution is used, the computational requirements increase significantly as the number of parameters increases. BNs, however, can work with complex causal models where each node uses a probability distribution instead of summary statistics. Expert opinion-based risk assessment implies that a BN can quickly adapt to an existing subjective risk assessment practice in the mine. This improves the repeatability of the risk assessment process when performed by different personnel for the same mine. Its ability to perform backward inferencing on a risk assessment model allows the BN to be used for incident investigation. This iterative process of risk forecasting and incident investigation improves the reliability of the model by updating the assumed prior probabilities. Backward inferencing also encourages improved collection of data and rigorous incident investigations. The ability of BNs to work with site instrumentation opens up the possibility of creating a real-time risk assessment and warning system in a mine.
The use of expert opinions in the absence of data is also one of the main disadvantages of BN-based risk assessment. Incorrect prior probabilities lead to incorrect incident forecasts, which need to be validated through incident investigations in the future. The additional poor understanding of incident causation and failure mechanism also results in incorrect forecasts. Given the reliance on experts, it is prone to human error and expert biases. Realtime risk assessment using BNs can be challenging if a large part of the mine needs to be monitored for risk, as this would require extensive instrumentation, which can be expensive. Additionally, BNs can only work on the basis of an underlying causal model. Modelling error or the omission of key influencing factors can lead to incidents not predicted by the warning system. However, after every incident, backward inferencing should be carried out to test whether the causal model explains the incident. If not, additional investigation and instrumentation are necessary in order to improve the warning system.
Conclusions
Bayesian networks provide a flexible framework for carrying out risk assessment from zero to scarce to an abundant amount of measured data available. They can take into account the full variability of source data by the use of probability distributions. Spalling depth and the risk of roof fall were analysed using the Bayesian approach as an alternative to the analytical method. This approach was also used to convert the factor of safety calculation for spalling into a probability of whether spalling will happen. If spalling takes place, what are the probabilities of various spalling depths?
Parameter learning using BNs was demonstrated using roof fall data across 12 mines over 19 years. The results show the weakness in applying a single type of probability distribution that provides the best fit for roof fall frequency in all the mines that were studied. A methodology of combining multiple distributions to produce a weighted forecast was proposed to overcome the challenge of a best fit from a single probability distribution in the presence of limited data. This study indicates that BNs may present a good platform for a real-time risk assessment tool by combining expert knowledge with available data, including online measurements from the field.
Acknowledgement
The authors gratefully acknowledge the financial support provided by the Online Risk Management in Deep Mines (ORMID) project funded by the Academy of Finland under the grant no. 297770.
References
Agena. 2017. AgenaRisk: Bayesian network and simulation software for risk analysis and decision support. 7th edn. Cambridge, UK. [ Links ]
Andersson, C. 2005. Äspö pillar stability experiment. Bergmeckanikdag. Franzén, T. (ed.). SveBeFo, Stockholm. pp. 69-78. [ Links ]
Ang, A.B. and Tang, W.H. 1984. Probability Concepts in Engineering Planning and Design. Wiley, New York. [ Links ]
Baecher, G.B. and Christian, J.T. 2003. Reliability and Statistics in Geotechnical Engineering. Wiley, Chichester. [ Links ]
Bayes, M. and Price, M. 1763. An essay towards solving a Problem in the Doctrine of Chances. by the late Rev. Mr. Bayes, F.R.S. communicated by Mr. Price, in a letter to John Canton, A.M.F.R.S. Philosophical Transactions (1683-1775). pp. 370-418. [ Links ]
Brown, E.T. 2012. Risk assessment and management in underground rock engineering-An overview. Journal of Rock Mechanics and Geotechnical Engineering, vol. 4. pp. 193-204. [ Links ]
Dershowitz, W.S. and Einstein, H.H. 1984. Application of artificial intelligence to problems of rock mechanics. Proceedings of the 25th US Symposium on Rock Mechanics (USRMS), Evanston, Illinois. American Rock Mechanics Association, Alexandria, VA. [ Links ]
Duzgun, H.S.B. and Einstein, H.H. 2004. Assessment and management of roof fall risks in underground coal mines. Safety Science, vol. 42. pp. 23-41. [ Links ]
Einstein, H. 1997. Landslide risk - Systematic approaches to assessment and management. Proceedings of the International Workshop on Landslide Risk Assessment, Hawaii, USA. A.A. Balkema, Rotterdam. pp. 25-50. [ Links ]
Einstein, H.H. and Baecher, G.B. 1983. Probabilistic and statistical methods in engineering geology. Rock Mechanics and Rock Engineering, vol. 16. pp. 39-72. [ Links ]
Eskesen, S.D., Tengborg, P., Kampmann, J., and Veicherts, T.H. 2004. Guidelines for tunnelling risk management: International Tunnelling Association, Working Group No. 2. Tunnelling and Underground Space Technology, vol. 19. pp. 217-237. [ Links ]
Fenton, N. and Neil, M. 2012. Risk Assessment and Decision Analysis with Bayesian Networks. CRC Press, Boca Raton, FL. [ Links ]
Fenton, N.E., Neil, M., and Caballero, J.G. 2007. Using ranked nodes to model qualitative judgments in Bayesian networks. IEEE Transactions on Knowledge and Data Engineering, vol. 19. pp. 1420-1432. [ Links ]
Galvin, J., Hebblewhite, Β., and Salmon, M. 1999. Coal pillar strength determinations for Australian and South African mining conditions. Proceedings of the Second International Workshop on Coal Pillar Mechanics and Design, Colombia. DHHS (NIOSH) Publications. Washington, D.C. pp. 63-70. [ Links ]
ISO. 1993. Guide to the Expression of Uncertainty in Measurement. International Organization for Standardization, Geneva. [ Links ]
Khakzad, N., Khan, F., and Paltrinieri, N. 2014. On the application of near accident data to risk analysis of major accidents. Reliability Engineering & System Safety, vol. 126. pp. 116-125. [ Links ]
Kelly, D.I. and Smith, CL. 2009. Bayesian inference in probabilistic risk assessment-The current state of the art. Reliability Engineering & System Safety, vol. 94. pp. 628-643. [ Links ]
Kirsch, C. 1898. Die theorie der elastizitat und die bedurfnisse der festigkeitslehre. Zeitschrift des Vereines Deutscher Ingenieure, vol. 42. pp. 797-807. [ Links ]
Li, D., Yan, L., and Shao, D. 2007. Reliability evaluation of earth-rock dams using Bayesian network. Engineering Journal of Wuhan University, vol. 40. pp. 24-29. [ Links ]
Martin, C. and Christiansson, R. 2009. Estimating the potential for spalling around a deep nuclear waste repository in crystalline rock. International Journal of Rock Mechanics and Mining Sciences, vol. 46. pp. 219-228. [ Links ]
Martin, C.D., Christiansson, R., and Söderhall, J. 2001. Rock stability considerations for siting and constructing a KBS3 repository: based on experiences from Äspö HRL, AECL's URL, tunnelling and mining. Technical Report TR-01-38. Swedish Nuclear Fuel and Waste Management Co., Stockholm. [ Links ]
Matarawi, A.E. and Harrison, J.P. 2017. Calibrated partial factors for support of wedges exposed in tunnels. Procedia Engineering, vol. 191. pp. 802-810. [ Links ]
Meel, A. and Seider, W.D. 2006. Plant-specific dynamic failure assessment using Bayesian theory. Chemical Engineering Science, vol. 61. pp. 7036-7056. [ Links ]
Mine Safety and Health Administration. 2000. MSHA's mine data retrieval system https://www.msha.gov/mine-data-retrieval-system [accessed 15 April 2020]. [ Links ]
Mishra, R. and Rinne, M. 2014. Guidelines to design the scope of a geotechnical risk assessment for underground mines. Journal of Mining Science, vol. 50. pp. 745-756. [ Links ]
Mishra, R.K., Janiszewski, M., Uotinen, L.K.T., Szydlowska, M., Siren, Τ., and Rinne, M. 2017. Geotechnical risk management concept for intelligent deep mines. Procedia Engineering, vol. 191. pp. 361-368. [ Links ]
Paté-Cornell, M.E. 2007. The Engineering Risk Analysis Method and Some Applications. Cambridge University Press, New York. [ Links ]
Paté-Cornell, M.E. and Dillon, R.L. 2006. The respective roles of risk and decision analyses in decision support. Decision Analysis, vol. 3, pp. 220-232. [ Links ]
Posiva. 2009. Olkiluoto site description 2008. Report 2009-01. Eurajoki, Finland. [ Links ]
Siren, Τ., Uotinen, L.K.T., and Martinelli, D. 2011. Assessment of the potential for rock spalling in the technical rooms of the ONKALO. Posiva, Eurajoki, Finland. [ Links ]
Smith, M. 2006. Dam risk analysis using Bayesian networks. Proceedings of the ECI Conference on Geohazards, Lillehammer, Norway. https://dc.engconfintl.org/cgi/viewcontent.cgi?article=1030&context=geohazards [ Links ]
Sousa, R. and Einstein, H. 2007. Risk analysis for tunneling projects using Bayesian networks. Proceedings of the 11th Congress of the International Society of Rock Mechanics, Lisbon. Taylor and Francis. pp. 1301-1304. [ Links ]
Sousa, R.L. and Einstein, H.H. 2012. Risk analysis during tunnel construction using Bayesian networks: Porto Metro case study. Tunnelling and Underground Space Technology, vol. 27. pp. 86-100. [ Links ]
Spackova, O. and Straub, D. 2011. Probabilistic risk assessment of excavation performance in tunnel projects using Bayesian networks: A case study. Proceedings of the 3rd International Symposium on Geotechnical Safety and Risk. Bundesanstalt für Wasserbau, München. pp. 651-660. [ Links ]
Thompson, H. 1950. Truncated normal distributions. Nature, vol. 165. pp. 444-445. [ Links ]
Zhang, L., Wu, X., Skibniewski, M. J., Zhong, J., and Lu, Y. 2014. Bayesian-network-based safety risk analysis in construction projects. Reliability Engineering & System Safety, vol. 131. pp. 29-39. [ Links ] ♦
 Correspondence:
R. Mishra
Email: riteshmining@gmail.com
Received: 14 Jan. 2019
Revised: 15 Apr. 2020
Accepted: 14 Mar. 2021
Published: June 2021

