


Serviços Personalizados
Artigo
 Inglês (pdf)
 Artigo em XML
 Referências do artigo
Indicadores

Links relacionados
-
 Citado por Google
 -
 Similares em Google
Compartilhar

 Permalink
Journal of the Southern African Institute of Mining and Metallurgy
versão On-line ISSN 2411-9717
versão impressa ISSN 2225-6253
J. S. Afr. Inst. Min. Metall. vol.121 no.5 Johannesburg Mai. 2021
http://dx.doi.org/10.17159/2411-9717/17386/2021
PROFESSIONAL TECHNICAL AND SCIENTIFIC PAPERS
Density - A contentious issue in the evaluation and determination of Resources and Reserves in coal deposits
L. Roux
Leon Roux Retired from Exxaro's Grootegeluk Coal Mine and continued with the Clean Coal Research Group at the University of the Witwatersrand during his research years preparing for this paper. Post Humous
SYNOPSIS
The initial evaluation of a coal deposit often raises uncertainty with regard to the accuracy of the reported Resources and Reserves. Reconciliation of results from mining and beneficiation with the original raw field data highlights deficiencies in original estimations. Credible Resource and Reserve estimation forms the basis on which an entire mining enterprise is motivated, initiated, funded, and established as a commercially viable proposition. This is required for sustainable extraction purposes and to support vital downstream industries such as power generation.
Accurate determination of the density of the matrix of the material being evaluated is the key to credible values being obtained for Resources and Reserves. Losses between 15% and 20% of the Resource/Reserve can be realized if incorrect densities are applied to the tonnage derivation. Coal plies and particles have different relative densities, determined by the maceral composition, rank, and mineral and moisture content. These factors in turn contribute to the moisture, volatile matter, ash and carbon contents of a coal, which affect the overall density of the raw coal. More specifically, the relationship of ash to density and the effective matrix porosity were found to be critical in solving the greater majority of the problems in predictive calculations.
A major deficiency identified is the inability to determine effective porosity, allowing absorption of adventitious moisture and altering the mass of the core sample. Although the volume of the raw material is altered through crushing, the change in mass after controlled air-drying, used with the original geometrical volume of the raw material, provides a credible air-dry density and allows the determination of the volumetric change related to effective porosity. This parameter can be validated through the evaluation of proximate ash using the ash-adjusted algorithm and a correction for the inherent moisture applied to also give a credible relative density value for an air-dried sample.
A combination of theoretical, empirical, and reconciliatory evaluations of the available data, taken from the exploration phase through the mining process to final production, has shown that an integrated approach using the ash-adjusted density (AAD) methodology, in conjunction with other evaluative techniques, provides credible results with a considerably higher degree of accuracy than is currently possible.
Keywords: coal, deposit evaluation, Resources, Reserves, density determination, ash-adjusted density.
Introduction
The evaluation of coal deposits from exploration through Resources and Reserves classification, mining and prediction of grades, application of interpretive measures in the overall evaluation of coal deposits, the behaviour of the raw feed material in the beneficiation process, and the final mass accounting of saleable products may be enhanced through the application of the ash-adjusted density (AAD) methodology (Roux, 2012)
Many uncertainties affect budgetary and forecasting purposes and the definition and quantification of saleable reserves. This is problematic in most coal deposits, particularly those related to specialized products with very strict quality specifications in newly developing coalfields or previously unexplored regions, which could be far more variable and difficult to assess than deposits in conventionally mined areas where a wealth of data has already been accumulated over time. Basic information that has been used historically for the determination of Resources and Reserves may be instrumental in portraying misleading results relating to either under- or overestimation of Resources and Reserves, especially in relation to tonnage estimations.
The crux of the matter relates to the accuracy of the density of the material being evaluated. Density per se underpins all Resource and Reserve estimations as well as reconciliation after mining. An in-depth study is required of not only the methods of density determination, but including variations with regard to the geology of the deposit, specifically the composition of the coal, the composition of its solid matrix, its rank, type, and grade, and pore fluids or gases, which all have an effect on the in-situ as well as air-dry or absolute density of the matrix material.
Preston and Sanders (2005) very aptly describe the situation relevant to probably one of the more important aspects at the beginning of the value chain. Density is a contentious issue. 'The relative density of coal is a fundamental physical parameter which should be well understood by geologists, who need to know the in situ relative density of coal for use in reserve calculations.' This, according to the authors, appears to be poorly understood and unfortunately also poorly documented, with virtually no practical definitive work having been done, apart from that of Smith (1991). Thus, the application of relative density in Reserve calculations is uncertain, or at worst incorrect. Quality Coal Consulting conducted a study for Pacific Coal (Preston and Sanders, 2005) to address this problem, with primary consideration being given to the relationships between coal density, coal porosity, and moisture. A prerequisite of any evaluation is the validation of the basic information from the original source. Uncertainty here could have far-reaching effects on the eventual evaluation of the deposit, especially with regard to its economic viability and sustainability.
In South Africa, all Coal Resources and Coal Reserves are classified according to the SAMREC Code and SANS10320:2004, which outline the standard method of reporting of Coal Resources and Coal Reserves through the application of the various technical parameters, and specifically the determination of GTIS (gross tons in situ), TTIS (total tons in situ) and MTIS (mineable tons in situ). Venmyn Deloitte found considerable inconsistency in the reporting of Coal Resources in the minerals industry, and particularly among South Africans and Australians. Some companies used GTIS, some used TTIS, and others used MTIS, with some reporting on all of these values in the interest of clarity. Note that the evaluation done here is based on information from the only currently operating mine in the Waterberg Coalfield in South Africa.
The JORC Code and the Australian Guideline for Estimating and Reporting are not as prescriptive, although the Guideline states that, 'Coal resources should be estimated and reported for individual seams or seam groupings within a deposit. They should also be subdivided and reported on the basis of key variables, such as thickness, depth range, strip ratio, coal quality parameters, geographic constraints and geological or technical considerations. The key variables and assumptions for each deposit should be clearly stated in order to ensure clarity and transparency of the report.' However, in a South African scenario, the use of different reporting standards for Coal Resources was found to be particularly problematic.
One particular scenario raising concern with regard to Coal Resource reporting highlighted by Venmyn Deloitte refers to the Waterberg Coalfield, where multiple seam deposits with intercalated shales occur in the Volksrust Formation. The multiple seams are delineated into sedimentary depositional zones, and sampling of these zones in some cases does not separate the coal from the interlaminated shale portions. The zones are modelled and the tonnages calculated, and Resource statements have quoted the tonnages pertaining to the whole zone rather than only the coal portion, which according to Venmyn can be misleading.
Venmyn Deloitte noted that the coal industry in South Africa is attempting to standardize one method of reporting. This has led to a re-assessment and re-writing of the SANS Code, which is currently underway. Revisions proposed have been used in this paper and the most critical initial values have been singled out for evaluation.
Considering the SAMREC Code and proposed revisions of SANS 10320; 2004, Mineable Tonnes In Situ Coal Resource refers to the tonnage and coal quality, contained in the coal seam, or section of the coal seam proposed to be mined, at the theoretical mining height, adjusted by geological loss factors and specific mining methods after the relevant minimum and maximum mineable thickness cut-offs and relevant coal quality cut-off parameters have been applied. For Public Reporting purposes all Coal Resource tonnages and coal quality must be reported as a Mineable Tonnes in situ Coal Resource (MTIS basis), with associated yield, coal quality and moisture content.
Coal Reserve reporting refers to, the Coal Reserve that is the economically mineable part of a Measured and / or Indicated Coal Resource, which includes diluting and contaminating materials and allowances for losses, which may occur when the material is mined or processed and is defined by studies at Pre-feasibility or Feasibility level, as appropriate, that include application of Modifying Factors and such studies which demonstrate that, at the time of reporting, extraction could reasonably be justified.
Key issues for the derivation of primary tonnage estimates are:
1. The in situ density of the coal adjusted from the laboratory determined relative density taking analyzed moisture content related to the in situ bed moisture content into account.
2. Geological loss factors applied to resource tonnages.
3. Theoretical mining height of the coal seam, or the optimal selected part of the coal seam that is expected to be mined, based on a geological assessment
4. The Resource that will be upgraded by washing in a coal processing plant, quantified by washed coal quality data for quality points of observation
5. The theoretical product yield being the laboratory estimate of the yield of the target product at a specific coal quality, or at a specific cut-point density, on an undiluted and uncontaminated basis.
Another point that could be added refers to the type of coal deposit.
6. A thick inter-bedded seam deposit or a multiple seam deposit.
The credibility of Coal Resource and Reserve estimations currently and conventionally obtained is questionable.
This relates to actual mined data being irreconcilable with the original raw data obtained from basic field evaluations during exploration. This is specifically applicable when in-situ raw density obtained through the application of the Archimedes principle in the determination of SG is used for tonnage estimations in geological modelling, mine planning, scheduling, budgeting, and production.
Problems experienced in correct tonnage estimations are largely due to the inability of the processes applied to establish an appropriate and verifiable reconciliation of material from Resource through the value chain of extraction, beneficiation, to production, including product tonnage prediction. Pre-determined predicted Resources and Reserves are essential for planning and scheduling of appropriate feed material to be supplied from the mine to the beneficiation plant and ultimately for the production of specified saleable products. This problem is further exacerbated by limitations with regard to accurate physical measurements that are needed to validate the results. Therefore, measurement, monitoring, and correct estimation are key issues in question.
Review
An assessment of tonnages extracted and compared to the original planned and budgeted figures, as well as attempts at reconciling the final data with the original basic data used for the determination of Resources and Reserves, has highlighted critical deficiencies in the entire process. These deficiencies are related to both the initial evaluation methods and the mining process (Roux, 2010).
To begin the assessment, the suggested addition of the type of coal deposit will be reviewed before the issues highlighted in the SANS proposed changes.
The type of coal deposit
The Volksrust Formation, classified as a thick interbedded seam deposit and which forms the upper part of the coal deposit, comprises intercalated shale and bright coal layers with an average thickness of about 60 m (Figure 1). It displays such a well-developed repetition of coal-shale assemblages that it can be divided into seven major sedimentary cycles or zones. Smaller sub-cycles ('samples') are contained within these zones; these were sampled individually during exploration of the deposit. The terms 'zone' and 'sample' are used at Grootegeluk instead of 'seam' and 'ply' due to the site-specific intercalated nature of the coal and shale.
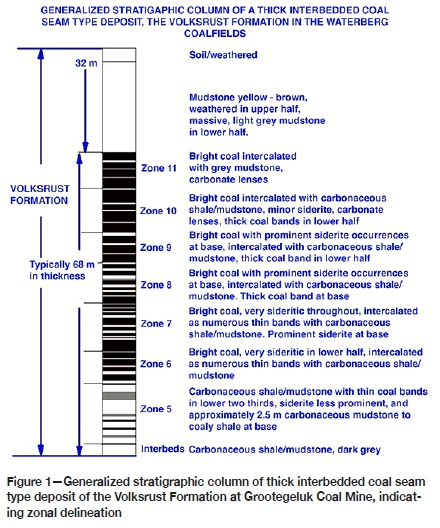
The Volksrust Formation zones typically start with bright coal at the base, with the ratio of coal to shale decreasing from the base of each zone upwards. The Basal Zone is the exception because the coal is more evenly distributed throughout this zone. The shales of the Volksrust Formation show an increase in carbon content with depth and range from a massive bluish-grey mudstone at the top to carbonaceous shales towards the Basal Zone.
Although the thickness and coal quality of the Volksrust Formation zones are reasonably constant across the coalfield, a large variation in the yield of semi-soft coking coal occurs vertically in the coal succession.
The mineralogy of the Volksrust Formation is dominated by kaolinite, quartz, and minor amounts of apatite in the lower portion while the upper portion is dominated by quartz, kaolinite, and minor amounts of montmorillonite, illite, and microcline. Calcite lenses occur predominantly in the upper half of the Volksrust Formation and have been interpreted as being syndepositional. Diagenetic globular pyrite and spherulitic siderite occur in the coals and organic-rich mudstones. The mineralogy of the mudstones and trace element concentrations suggest deposition in fresh water rather than marine waters. (Faure et al., 2002).
At Grootegeluk the zones were subdivided into sub-cycles (samples). The individual samples from the Volksrust Formation were further subdivided into a coal and shale component for stringers thicker than 1 cm. Stringers of less than 1 cm thickness were included in the overriding lithology, i.e. coal stringers in shale less than 1 cm were retained in the shale samples, while the same applies to shale stringers in coal samples. The coal and the shale components were analysed separately to enhance grade control functionality. The reasoning behind this was that if part of a recognized sample was left in the floor, or conversely mined out previously, this could be taken into account when compiling the mined vertical sequence and an adjustment pertinent to the actual material could be made.
The analytical results for the individual components were then composited to obtain values for the entire sample, including both the shale and coal components. Unfortunately, a Resource value for only the coal component (as suggested by Venmyn Deloitte) was not feasible due to the intercalated nature of the coal and shale components. The Resource would have to be beneficiated in order to extract economically viable coal, thus the shale component of these sub-cycles (samples) needs to be recognized as part of the Resource.
The Vryheid Formation (approximately 55 m thick) forms the lower part of the coal deposit and comprises carbonaceous shale and sandstone with interbedded dull coal seams varying in thickness from 1.5 m to 9 m (Figure 2). The Vryheid Formation is classed as a 'Multiple Seam Deposit Type according to the SAMREC Code. There are five coal seams or zones in the Vryheid Formation, all of which are composed predominantly of dull coal with some bright coal developed at the base of zones 2, 3, and 4. Due to lateral facies changes and changes in the depositional environment, these zones are characterized by a large variation in thickness and quality.
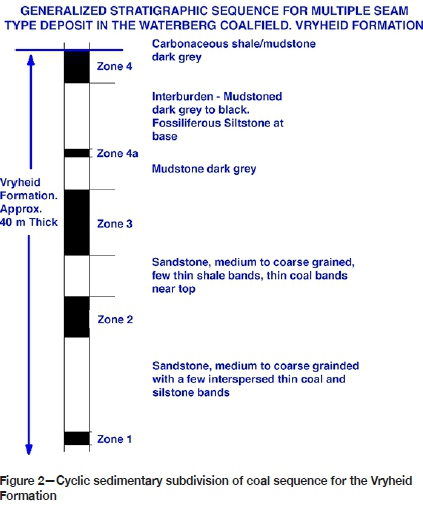
Zone 3 is the best-developed dull coal zone within the mine lease area, reaching a maximum thickness of 8.9 m. The basal portion of this zone yields a small fraction that has semi-soft coking coal properties.
Zone 2 is, on average, 4 m thick and reaches a maximum thickness of 6 m in the mine lease area. The basal portion of this zone also yields a fraction that has semi-soft coking coal properties. This zone is the most constant of all the Vryheid Formation coal zones across the entire Waterberg Coalfield regarding thickness.
Zone 1, the basal Vryheid coal zone, has an average thickness of 1.5 m, but varies quite rapidly being the lowermost coal layer in the sequence.
The distinct differentiation between the Volksrust Formation and the Vryheid Formation illustrates two different depositional environments, the Volksrust Formation being representative of an autochthonous deposit, while the Vryheid Formation is typically an allochthonous deposit.
The Vryheid formation is defined as a multiple seam deposit although also subdivided into sub-cycles for the individual seams. Each seam is treated as a single entity, coal only, therefore the Resources representing the seam are relevant to coal only.
In-situ density
Before one can consider determining the in-situ density of the coal an in-depth understanding of the matrix within the volume of the coal sample is required. Which properties of the matrix would have the greatest influence on the determined density of the coal? Would it be the volume occupied by the matrix, its mineral content, its moisture content, or its void content (porosity), also taking its permeability into account? The most basic definition of density refers to the mass per unit volume of the material being assessed.
Density = Mass/Volume
The volumetric component is the most complex property in the determination of the density of the material being evaluated.
The typical definition of volume in most dictionaries is given vaguely as 'the space occupied by an object'. McGraw-Hill's Dictionary of Scientific and Technical Terms (1984) does not say much more, their definition merely relates the object to three-dimensional space: 'A measure of the size of a body or definite region in three dimensional spaceIn order to appreciate the various conditions under which volume is defined, particle technology's lexicon used for these definitions can be found in the British Standards Institute (BSI,1991) and the American Society for Testing and Materials (ASTM,1994) documents. Here the 'volume' of a material is described as the summation of several rigorously defined elemental volumes.
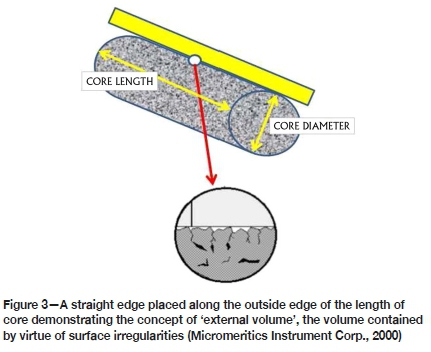
A cylindrical length of rock core can be used as an example of an object that contains all types of elemental volumes and differences in material volume according to the measurement technique, measurement method, and conditions under which the measurements are performed.
The rock core, obviously, is solid material with a volume that can be calculated after measuring its length and its diameter, from which its cross-section can be determined. However, it also contains surface irregularities, small fractures, fissures, and pores that both communicate with the surface and pores that are isolated within the structure. Voids that connect to the surface are referred to as open pores while interior voids inaccessible from the surface are referred to as closed pores. Surface irregularities compose another type of void volume. For example, assume the bulk volume of the core is determined from linear measurements of its length and cross-section. The value of volume determined in this way is limited in accuracy because the surfaces are not perfect. If a perfect plane were to be laid on one of the surfaces of the core, there would be many voids sandwiched between the two surfaces (Figure 3).
For lack of a standard definition, this can be referred to as 'external void volume' and will refer to the void volume between a solid surface and that of a closely fitting envelope surrounding the object. It does not include pores that penetrate the interior of the particle. The meaning of the term is admittedly vague, but this volume can be determined or estimated under certain analytical conditions and can provide an indication of surface rugosity. When a solid material is in granular or powdered form, the bulk contains another type of void: interparticle space. The total volume of interparticle voids depends on the size and shape of the individual particles, their sorting, and packing. (Webb, 2001)
The complexity of the term volume is highlighted by the following definitions:
➤ Absolute powder volume: (also called absolute volume): The volume of the solid matter after exclusion of all the spaces (pores and voids) (BSI).
➤ Apparent particle volume: The total volume of the particle, excluding open pores, but including closed pores (BSI).
➤Apparent powder volume: The total volume of solid matter, open pores, and closed pores and interstices (BSI).
➤Bulk volume: The volumes of the solids in each piece, the voids within the pieces, and the voids among the pieces of the particular collection (implied by ASTM D3766).
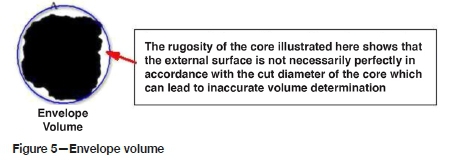
➤Envelope volume: The external volume of a particle, powder, or monolith such as would be obtained by tightly shrinking a film to contain it (BSI). The sum of the volumes of the solid in each piece and the voids within each piece that is, within close-fitting imaginary envelopes completely surrounding each piece (implied by ASTM D3766).
➤Geometric volume: The volumes of a material calculated from measurements of its physical dimensions.
➤ Skeletal volume: The sum of the volumes of the solid material and closed (or blind) pores within the pieces (implied by ASTM D3766).
➤True volume: Volume excluding open and closed pores (implied by BSI).
➤ Void: Space between particles in a bed (BSI).
If particle characteristics as shown in Figure 4 are reevaluated, the envelope volume (Figure 5) can be considered as being representative of a cross-section of the core sample retrieved from the borehole. It represents the geometric volume derived from the product of the cross-section of the core and its length, not taking rugosity shown in the figure into account and assuming that the core is an absolute solid.
Density derived from this would then simply be determined by the mass of the core divided by its bulk volume. No free moisture content is known since the core was not impeccably preserved on recovery and no moisture determination was done.
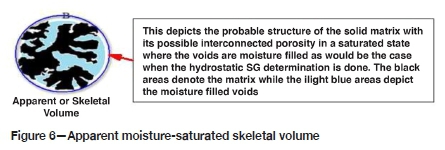
In the next case, reflecting probable skeletal volume, the core is subjected to Archimedes principle for SG determination and assuming saturation of the core, its mass in air divided by the difference between the mass in air and the mass in water gives a specific gravity for the entire sample, which is greater than the original density determined on the core as received. This is the result of water ingress during the procedure (Figure 6).
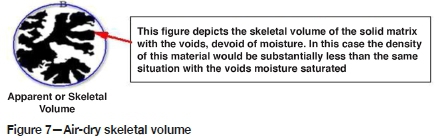
The core dispatched to an accredited laboratory is weighed on receipt, crushed, and screened to -13 mm +0.5 mm, air-dried under controlled conditions, and re-weighed before float/sink analyses are done. The air-dry mass is substantially less than the recovery mass; using this mass and the original envelope volume of the core results in a density substantially lower than the first two values obtained. This, however, is not representative of the true air-dry mass of the sample because the mass of the -0.5 mm fraction after screening is not reported or shown in the geological database. This -0.5 mm material is, however, used for a raw proximate analysis of the sample. The density value obtained cannot be deemed representative of the air-dry density and as such cannot be used to derive an accurate estimate of air-dry skeletal volume (Figure 7) of the matrix.
In order to determine the solid matrix percentage, the core needs to be absolutely air dry, its mass determined, and then submerged in water for the Archimedes determination of SG. If the Archimedes SG determination is conducted properly, allowing for complete saturation so that no air bubbles are observed during the submerged phase, the SG can be used to determine the volume capable of supporting that density for the air-dried mass of the core. This in turn can be subtracted from the original volume and the result expressed as a percentage of the original volume representing voids in the matrix. This percentage subtracted from 100% would be representative of the solid matrix of the core.
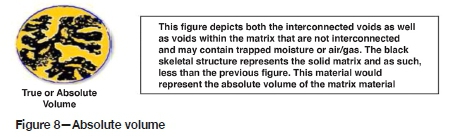
The last scenario, shown in Figure 8, depicts the absolute volume; here both interconnected porosity and closed porosity are shown. The closed porosity may contain gas, air, or moisture. The moisture may be representative of the inherent moisture, which can be released only during combustion. If the absolute dry density can be determined and the mineral volatile content, including inherent moisture, is known or determined, the air-dry density of the sample can be determined.
Considering the requirements for Coal Resource tonnage reporting and the stipulation that these tonnages are reported as 'mineable tonnes in situ' raises another problem if the in-situ moisture content of the coal beds is unknown. Groundwater levels, porosity, and permeability would greatly influence the in-situ density of the material being assessed. Consider two scenarios sketched in Figure 9, the first illustrating an exploration borehole intersecting a coal sequence under the groundwater table, the probability of the core retaining the moisture when it is recovered is relatively good. This core should, however, be immediately sealed to prevent moisture loss, sent to the laboratory and the moisture content determined. This moisture content would represent the in-situ moisture of the core. In the second example, in a purported dry borehole, the core may still contain some moisture, relating initially to interstitially trapped water and secondly to structural or inherent moisture. These values should also be ascertained since they will influence the overall apparent relative density of the material.
A third scenario to consider, sketched in Figure 10, is an exploration borehole that may have been drilled several years earlier, prior to any mining activities, but is now in a position where an opencast mining operation has advanced closer to the specific exploration borehole from which the original determinations were done. Groundwater, having drained from this area into the mine's sump over the years, is now at a level below some of the coal seams and the mining benches have been exposed to natural atmospheric and climatic conditions for several years, thus rendering them effectively dry.
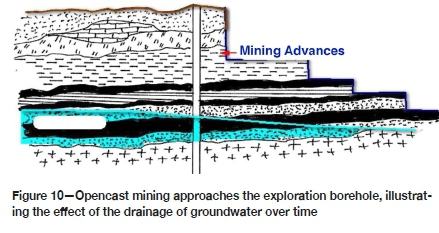
Information with regard to in-situ densities determined during the exploration phase, used for mineable tons in situ determinations, is no longer valid since the moisture content in the subsurface environment has changed over time.
Consider what the in-situ moisture content of this material would be. Assuming this is the same borehole shown in the first scenario (Figure 9, left), the moisture content in the upper benches may be the same as for the borehole drilled through a dry area, similar to the one shown in Figure 9, right. Surely it is no longer feasible to use the values initially obtained for an apparent relative density, especially if they were derived using the Archimedes principle method?
The most logical value to use would be representative of the air-dry relative density, which at least partially conforms to the material being mined. This value would allow more credible Resource and Reserve tonnage estimation and an improved planned volume of material to be extracted in order to satisfy budgetary predictions. Planned mining extraction should rather be based on volumes to be extracted in order to produce the required tonnages of matrix material.
Density and porosity
Traditionally, the basic method of determining the relative density of an assumed solid, such as coal, is to weigh it in air, then immerse it in water and weigh it again, the relative density being equal to the ratio of the weight in air to the loss of weight in water.
Analyses done by the University of Illinois as early as 1916 on relative density (at that time referred to as specific gravity) under varying conditions of moisture content add a whole new perspective to density determinations (Nebal, 1916).
The American Society for Testing and Materials book of standard definitions lists no less than 40 definitions for density based on mass per unit volume. The British Standards Institute reduces this to 14. The determination of the mass of an object is relatively straightforward; the determination of the volume, however, is complex. The volume of a solid object, whether it is a single piece or a mass of finely divided powder, is a concept that cannot be ascribed to a single, neat definition.
A more specific definition of relative density (RD)
At a temperature of 5°C the density of water is 1.0 g/cm3, thus the relative density of a material is its density relative to the density of water at 5°C. This property is a ratio, thus dimensionless, and is numerically equivalent to the density of the material. All relative density determinations require the mass and the volume of the material to be measured. The mass determination is simple; the volume determination however, as discussed earlier, both in regard to measurement and understanding in heterogeneous materials such as coal, is complex. This relates primarily to the porosity of coal and the variable degree to which different methods cope with this aspect of the determination. Since coal is porous, most of the contained moisture is held physically in its pores. The pores may be interconnected or isolated. Interconnected pores contribute to permeability thus, when coal is dried, its permeability allows some of the moisture to leave the pores, which become filled with air. If the dry coal is placed in water, the air in the pores is displaced by the water, and the coal becomes saturated. Under such circumstances the length of time that the coal is immersed before it is weighed affects the value obtained for the relative density.
True (or absolute) relative density should only be used to describe the relative density of a volume of pore-free coal, which by implication means that whichever method is used in determining the volume of the sample, the medium used must occupy all the pores, which in practice is very difficult. Helium, being the smallest atom, has the best probability of penetrating the greatest number of pores, thus the helium density method is the recognized method for determining this parameter. The availability of consistently reliable true or absolute relative density values for coal would make the estimation of in-situ relative density a straightforward process.
Apparent (or coal particle) relative density describes the relative density of lump coal which may contain pores, fissures, and moisture, the persistence of which in the actual sample may be variable, tending to give unreliable results when density is determined by the Archimedes method. A more precise determination can be obtained by use of the mercury density method, but similar to the helium method, the equipment required is not always available.
In-situ relative density
In-situ relative density refers to the relative density of the coal in the ground. The coal under confining pressure contains pores and fissures filled with water and dissolved gases. The relative density measurement of the coal in situ is the value that is used for the estimation of Coal Resources. This value may be calculated from the coal thickness (in situ), the core diameter, and the mass of impeccably preserved core lengths. The Australian Standard method of determining coal density is most commonly used, and although the method is cheap and easy to apply, the state of the sample when tested does not simulate the in-situ condition of the coal because the sample is ground to -212 pm, removing fissures and some pores. It is also air-dried, retaining its inherent moisture. The moisture thus retained is representative of the inherent moisture of the coal sample as determined by proximate analysis on the same sample.
The method involves measuring the liquid displacement, in either a density bottle or a volumetric flask, thus determining the volume of the ground coal sample; this is then related to the original weighed mass. The major problem with the method is the inability of the liquid to occupy all pores within the coal and thus displace all air and water. The result gives neither absolute relative density nor an in-situ relative density, although it is probably closer to the absolute relative density. Under rigorously controlled conditions, the standard density bottle method may give results closely approximating the true or absolute relative density for coal expressed on the air-dry basis.
This standard method does not replicate the conditions required for determination of in-situ relative density since the values obtained are tested on an air-dry basis, whereas the resources of coal in situ are not; the use of standard relative density in Resource and Reserve calculations is thought to result in an overestimation of Reserves. In order to convert the standard relative density to an in-situ relative density, the sample needs to be reconstructed to simulate original conditions, especially with relevance to the original volume, restoring the pores and fissures destroyed in the grinding process. The reduction in volume of the sample has a greater effect on the relative density than the loss of mass held in that volume.
If the voids are restored to their original state and refilled with water, both the volume and mass will increase. The volume, however, will increase at a rate higher than the mass and thus the sample density will decrease, trending towards unity, the relative density of water. The most critical information required here relates to the in-situ moisture content of the sample, since this would be essential for the calculation of densities, Reserves, coal handling mass calculations, and the estimation of product coal total moisture. To assess the in-situ moisture content of the samples, cores should be promptly bagged and sealed so that the total moisture retained can be determined by a laboratory.
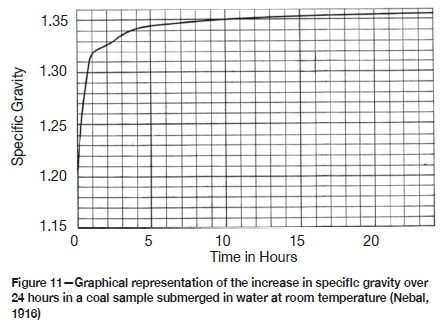
Research at the University of Illinois in 1916 on the effects of coal porosity illustrated the fact that the voids were air-filled as a result of being air-dried, the air being expelled when the sample was submerged in water for the density determination. This indicated the inherent problems that could be expected in determining the relative density of coal. It also indicated the differences in the specific gravity values obtained for purported fresh coal as opposed to the 'true' specific gravity of air-dried coal and the moisture contents of these coals. Several experiments were conducted to determine the effect on specific gravity of the expulsion of air through the replacement of water in the voids in an air-dried coal, as well as the time required for the expulsion of the air from interconnected voids. One of the interesting experiments in this range compared the specific gravity of fresh coal and that of the same dry coal. A range of samples were allowed to dry in the laboratory under constant temperature for 60 days. The specific gravity of the fresh coal averaged 1.28 g/cm3 while that of the air-dried coals was 1.19 g/cm3. The same samples were then subjected to boiling water in order to dispel air and the voids, now filled with water, raised the SG to 1.31 g/cm3. From this it was deduced that the moisture loss of the fresh coal was dependent on the original moisture content of the coal, the porosity of the coal, the humidity in the air to which the coal was exposed, and the final loss dependent on the period of time that the coal was exposed to air. Subsequent experiments were then done to ascertain the density of coal samples from an air-dry condition to probable full saturation, and the concomitant changes in apparent density over time. It is interesting to note that the greatest change took place within the first two hours, as shown in Figure 11.
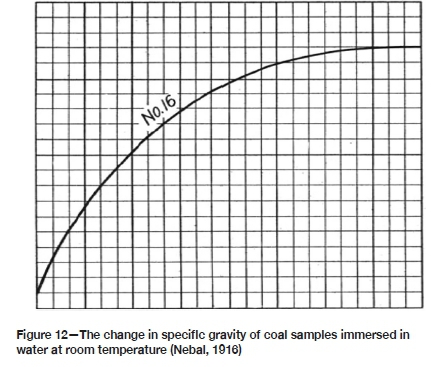
The experiment was repeated with the values being determined over shorter time periods to assess the rate of change within the first 2 hours. This is shown in Figure 12. Here again the greater part of the change was noted within the first hour of immersion, the specific gravity increasing from 1.16 g/cm3 to approximately 1.30 g/cm3, and eventually to 1.32 g/cm3 after two hours.
This early experimental work highlights the possible error with regard to so-called relative density and the effect on the relative density as a result of, the porosity of the medium and whether the pores are air- or water-filled. The effective porosity or moisture-holding capacity would have to be taken into account when considering which value of 'relative density' should be used in Resource and Reserve tonnage determination.
Considering values obtained in the field, such as relative density determined by the Archimedes principle, and the availability of appropriate information, it is extremely difficult to assess the relevant in-situ density of the coal from data obtained at the exploration site. These initial values, however, can be partially validated when the laboratory results are received.
Literature studies and personal communication with experts in the field (Pinheiro, pers. comm.) has revealed the most common methods of determining in-situ relative density are by the Archimedes principle and by pycnometry through the application of the Australian Standard method (AS1038.21 Item 4). The value obtained from the Australian Standard method should not be used for Reserve calculations since the values obtained are on an air-dry basis and coal Resource/Reserve calculations are not - they are based on in-situ values. The sample used for this determination, after preparation, is no longer representative of its original state with regard to volume and moisture content and can therefore result in an overstatement of Reserves (Preston and Sanders, 2005), Such values can be compensated to reflect the probable in-situ density by applying a change of basis equation converting coal relative density from one moisture basis to another, provided that the appropriate inputs with regard to moisture content are known.
The equation used for this is:
RD2 = RD1 χ (100 - M1) / (100 + (RDŁ χ (M2 - M1) - M2))
where
RD1 = old RD, which is the RD determined via the density bottle
M1 = Old moisture, which is moisture content determined from the original core sample as sealed and preserved in the field on extraction from the core barrel
RD2 = new RD
M2 = new moisture (which is moisture retained in the pulverized sample, probably representative of the inherent moisture.
This change of basis equation will enable the relative density of coal to be converted from one basis to another provided that the information used is reliable. If no information relating to the core's adventitious moisture content in the field is available, this method cannot be used.
Example:
RD from density bottle 1.93 g/cm3
Moisture content of core sample 20%
Inherent moisture from proximate analysis 2% RD2 = RD1 χ (100 - M1) / (100 + (RD1 χ (M2 - M1) - M2))
= 1.93 χ (100 - 20)/(100+(1.93 χ (2-20) - 2)
= 154.4/81.93
= 1.88 g/cm3 relative in-situ RD
A different approach to the estimation of in-situ relative density was developed by Peabody Energy (Robeck and Huo, 2015). The mineral matter content is used with relative to estimate pure coal and mineral densities for given data-sets on a dry basis. A hyperbolic regression is then used with known in-situ moisture values to predict in-situ relative density for all raw samples.
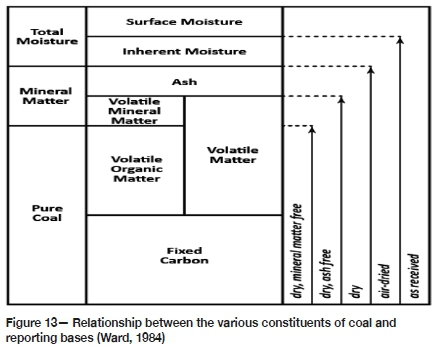
Robeck and Huo's approach was to provide a solution for the contentious problem related to Resource and Reserve tonnage estimations through a fully deterministic RD vs. ash relationship. Their approach determining mineral matter content was applied because ash, although representing the indestructible mineral matter, is considered a combustion product and thus not representative of the original mineral matter content. The reason for this being that mineral volatiles such as H2O of hydration, CO2, SO2, salts (e.g., Cl), carbonates, and sulphides are lost during combustion (Ward, 1984) and the remaining solid residue (ash) is less than the original mineral matter (Figure 13).
Complications due to (a) mineral composition, (b) coal maceral distribution, and (c) the presence of water- and air-filled pores detract from the simplistic two-phase mixture of coal and rock. Primary and secondary mineral composition may vary widely, and coal maceral content is determined by a number of factors, including rank, vegetation type, and environment of deposition (Renton, 1982).
Densities and mineral matter ratio values are shown for a few of the most common minerals in Table I. The ratio (r) is directly related to the percentage mass loss. This relates to the mineral volatiles percentage lost. Individual mineral densities vary and most distributions average between 2.5 and 2.8 g/cm3. The ratio can range from 1 to almost 2 depending on the mineral constituents. Similarly, the density of coal macerals can range from 1.03 to 1.70 g/cm3.
Although coal density is a function of rank, increasing with degree of lithification (Smith, 1991; Sanders, 2003), maceral composition contributes to the variability of densities within the same rank. The influence of rank is attributed to changes that occur as rank increases and volatile elements (H, N, and O) are lost.
Several different models, formulations, and methods applied by various authors were evaluated by Robeck and Huo and used in the formulation of their proposed new approach correlating density to mineral matter, which would improve their predictions. The authors do, however, recognize the influence of unsaturated in-situ porosity and acknowledge that it has not been addressed in this method because void porosity is a volumetric percentage while the relative concentrations of coal, mineral matter, and moisture are mass weighted percentages. They claim that the amount of air-filled porosity (free gas) is small in high-rank coals and can safely be ignored in saturated coal seams. This may be true for high ranking coals, but lower ranking coals have greater effective porosity and moisture holding capacity.
Unless sampled core is impeccably preserved (sealed) on recovery so that the true moisture saturation can be determined and related to its in-situ state, the percentage of saturation and voids play a major role in varying determined densities for the samples. The volumetric component therefore makes a far greater contribution than mineral volatiles lost upon combustion. The authors also admit that the single greatest source of error in density estimations is the choice of in-situ moisture values.
Empirical formulae derived by Fletcher and Saunders (2003) based on a range of black coals (and not necessarily applicable to all basins or coal types) may have found applicability in both Australia and North America. No moisture holding capacity or equilibrium moisture data was available for their work. Their study attempted to use an empirical multivariate equation developed by Meyers et al. (2004). This equation proved unsuccessful so the authors used an assumed constant moisture value for coal and mineral matter that was consistent with earlier analytical work and JORC reports.
Porosity
Coal moisture content plays an integral part in contributing to changes in relative density. Porosity per se provides the capacity for moisture or gas storage and is also an integral part in the overall structural composition of the materials matrix, and depending on the nature of the fluid or gas that may be contained within the pores will have an effect on the density of the material. Porosity by definition in the geological sense is the volume of the non-solid portion of the rock filled with fluids or gases, divided by the total volume of the rock, and is defined by the ratio (Anderson,1975).

where VVis the volume of void space (such as fluids) and VTis the total or bulk volume of material, including the solid and void components. Porosity is a fraction between 0 and 1, typically ranging from less than 0.01 for solid granite to more than 0.5 for peat and clay. It may also be represented in percentage terms.
The highest porosity normally anticipated in rocks is 47.6% (Crain, 2010). A more probable porosity is in the mid-twenties range. The normal range of porosities in granular systems is 5% to 35%. In general, porosities tend to be lower in deeper and older rocks, due primarily to overburden stresses on the rock (compaction) and cementation.
Porosity in coal can be a combination of both primary and secondary porosity, the latter referring to an enhancement of overall porosity as a result of chemical leaching of minerals or the development of fractures associated with stress in the system. This can replace the primary porosity or coexist with it. Porosity can be further subdivided into effective porosity (interconnected porosity), referring to the fraction of the total volume in which fluid flow can effectively take place, and closed porosity, referring to the fraction of the total volume with fluids or gases confined within the matrix (impermeable).
Understanding the morphology of the porosity is thus very important for groundwater, petroleum flow, and in the case of coal, surface and inherent moisture content entrapped in coal. It is a well establi-shed fact that coal is a porous substance and that both the pore size distribution and total pore volume vary, depending on a number of factors.
Various systems of classification of the pores have been proposed by different authors (van Krevelen, 1993). Consensus has been reached with regard to classifications resulting from high-resolution electron microscopy, where coal is characterized by a dual porosity consisting of macropore and micropore systems.
The micropore system consists of pores less than 2 nm in diameter and which occur as part of the matrix, while the macropore system is related to the fracture network designated by the cleat system, bedding planes, and surfaces (van Krevelen, 1993). Macroporosity refers to pores that are greater than 50 nm in diameter. Flow-through macroporosity is described by bulk diffusion. Mesoporosity refers to pores that have a diameter between 2 nm and 50 nm. Microporosity refers to pores that are smaller than 2 nm in diameter. Movement in micropores is by activated diffusion.
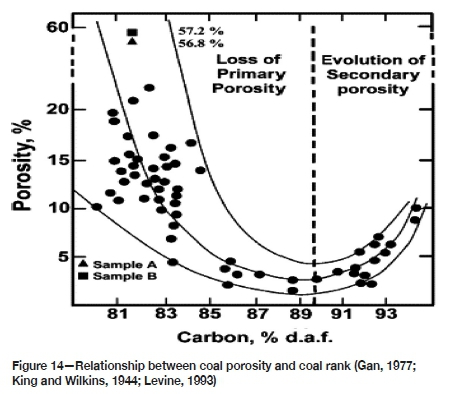
Lower rank high-volatile bituminous coals and sub-bituminous coals have a relatively high total porosity and a high proportion of intermediate pore sizes. High-rank bituminous coals have no intermediate sized pores and appreciably lower microporosity, while lignites on the other hand have high levels of macroporosity. Figure 14 illustrates the effect of coal rank on porosity. Macropores predominate in the lower ranks, while geophysical factors relating to compaction and water expulsion gradually reduce the porosity in the higher ranks. The development of secondary porosity begins with the formation of micro- and mesopores at approximately the low-volatile bituminous coal rank designation, implying an increase in porosity due to progressive changes in the molecular structure through the higher ranks.
Porosity is related to the maceral composition, where microporous content is found predominantly in the vitrinite content and meso- to macroporous content predominates in inertinite (Gan et al,, 1972; Unsworth, Fowler, and Jones, 1989; Lamberson and Bustin, 1993; Levine 1993).
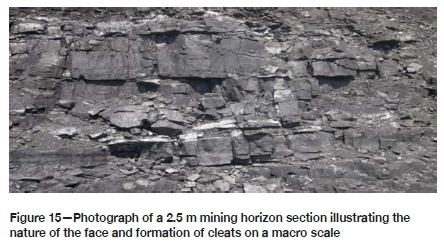
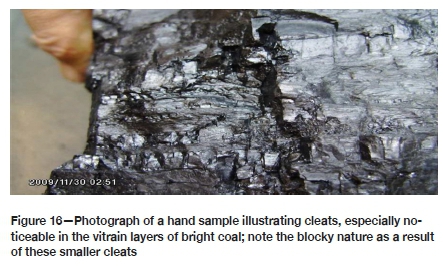
Coal porosity is also associated with cleats within the coal seams. Cleats are natural opening-mode fractures in coal beds. They usually occur in two sets that are, in most instances, mutually perpendicular and also perpendicular to the bedding. These fracture sets, and partings along bedding planes, impart a blocky character to coal (Figures 15 and 16). Cleats account for the predominant natural porosity and permeability paths in coal seams. Coal cleats are extensional fractures that formed, especially in the vitrain layers, as a result of active coalification processes and fluid pressure exerted during tectonic events (Close, 1991).
Vitrain/non-vitrain interbeds, which have different mechanical properties, were subjected to different strain magnitudes during these tectonic episodes, which also favoured fracture genesis. In the light of the effects of coalification on cleat development, Levine (1993) noted that porosity of coal is a function of molecular interactions. Levine's study suggested that cleat porosity is related to the compositional constituents, namely the macerals and minerals, as well as the maturity of the coal, which changes with the coalification process.
The relationship between porosity and carbon content was determined using laboratory tests on coal samples (Ettinger, 1960). The results showed that minimum porosity occurred at a carbon content of approximately 70 to 80%, representative of low-volatile bituminous to medium-volatile bituminous coal. Jones et al. (1988) found that the mechanical properties governing the apertures and frequency of cleats were related to coal type and rank. More recent work, however, has shown that the lowest porosity occurs at a dry mineral matter-free fixed carbon content of approximately 89%, as shown in Figure 14 (King and Wilkins, 1944; Levine, 1993).
The cleats, however, contribute to the moisture storage capacity of the coals in addition to moisture storage within the micro- through macropores related to coal type maceral composition and rank.
One remarkable attribute of cleat formation is the extent to which they are developed in many coal beds of nearly all ranks in maturity. Cleats are typically much more intensely developed than fractures in adjacent non-coal rocks. Bright coal lithotypes (vitrain) generally have closer spaced cleats than dull coal lithotypes (durain).
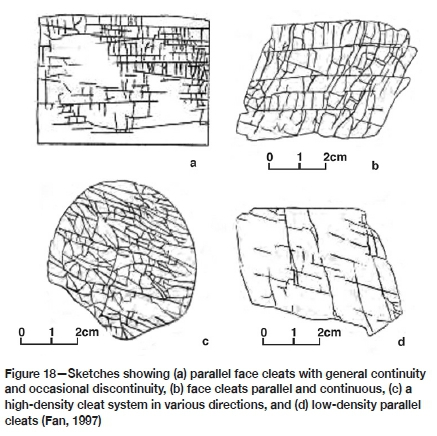
Coals with low ash content tend to have smaller cleat spacings than coals with high ash content. Organic-rich shales also commonly have closely spaced fractures that resemble cleats. (Close,1993) On a more diminutive scale, the sketches in Figure 18 shows examples of cleat formation and an indication of the extent of cleat formation in some hand samples.
It is evident that coal porosity, and as such relative permeability, can be highly variable. The movement of or saturation by moisture would in many instances be by diffusion, thus a reasonable amount of moisture would be retained in such a structure even if the large specimen were exposed to natural drying. This moisture is additional to the structurally bound moisture.
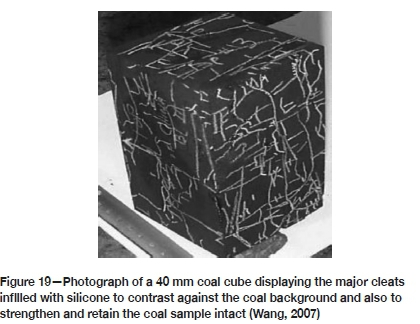
An interesting study was conducted by Wang (2007) on the influence of coal quality factors on seam permeability associated with coal bed methane production and cleat studies, which illustrates the reality of the cleat formation perfectly. The emphasis of this study was on the major cleats and involved the reduction of coal core samples to 40 mm cubes, which were treated with silicone gel in order to harden and preserve the samples. The cubes were then polished, removing the rough surfaces and resulting in a smooth shining surface on which the major cleats, spacing, length and apertures could be measured (Figure 19). This was illustrative of the major cleats regarded as connective and providing a major contribution to seam permeability as well as contributing to increased porosity.
It is against this background that the research was undertaken as it is believed that every effort should be made to obtain the correct information with regard to the true density of coal in order to establish a realistic evaluation of a given coal deposit.
Geological losses
From the foregoing review of density, porosity, and moisture content, the major geological losses are related to porosity and moisture content of the matrix material. Quantification of these losses would enable a more accurate estimation of resource tonnages.
An evaluation of predicted product yields and the differences noted between the predicted values and actual plant production via the application of ash-adjusted density (AAD) initiated research concentrating mainly on the beneficiation aspects and in-house determined correlation factors that were applied to specific regions in the mine. This was based on the optimal yield and cut density prediction for semi-soft coking coal and power station middlings coal in the Waterberg Coalfield, Limpopo (Roux. 2012).
The results obtained allowed the negation of a collection of different correlation factors relating to the origin of the raw feedstock material. These factors were reduced to a single correlation factor specific to a particular beneficiation process. It was based on the beneficiation plant's capabilities and efficiency, the physical nature of the run-of-mine material, its reduction to a specific top size before processing, and the actual results obtained, irrespective of the origin of the material. The implementation of this methodology after the plant-specific correlation factor had been applied to the theoretically determined product yields improved the predicted values to such an extent that the beneficiation plant's products were conforming with the predicted values. (Roux, 2012).
The probability that the correlation factor could be removed entirely still existed, however, since the correlation factor, although plant-specific, was based on plant production results, and a deficiency equivalent to the difference between the plant-specific correlation factor and a 100% theoretical yield value determined from the cumulative wash table remained. This difference at the time was approximately 17.82%.
If this difference could be accommodated and negated then the reconciliation loop would be complete and it would support the values obtained from the geological model, resulting in increased confidence in the credibility of the data. Paramount in this evaluation was consideration of the relationships between coal density and porosity, with porosity and interrelated permeability playing a major role in varying densities for the same volume of material.
Methodology
Three approaches to validate the determination of credible density values, namely, the revised AAD methodology (Roux, 2012), the evaluation of pure coal and mineral matter (Robeck and Huo, 2015), and the Australian Standard method (pycnometer or density bottle) were used.
Ash-adjusted density
The original theory with regard to the AAD methodology as outlined by Roux (2012) was based on distribution and cumulative frequencies of the float fraction values from a 31 000 sample data-set. This resulted in a linear regression for the ash/ density relationship where RD = 0.0136 χ Ash% + 1.198, giving an R2 value of 0.99.
The sample data-set was re-evaluated by deriving descriptive statistics for each sample float fraction and regressions on the mean, median, and mode values to complement and enhance the earlier work on the data-set. The re-evaluated statistics for the ash content at the coal float fractions are presented in Table II.
The revised regression based on the median values (Figure 20) is:
Absolute dry RD = 0.0130 χ Ash% + 1.2384
This gives a better result than the previously determined regression since the derived equation validates the petrophysical matrix density of bituminous coal as published by Schlumberger, where a matrix density for bituminous coal is given as 1.24 g/cm3, for anthracite 1.47 g/cm3, and lignite 1.19 g/cm3.
The first part of the equation represents the incremental indestructible mineral content of the sample, with the intercept being represented by a constant equivalent to the matrix density of a bituminous coal. The AAD value represents the absolute dry density of the float fraction. The expected air-dry density was approximated by including the effect of the inherent moisture content derived from proximate analysis.
The resultant density value was found to be slightly higher than the AAD value determined.
A reconstruction of the sample to in-situ relative density could then be calculated, provided that the free moisture content and air- or gas-filled voids of an impeccably preserved sample are known.
Evaluation of pure coal and mineral matter for in-situ density determination (Robeck and Huo, 2015) - the Gray method
The proposed evaluation requires an estimation of mineral matter content, and the most commonly used method is the Parr formula (Rees, 1966).
where Stot = total sulphur (dry)
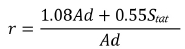
and the mineral matter ratio is determined by
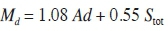
An alternative, the Gray method in which Mdcannot exceed 100%, accounts for a wider range of mineral volatiles and reveals changes in mineral content with increasing ash.
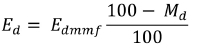
This only requires specific energy (CV) and ash, and is the most robust, particularly for high-ash samples. The relationship between dry CV and mineral matter is given by:
where
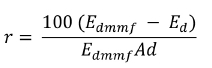
Ed= Specific energy, dry, expressed in MJ/Kg
Edmmf= Specific energy, dry mineral matter free The mineral matter ratio is determined by
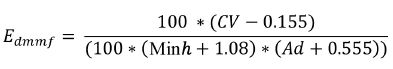
The dry mineral matter-free CV is determined by:
Mineral matter content is then derived by: Md = rAd
The determination of the air-dry density of the sample is then obtained from the equation:
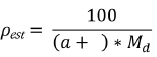
where coefficients a and b are determined by:
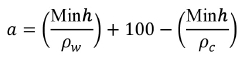
where pcrepresents the matrix density of bituminous coal, 1.2384 g/cm3c and pwis the density of water at 5°C, 1.0 g/cm3.
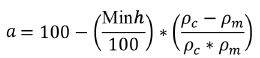
where pm= density of the mineral matter (here 2.53 g/cm3 was used for Waterberg coals).

and
The individual densities of the samples can then be obtained from the following equations.
Australian Standard method (AS1038.21 Item 4)
The most common method used is the Australian Standard method (AS1038.21 Item 4) where the coal sample is pulverized to -212 pm, thereby removing fissures and some pores. It is then air-dried, retaining some (but not all) of its in-situ moisture, weighed, and submerged in a density bottle or volumetric flask. The amount of water displaced relates to the volume of the ground material, which is then divided by the mass to obtain the relative density, referred to as the standard relative density.
Research and evaluation results
Ash-adjusted density validated against laboratory-determined density
An exploration borehole, sampled and dispatched for analyses, was treated in the normal way according to the standards followed by the accredited laboratory responsible for the analyses. In addition to the normal float/sink and proximate analyses, it was requested that the true relative density of each float fraction be determined using the density bottle method (Australian Standard method) at the same laboratory. These values were compared with AAD values obtained by application of the derived algorithm to ascertain the accuracy of the algorithm. The two sets of results, i.e. laboratory true density and AAD values, were found to be very close.
The 'true relative densities' of 741 float and sink fractions were determined according to the Australian Standard method, AS1038.21 Item 4. In the process of converting a coal sample to a ground, air-dried state the greatest change is noted in the volume, which has a greater effect on the relative density than the loss of mass. In this situation, the density trend would approximate the absolute density of the coal.
The float and sink wash data for the individual coal and shale samples from the exploration borehole was evaluated. The coal and shale samples were combined for the separate stratigraphic units' AAD-derived densities and the re-determined laboratory densities were compared and statistically evaluated at a 99.9% confidence level. The cumulative probability of the difference between the two measured data-sets showed a very positive result. The coal and shale sample data was then combined and re-evaluated statistically. The individual coal and shale results, as well as a combination of coal and shale results, are shown in Figure 21.
All three sets of values obtained at various confidence levels indicate a high level of accuracy. Since this evaluation is based on a comparison between AAD calculated values and laboratory-determined values, it is apparent that the AAD methodology can be used confidently for predictions of dry densities in coal assessments. Minor differences between the two data-sets (the AAD results and the density bottle results) are attributable to the inherent moisture content of the samples. The AAD values had not been corrected to accommodate the inherent moisture content, thus they represent an absolute dry matrix density, and if this correction is applied the values would be comparable with an air-dry density.
This research was confined to the crushed, air-dried -13 + 0.5 mm material that was sink/float separated to obtain a range of fractions for further analysis. The values pertinent to the true density of the matrix material were assessed by re-determination of the relative density through the application of the ash-adjusted density algorithm and then compared.
The samples require reconstruction to resemble the raw material prior to crushing. This needs the restoration of the sample to its original volume, which can be achieved by considering properties such as moisture content and porosity, both of which were altered during sample preparation when the sample was pulverized to -212 μιη for the pycnometer density determination.
Evaluation of pure coal and mineral matter for in-situ density determination (Robeck and Huo, 2015)
The air-dry relative density values for the exploration borehole samples were obtained by applying the Gray method. This pertained to the air-dry density of the samples because information on the free moisture content was not available. This approach was comparable to the AAD methodology since the AAD results refer to the absolute dry density of the samples (density excluding inherent moisture).
A chart similar to the 'Fish Diagram' developed by Robeck and Huo (2015) was populated with Waterberg coal data derived using both the Gray and Parr methods. As r increases on the y axis, the amount of mineral volatiles also increases (Figure 22). The relative position between zero and the 100% limit indicates the relative coal/mineral content. The area to the right of the 100% line is indicative of the amount of inorganic volatile matter (Robeck and Huo, 2015). Values below approximately 23% ash content are less reliable and may be approximated by the average of the Parr data-set at 1.12; the mean for the Gray data-set is 1.20.
Note that the Waterberg samples exhibit an abundance of kaolinite with minor silicates. Three sets of data - values derived from the AAD method, values from the Gray adapted method, and lastly the laboratory-determined density bottle values - were then plotted for comparative purposes.
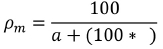
The values determined from the AAD and Gray methods represent absolute dry (for AAD values) and air-dry densities. The AAD values have been adjusted from an absolute dry basis to an air-dry basis based on the inherent moisture content for a 100% yield so that all three data-sets are now comparable. Note that the matrix density of bituminous coal at 1.24 g/cm3 and that of the mineral content at 2.53 g/cm3 are the same as the values used in the AAD evaluation, and have been used in the Gray method. Trends established by the AAD and Gray methods correlate almost perfectly, with a slight divergence in the higher ash regimes, as shown in Figures 23, 24, and 25.
Note that the laboratory values up to 2.0 g/cm3 are generally lower than both sets of calculated values. Although these samples are air-dry, containing their inherent moisture, they are less dense than the calculated equivalents, implying an air-filled volumetric difference contributing to the lower density.
The calculations did not include estimations of in-situ moisture and the final estimation for an in-situ relative density. The absence of any data relevant to moisture content of the cores on recovery led to the determinations being terminated at an air-dry equivalent.
Variability of densities
In order to illustrate the variability of densities over a period of time a further set of samples was taken randomly from a borehole in the deeper part of the Waterberg Coalfield where the entire succession was well below the regional groundwater table. The purpose was specifically to test various density determinations, as well as helium pycnometry, in an attempt to justify the decision to terminate evaluations at an air-dry equivalent value.
The results are portrayed in Table III. The samples were not impeccably preserved; they had been exposed to atmospheric conditions for about two weeks after recovery from drilling and thus were partially dry. The field mass would therefore have been partially dry. The samples were sent to an external laboratory for specified relative density determinations, but this could not be done and the samples were returned and stored for approximately 7 months before being sent to another laboratory for helium pycnometry.
The first set of data was derived on an as-received basis. The samples were then dried at 105°C for 24 hours and re-tested, giving more representative air-dry results. The final set of data was determined after the samples had been re-submerged in water for 48 hours, presenting a different set of results.
This illustrates the susceptibility of the samples to moisture absorption from the ambient atmosphere and raises doubt with respect to densities other than air-dried densities for Reserve calculations. The variability of results obtained is directly related to the effective porosity of the samples and the ambient environmental and atmospheric conditions.
An example, following the practice with known and derived values evaluated for each of the mentioned methods, follows. In this case a sample of exploration core, 257 cm long with a cross-section of 117.81 cm2, weighing 46.440 g on recovery, was used.
The initial data available was the mass in air, mass in water, and the calculated bulk (geometric) volume. There was no data relevant to total free moisture content since the core had not been impeccably preserved on recovery. A field specific gravity determination by the Archimedes principle was then done prior to the core being dispatched to an accredited laboratory for further analysis. The SG value obtained was used to represent the in-situ density of the core and in the determination of resource tonnages.
Returning to basic concepts in order to assess the differences, the basic equation of Density = Mass/Volume and variations of this equation were utilized to determine different values dependent on given variables.
The recovered mass of the core sample was 46.440 g and its bulk volume was 30 227 cm3, which gave a density of 1.53 g/cm3. The Archimedes-determined SG was 1.68 g/cm3. The most significant change here related to the mass of the sample; applying the density derived via Archimedes resulted in a calculated mass of 50.177 g, a 3.737 g difference. This is equivalent to approximately 7.5%, which can only be attributed to the moisture absorbed by the core during the hydrostatic determination. The difference in calculated volume and the original geometrical volume is also approximately 7.5%. Neither of these densities is suitable to use as an in-situ density value because the adventitious moisture content on retrieval is unknown.
The core was then dispatched to an accredited laboratory for further analysis. On reception the core was again weighed and the mass received recorded. It was then crushed to a -13 mm top size and screened to include the -13 mm and the +0.5 mm particles. The crushed material was air-dried under controlled conditions of temperature and humidity and once again weighed before float/sink analysis was done on the crushed material. The mass thus obtained was used in conjunction with the original volume, producing yet another density value, substantially less than the previously determined densities. In this case the air-dried mass of the -13 mm +0.5 mm material was 41.113 g (the calculated equivalent mass was 41.109 g) and the derived density was 1.36 g/cm3. This density was still not representative of the solid matrix because no mention was made of the -0.5 mm fraction after the screening had been done. This fraction's mass should have been included for the mass to be representative of the solid matrix within the overall measured volume of the core. Fortunately this value was available for this sample. The -0.5 mm mass was 2.990 g, thus taking the total to 44.103 g representing the air-dry mass of the material on which float and sink and proximate analyses were done. The revised density using the above mass would then be 1.46 g/cm3. If this density represents the particulate solid material of the matrix then its equivalent volume within the total core can be determined. Table IV illustrates the initial field and preliminary laboratory evaluation of mass, volume, and density.
The equivalent volume for an air-dry density is represented by 87% solids and 13% voids for this sample measured against the Archimedes-determined SG, assuming that the core was entirely saturated. Float/sink analysis at fixed density values ranging from 1.35 g/cm3, 1.40 g/cm3, and then at 0.1 g/cm3 intervals to a 2.20 g/cm3 float with a final sink value greater than 2.20 g/cm3 were then done. Each float fraction was then pulverized to -212 μπι for the density bottle RD determination according to procedure AS1038.21 Item 4 and subsequent proximate analyses of each float fraction. The results are shown in Table V.
The proximate analyses shown in Table V were composited into a representative wash table of coal and shale combined. This was then cumulated to represent the effect of each additional yield from the basic 1.35 g/cm3 through to the 2.20 g/cm3 sink value. The AAD algorithm was applied to each float fraction to determine the absolute dry density and then corrected to an air-dry density by taking the inherent moist content into account. The density bottle values were also included in the wash tables for comparative evaluation. A summary of the masses, volumes, densities, and perceived percentage solids and voids for the varying densities determined is displayed in Table VI.
From the foregoing, very little difference is evident between the methods utilizing the analytical data. Densities of 1.45 g/cm3 to 1.46 g/cm3 were obtained using an average correction factor of 0.83 for the solid matrix, which implies that the effective porosity of this sample is approximately 17%.
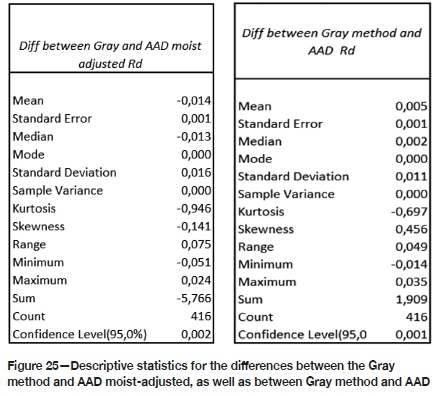
Figure 26 shows the volumetric differences by the different methods applied. The first three, namely field mass, Archimedes, and laboratory air-dried densities, are all based on the original bulk volume of the core sample and show very little to no variation, whereas the values derived from AAD on raw analysis, AAD on cumulative density, pycnometry (density bottle), and finally the Gray method are on average 17% lower than the geometrical volume.
If the original laboratory mass of 46.274 g and the determined air-dry density of 1.46 g/cm3 are taken into account, the volume to support this density would be 31.695 cm3, which is 1.418 cm3 greater than the original geometric volume (30.277 cm3) and by implication suggests more core than the original. The original core length was 257 cm and the cross-section117.81 cm2, therefore the extra volume would represent approximately 12 cm more core, increasing the original length to 269 cm. Since the core cannot stretch or grow, the only logical explanation is that the additional volume represents the voids/ porosity of the solid matrix and that the solid matrix within the confines of the geometric volume is therefore equivalent to 100% less the depicted void volume, in this case 17%, thus the solid matrix is only 83% of the total volume (Figure 27).
If the densities determined from the various methods were, however, used to calculate in-situ tonnages without corrections related to possible geological losses as determined by the volumetric evaluations applied, the net result would be substantially overestimated values (Table VII).
The overestimation is determined by the final percentage by which the calculated value exceeds the mass of the measured air-dry material, i.e. the Archimedes-calculated mass of 50.865 g measured against 44.103 g results in an overestimation of 15.07%. It is also apparent that the field mass volume contains a fair percentage of moisture.
It is of paramount importance that the methods under consideration are fully understood and that the AAD evaluation on the proximate analytical values needs to be adjusted to account for the inherent moisture of the coal, since the AAD gives an absolute dry density for the coal. The inherent moisture content determined for Waterberg coals is between 1.5% and 2.5%, which taken into account will slightly increase the determined density values, making them comparable with both the density bottle values and the Gray determinations. The sample then needs to be restored to its original volume and the void to solid ratio determined in order to get a representative air-dry relative density.
Production reconciliation
From a mining production and reconciliation perspective two examples, one from the Volksrust Formation and the second from the Vryheid formation, were dealt with. These two scenarios are depicted in the locality map shown in Figure 28, showing the positions of the mining strips, blocks, and surrounding exploration boreholes from which the basic information with regard to mining block densities and expected run of mine tonnages were obtained.
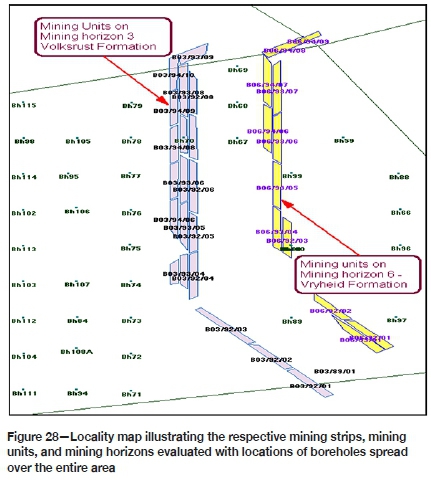
The same approach using the basic density equation was used in this evaluation. The masses relate to tonnages, the volumes in cubic metres to the material mined, and the initial densities allocated to the areas as well as the derived densities represented by the surveyed volumes and reported tonnages. Table VIII represents data from mining horizon bench 3 which is in the Volksrust Formation. Material from this bench is beneficiated for both a semi-soft coking coal and a power station product.
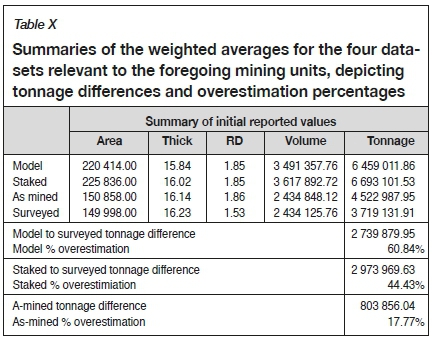
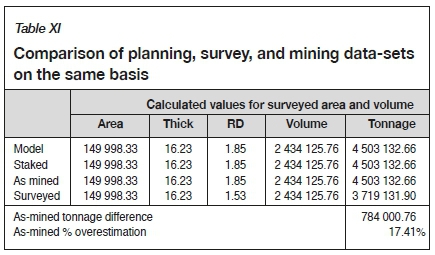
In Table X, overestimation percentages are attributable to completely different areas, bench thicknesses, densities, and volumes planned and staked as opposed to the raw material actually mined. The most important fact, however, lies between the as-mined data and the surveyed data. In Table XI the areas, volumes, bench thicknesses, and relative densities for the model, staked, and as-mined scenarios have been equalized in order to compare the four scenarios on the same basis. The only difference is in the tonnage for the surveyed material and its resultant density. This shows a difference of 17.41%, which could be attributable to the voids in the matrix, implying that the solid matrix contributing to the final density is only 82.59%.
The second evaluation represents data from bench 6 in the Vryheid Formation. This material is mined, crushed and screened, and dispatched directly as a power station product.
Summary
Basic field and preliminary laboratory density determinations are valueless unless the core is impeccably preserved and its moisture content determined. If this has not been done the air-dry density should be validated through the evaluation of alternative methods, including pycnometry, application of AAD, and the Gray method. When using the Gray method it is advisable to use the inherent moisture content determined through proximate analysis, the reason behind this being that Robeck and Hoe (2015) used averaged total moisture content in their evaluations. This may be from actual analyses on impeccably preserved core where moisture determinations were done.
Density determinations on the selected sample chosen for the theoretical evaluation after the -13 mm +0.5 mm and the -.5 mm air-dry mass divided by original geometric volume include:
➤ Australian Standard method, AS1038.21 Item 4
➤The Gray method (Robeck and Huo, 2015)
➤Ash-adjusted density (Roux, 2012).
These three methods all require the pulverization of the air-dried sample to -212 pm, leading to a significant loss in volume. Results obtained from the Gray method (using proximate analyses results for inherent moisture content) displayed a 0.01 g/cm3 density difference, slightly higher than the pycnometer and AAD results. Applying the same principle with regard to changing volumes, factors for the solid matrix were on average 0.83 (83% of the total sample) and voids 0.17 or 17%. These factors applied to the determined densities gave an air-dry density of 1.46 g/cm3 for the sample evaluated. This volumetric difference is a geological loss as a result of the matrix porosity of the material.
From a physical mining perspective, where more than a single sample was composited to represent a mining horizon bench, the reconciliation of tonnages hauled and the volumes of material extracted for the two scenarios evaluated also gave results within the same range as those obtained from laboratory and theoretical evaluations.
The first scenario, based on bench 3 production, shows a difference of 17.41% attributable to the voids in the matrix, which implies that the solid matrix contributing to the final density is only 82.59%. The second scenario, bench 6, resulted in a void percentage of 17.89% and a solid matrix percentage of 82.11%.
It is thus considered that a change of volume equation, given reliable input, will enable the determination of a more credible air-dry density of coal which can then be adjusted to accommodate adventitious moisture representative of in-situ conditions if accurate moisture determinations are done on impeccably preserved samples. Alternatively, the laboratory air-dry density should be used for Resource and Reserve calculations. This air-dry value should include both the mass of the screened -13 +0.5 mm as well as the mass of the -0.5 mm material.
Conclusions and recommendations
Field samples
1. If samples are not sealed and impeccably preserved in order to retain the free moisture neither Archimedes nor field mass/ volume density determinations are suitable for Resource and Reserve determinations based on so-called in-situ conditions. Moisture loss or gain as a result of exposure to atmospheric conditions or absorption during hydrostatic testing for SG determination will lead to erroneous results not representative of the sample in its in-situ state. If the sample is sealed on recovery, the densities determined by these methods should be almost identical. Corrections to convert to an air-dry density can then be done when the free moisture content has been determined.
2. The mass of the initial laboratory-crushed air-dried state, including both the -13 +0.5 mm fraction and the -0.5 mm fraction, can be used over the original geometric volume to give an indication of the probable air-dry density of the sample, provided that the crushed material has been properly air-dried under controlled temperature and humidity, ensuring a credible value for the air-dried material.
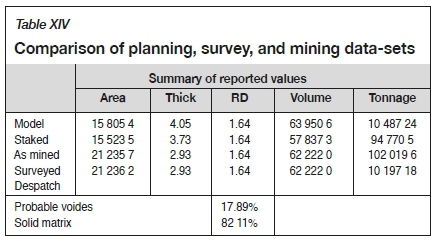
Laboratory-prepared samples
1 The density of float/sink fractions, air-dried, and pulverized to -212 μηι determined by applying the Australian Standard method AS1038.21 Item 4 can be composited to give a representative air-dry density of the sample from the particles in the solid matrix.
2 The AAD methodology can be applied to the proximate ash content data to determine an absolute dry density of the sample, which should then be adjusted to take the inherent moisture content into consideration to provide an equivalent air-dry density.
3 The Gray method, proposed by Robeck and Huo, can also be used to determine an equivalent air-dry density for the sample. Robeck and Huo, however, oppose the use of the ash component since it is a product of combustion and excludes possible mineral volatiles. These mineral volatiles include H2O of hydration, CO2, SO2, salts (e.g., Cl), carbonates, and sulphides (Ward, 1984). As a result, the remaining ash (solid residue) underrepresents the original mineral matter. For this reason, sample ash almost never reaches 100%, even in samples lacking carbonaceous material.
4 The greatest loss of mineral volatiles relates to water loss as a result of vaporization coupled with minor amounts of the aforementioned volatiles.
5 The density values obtained from these laboratory procedures all need to be related to the original geometric or envelope (bulk) volume, because the total volume of the sample has been dramatically reduced as a result of pulverization. The mass of sample if properly air-dried, however, should remain the same.
6 Ash-adjusted density with a correction applied to account for inherent moisture and then reconstructed to be accommodated within the original volume gives a reliable air-dry density and requires the least analytical data to acquire the desired result. These values have all been found to be within the 95-99% confidence range.
It is recommended that Resource and Reserve tonnages be reported on an air-dry basis. Water and voids do not generate revenue. The air-dry density gives credible results with respect to the actual resource material. If the moisture content in the matrix of the resource material is higher, the budgeted tonnages calculated on the air-dry basis would be more conservative, negating the possibility of overestimation of the actual Resource.
Resource and Reserve values can be adjusted to reflect an averaged free moisture content, enhancing planning and scheduling with regard to probable tonnages in situ in the specific environment being evaluated. This may be accomplished through the evaluation of downhole geophysical logs, specifically the density log. After correlation to identify the zones and samples, comparisons of log densities with AAD densities for the same samples can be made. The differences noted would be indicative of the probable moisture or void content in the samples.
One of the biggest influences with regard to fluctuating tonnages and varying in-situ densities can be attributed to the movement of groundwater in relation to the material being evaluated. Depleting groundwater levels will result in lower tonnages as the groundwater drains from the porous material, while increased groundwater levels could saturate the material through absorption thereby greatly increasing the in-situ tons of raw material.
The use of air-dry densities in order to derive Resource and Reserve tonnages allows a very conservative approach. It is also the basis on which product data extraction is calculatedone, therefore any excesses measured in a mining operation can be adjusted to accommodate possible increases in free moisture content of the material being mined. This can be accommodated in the mining loss/gain factors applied to mineable tonnages.
References
American Society for Testing and Materials. 1994, Compilation of ASTM Standard Definitions. 8th edn. West Conshohocken, PA. [ Links ]
Anderson, G. 1975. Coring and Core Analysis Handbook. Petroleum Publishing Company, Tulsa, AZ. [ Links ]
British Standard BS 2955. 1991. Glossary of Terms Relating to Particle Technology. British Standards Institution, London. [ Links ]
Close, J. 1993. Natural fractures in coal. Hydrocarbonsfrom Coal, Law, B.E. and Rice, D.D. (eds). AAPG Studies in Geology, vol. 38. pp. 119-132. [ Links ]
Crain, R. 2003. The new role of petrophysics in geophysical interpretation. CSEG Recorder, vol. 28, no. 7. https://csegrecorder.com/articles/view/the-new-role-of-petrophysics-in-geophysical-interpretation [ Links ]
Crain, R. 2010. Petrophysical Handbook. Rocky Mountain House, AB, Canada. [ Links ]
Dreyer, J.C. 1991. Waterberg Coalfield: Geology, resources, mining and products. (Abstr.). Proceedings of the Conference on South Africa's Coal Resources, Witbank, 6-9 November. Geological Society of South Africa, Johannesburg. [ Links ]
Dreyer, J.C. 1994. Total utilization of the coal resource: The Grootegeluk experience. Journal of the South African Institute of Mining and Metallurgy, vol. 94. pp. 153-164. [ Links ]
Falcon, L.M. 1987. The complexities of coal. Review; Gold Fields of South Africa. pp. 64-67. [ Links ]
Falcon, R.M.S. 1986. Classification of coals in Southern Africa. Mineral Deposits of Southern Africa, vol. 2. Anhaeusser, C.R..and Maske, S. (eds.). Geological Society of South Africa, Johannesburg. pp. 1899-1921. [ Links ]
Gan, N., Nandi, S.P., and Walker, P.L. 1972. Nature of the porosity in American coals. Fuel, vol. 51. pp 272-277. [ Links ]
Gearhart Owen Industries. 1975. Formation evaluation data handbook. Fort Worth. TX. [ Links ]
Gray, V.R. 1983. A formula for the mineral matter to ash ratio for low rank coals. Fuel, vol. 62. pp. 94-97. [ Links ]
Huang, N., Wang, K., Bodily, D.M., and Hucka, V.J. 1995. Density measurements of Argonne Premium coal samples. Energy & Fuels, vol. 9. pp. 20-24. [ Links ]
King, J.G. and Wilkins, E.T. 1944. The internal structure of coal. Proceedings of the Conference on Ultra-fine Structure of Coals and Cokes, London, 1943. British Coal Utilization Research Association, London. pp. 46-56. [ Links ]
Laubach, S.E., Marrett, R.A., Olson, J.E., and Scott, A.R. 1998. Characteristics and origins of coal cleat: A review. International Journal of Coal Geology, vol. 35. pp.175-207 [ Links ]
Levine, J.R. 1993. Exploring coalbed methane reservoir. Short Course, Institut Francais di Petrole, Rueil-Malmaison. 265 pp. [ Links ]
McEnaney, Β. and Mays, T.J. 1989. Porosity in carbons and graphites. Introduction to Carbon Science. Marsh, H. (ed.), Butterworths, London. pp. 153-196. [ Links ]
McGraw-Hill. 1984. Dictionary of Scientific and Technical Terms. 3rd edn. New York. [ Links ]
Meyers, A., Clarkson, C., Wex, Τ., and Leach, Β. 2004. Estimation of in-situ density of coal and relative density analyses: Final Reportfor ACARP Project C10042. Australian Coal Association Research Programme, Brisbane. [ Links ]
Morley, C. 2003. Beyond reconciliation - A proactive approach to using mining data. Proceedings of the Fifth Large Open Pit Conference, Kalgoorlie, 3-5 November 2003. Australasian Institute of Mining and Metallurgy, Melbourne. pp 185-191. [ Links ]
Nebel,M.L. 1916. Specific gravity studies of Illinois coal. University of Illinois Bulletin, vol. XIII, no. 44. Engineering Experiment Station, July 1916. Urbana, IL. [ Links ]
Noppé, Μ. 2004. Reconciliation: importance of good sampling and data QAQC. Proceedings of the Mining and Resource Geology Symposium. XYZ, EGRU Contribution no. 62. [ Links ]
Preston, κ. 2005, Estimating the in situ relative density of coal - Old favourites and new developments. Proceedings of the Bowen Basin Symposium 2005. The Future for Coal - Fuelfor Thought, Beeston, J.W. (ed.). Geological Society of Australia, Coal Geology Group and the Bowen Basin Geologists Group, Yeppoon, Queensland. pp. 13-22. [ Links ]
Preston, K. and Sanders, R. 2005. Calculating reserves - A matter of some gravity. A study by Quality Coal Consulting Pty Ltd for Pacific Coal Pty Ltd. [ Links ]
Preston, ΚΒ. and Sanders, R.H. 1993, Estimating the in-situ relative density of coal. Australian Coal Geology, vol. 9, May. pp. 22-26. [ Links ]
Rees, O.W. 1966, Chemistry, uses and limitations of coal analyses. Report of Investigations220. Illinois State Geological Survey. 55 pp. [ Links ]
Robeck , E. and Huo, D. 2015. Pure coal and mineral matter properties: A practical foundation for in situ density estimation. Peabody Energy, St. Louis, MO. [ Links ]
Rodrigues, C.F. and Lemos de Sousa, M.J. 2002. The measurement of coal porosity with different gases. International Journal of Coal Geology, vol. 48. pp. 245-251. [ Links ]
Roux. L. 2012. Optimal yield and cut density prediction of semi soft coking coal and powerstation coal in the Waterberg Coalfield, Limpopo Province. MSc dissertation, University of the Witwatersrand, Johannesburg. [ Links ]
Roux. L. 2017. The application of ash adjused density in the evaluation of coal deposits. PhD thesis, University of the Witwatersrand, Johannesburg. [ Links ]
Smith G.G. 1991. Theoretical estimation of in-situ bulk density of coal. CIM Bulletin, vol. 84, no. 949. pp. 49-52. [ Links ]
Unsworth, J.F., Fowler, CS., and Jones, L.F. 1989. Moisture in coal: 2. Maceral effects on pore structure. Fuel, vol. 69. pp 18-26. [ Links ]
Van Krevelen, D.w. 1993. Coal: Typology-Physics-Chemistry-Constitution. 3rd edn. Elsevier, Amsterdam. 979 pp. [ Links ]
Wang, Χ. 2007. Influence of coal quality factors on seam permeability associated with coal bed methane production. PhD thesis, Faculty of Science, University of New South Wales. [ Links ]
Ward. CR. (ed.). 1984. Coal Geology and Coal Technology. Blackwell Scientific, Melbourne. 345 pp. [ Links ]
Ward C.R. 2002. Analysis and significance of mineral matter in coal seams. International Journal of Coal Geology, vol. 46. pp. 67-82. [ Links ]
Webb, P.A. 2001. Volume and density determinations for particle technologists. Micromeritics Instrument Corp., Norcross, GA. [ Links ] ♦
 Correspondence:
L. Roux
Email: rouleo@outlook.com
Received: 8 Mar. 2019
Revised: 6 Aug. 2020
Accepted: 24 Feb. 2021
Published: May 2021


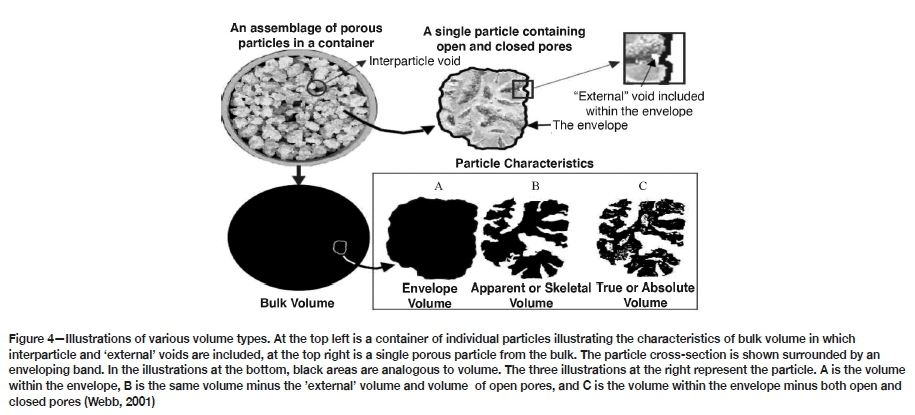
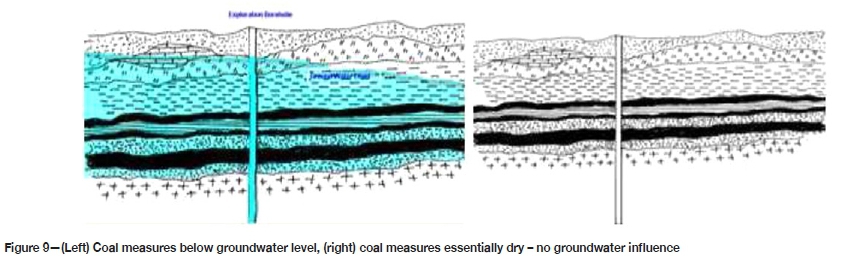
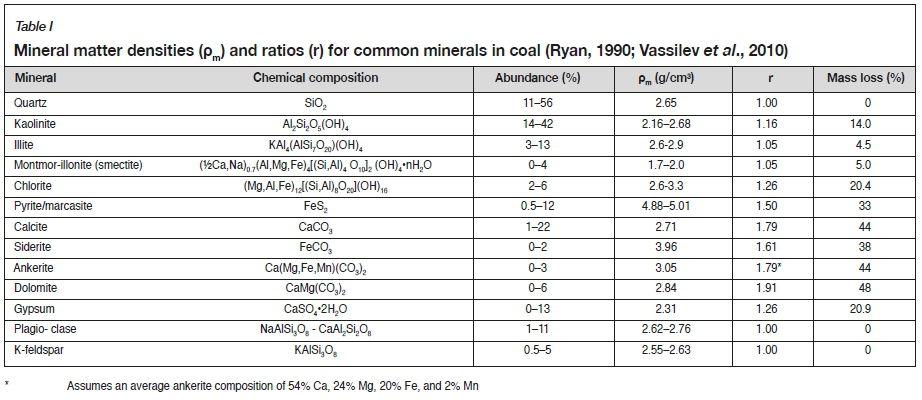
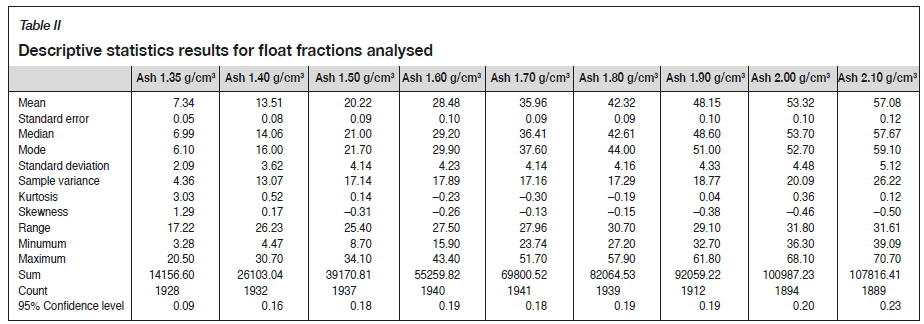
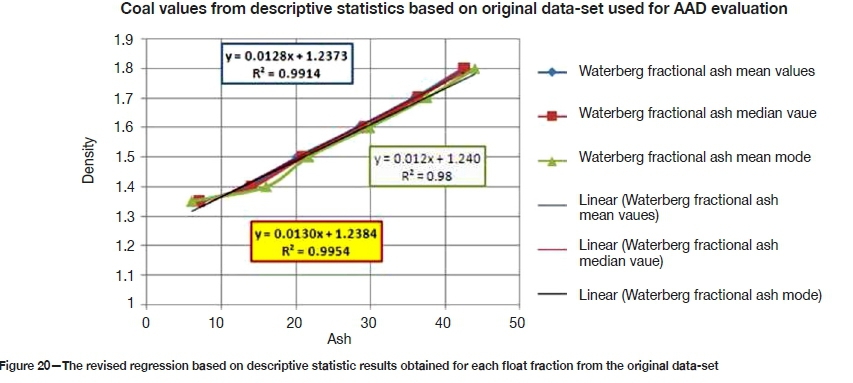
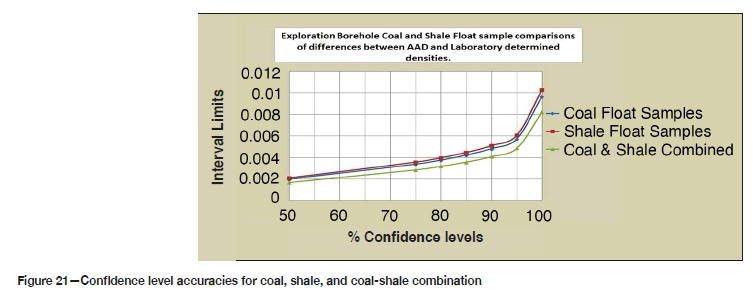
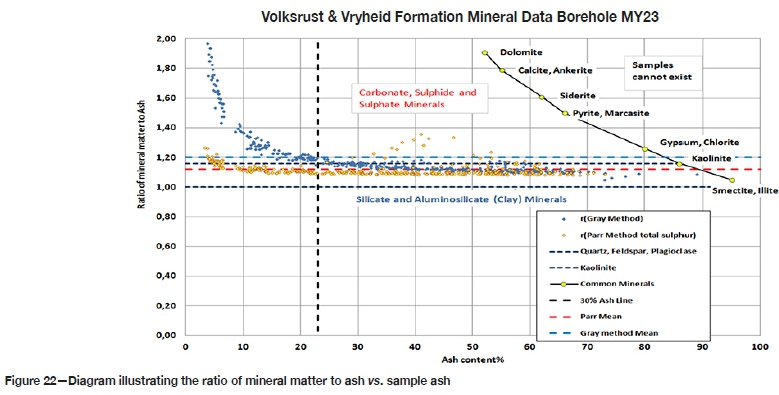
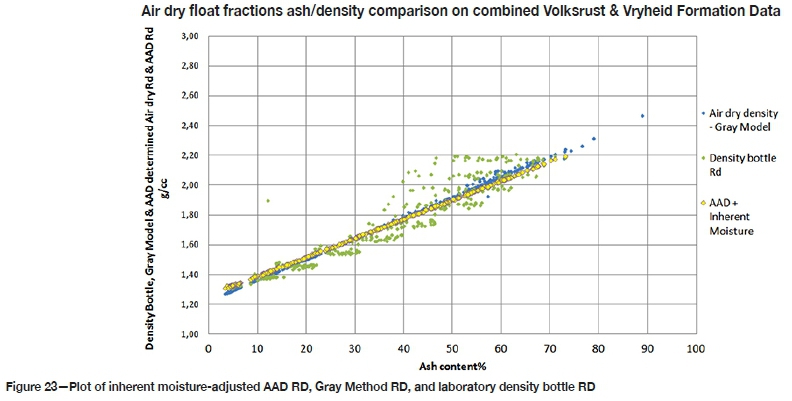
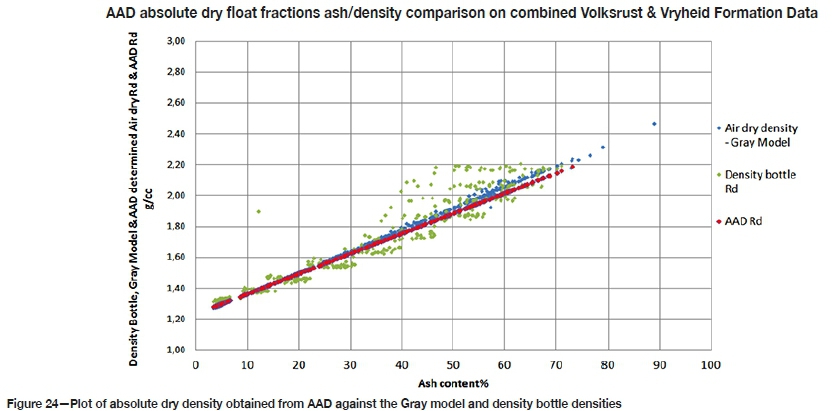
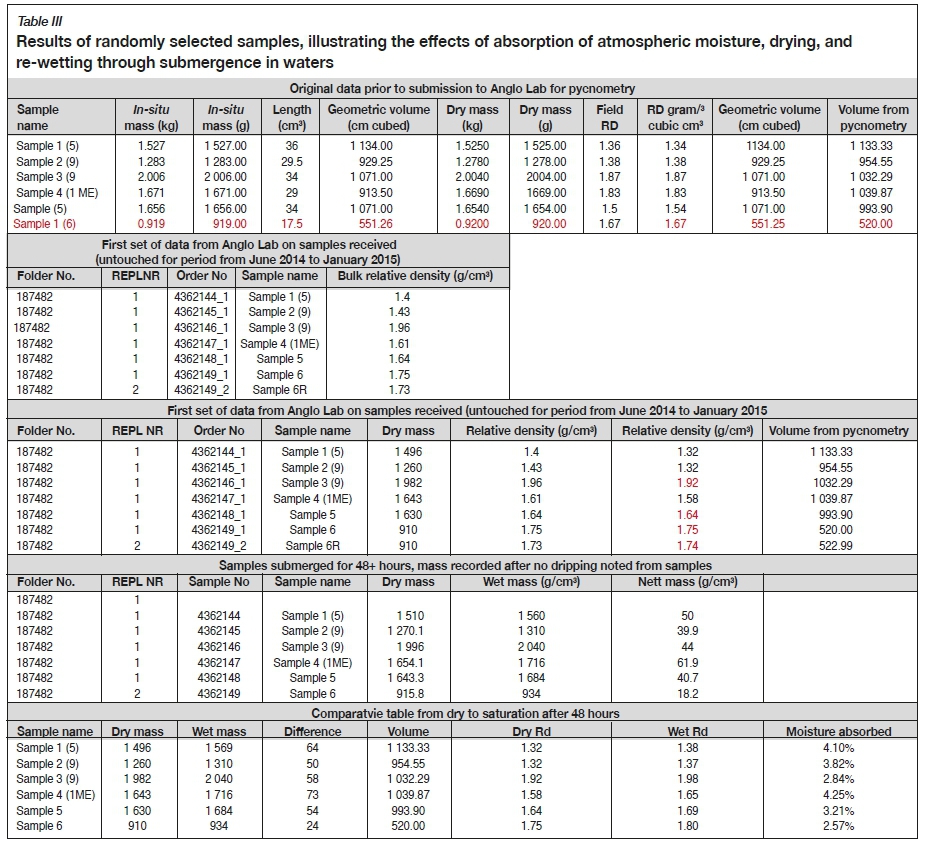
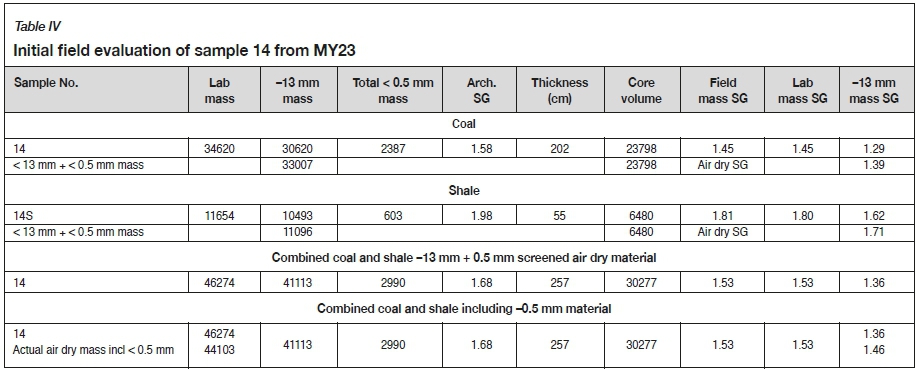
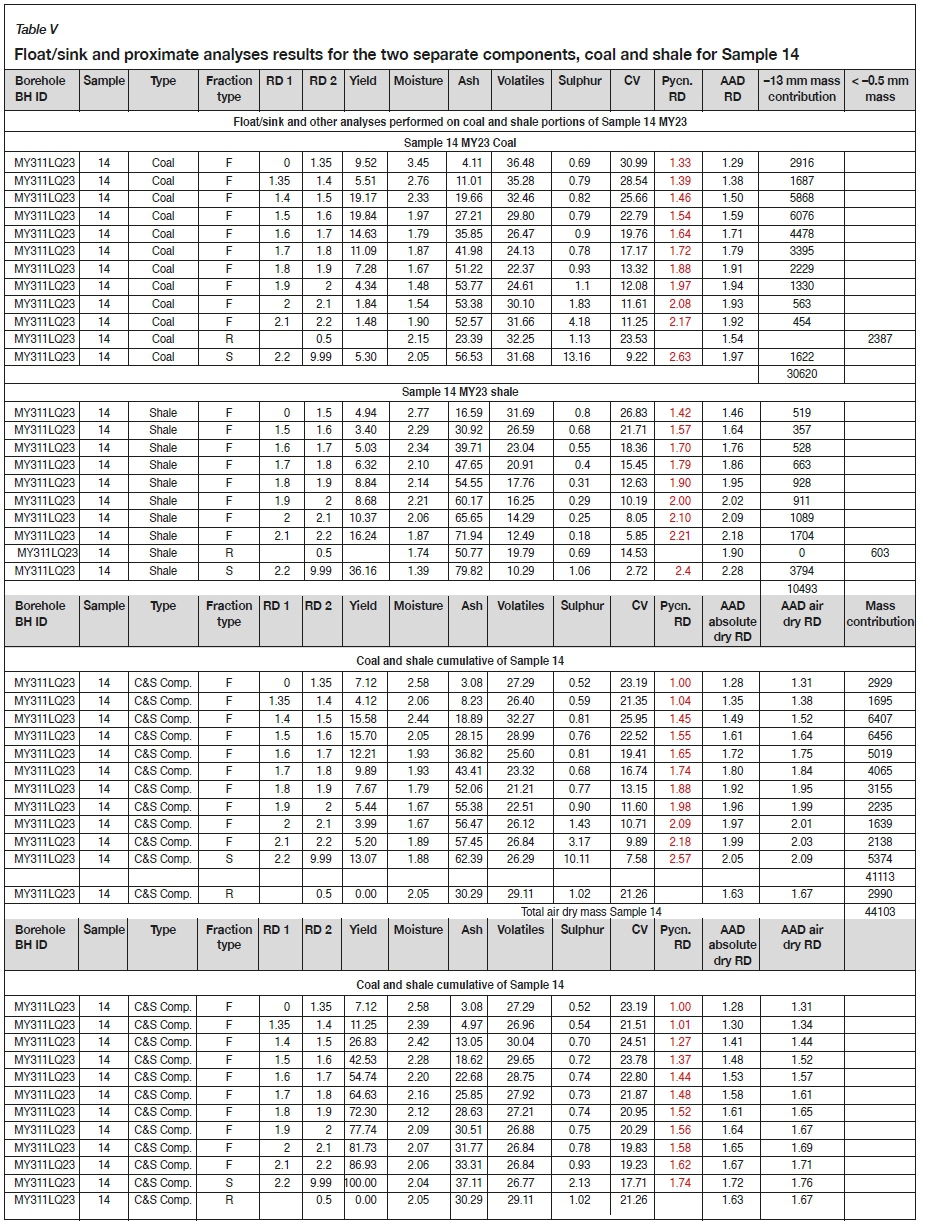
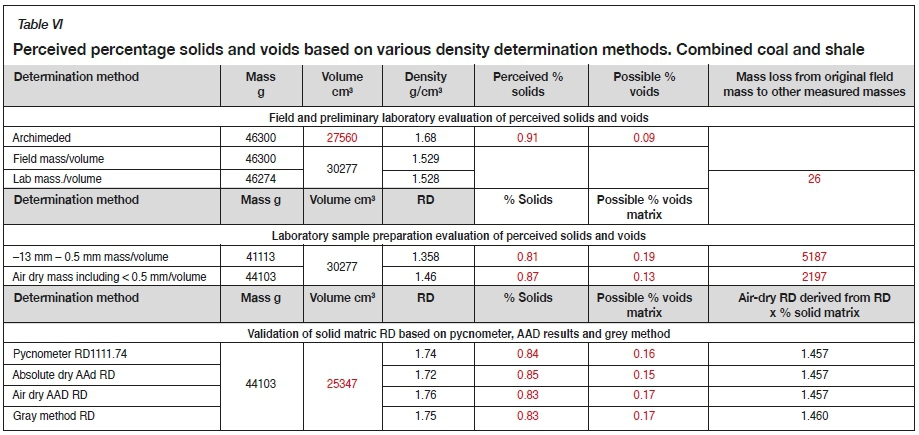
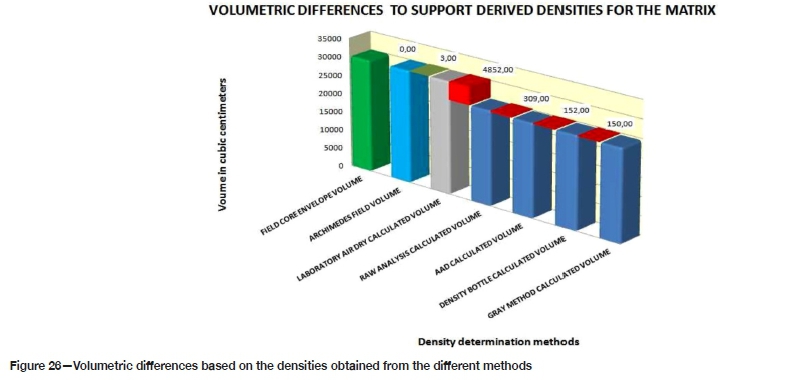
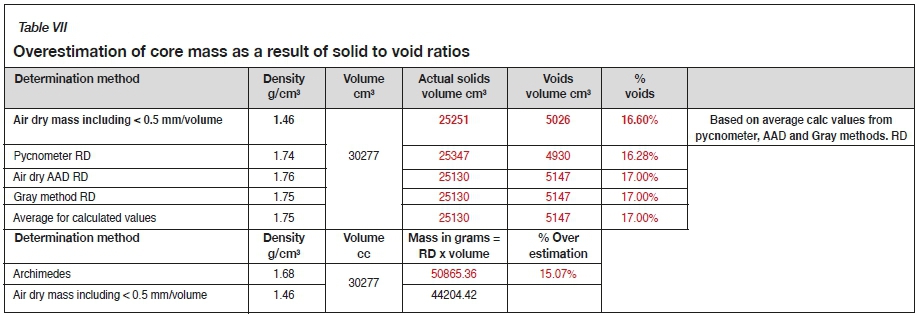
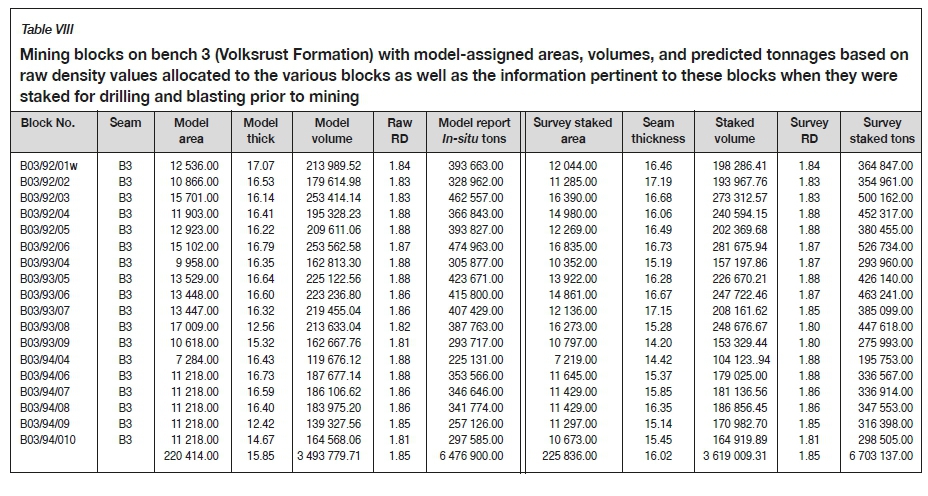
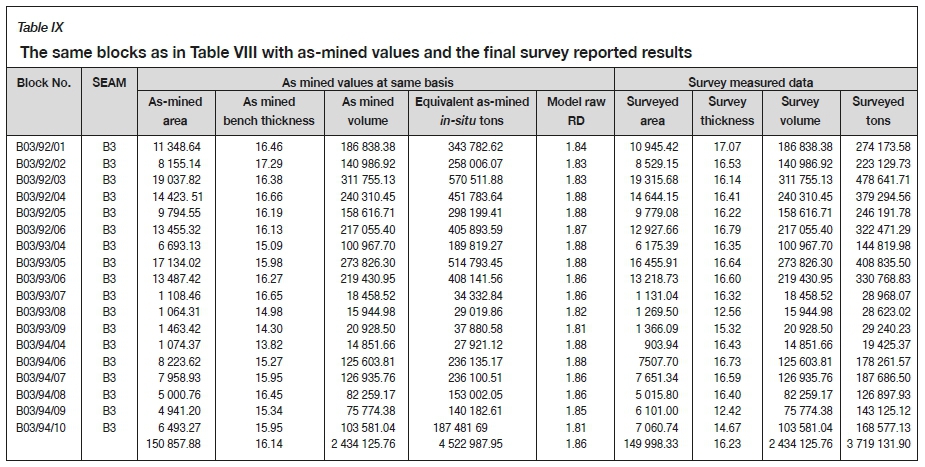
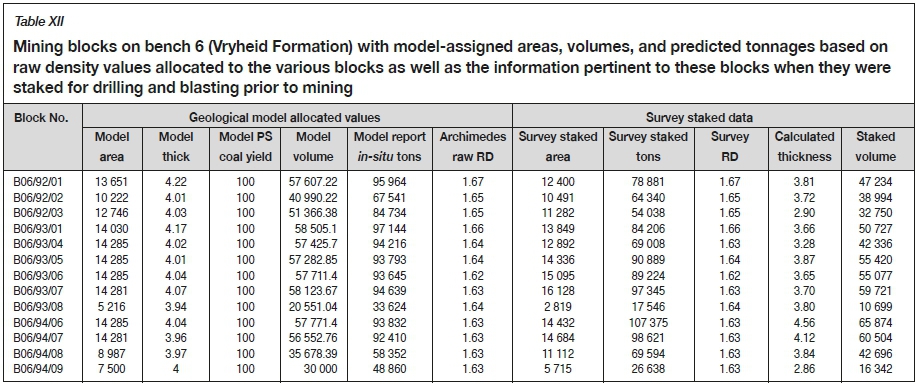
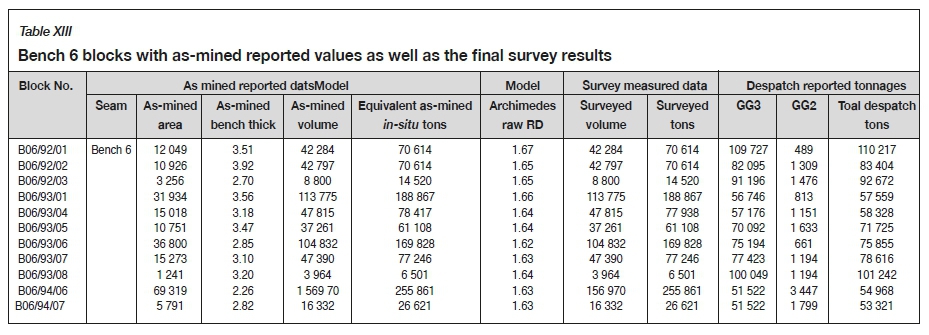