


Serviços Personalizados
Artigo
 Inglês (pdf)
 Artigo em XML
 Referências do artigo
Indicadores

Links relacionados
-
 Citado por Google
 -
 Similares em Google
Compartilhar

 Permalink
Journal of the Southern African Institute of Mining and Metallurgy
versão On-line ISSN 2411-9717
versão impressa ISSN 2225-6253
J. S. Afr. Inst. Min. Metall. vol.121 no.4 Johannesburg Abr. 2021
http://dx.doi.org/10.17159/2411-9717/1331/2021
ARTICLES
Characterization of additively manufactured AlSilOMg cubes with different porosities
C. TauteI; H. MöllerI; A. du PlessisII, III; M. TshibalangandaII; M. LearyIV
IDepartment of Materials Science and Metallurgical Engineering, University of Pretoria, Pretoria 0002, South Africa
IIResearch group 3DInnovation, Stellenbosch University, Stellenbosch 7602, South Africa
IIIDepartment of Mechanical Engineering, Nelson Mandela University, Port Elizabeth 6001, South Africa
IVRMIT Centre for Additive Manufacturing, RMIT University, Melbourne 3000, Australia
SYNOPSIS
Additive manufacturing can be used to produce complex and custom geometries, consolidating different parts into one, which in turn reduces the required number of assemblies and allows distributed manufacturing with short lead times. Defects, such as porosity and surface roughness, associated with parts manufactured by laser powder bed fusion, can severely limit industrial application. The effect these defects have on corrosion and hence long-term structural integrity must also be taken into consideration. The aim of this paper is to report on the characterization of porosity in samples produced by laser powder bed fusion, with the differences in porosity induced by changes in the process parameters. The alloy used in this investigation is AlSi10Mg, which is widely used in the aerospace and automotive industries. The sample characteristics, obtained by X-ray tomography, are reported. The design and production of additively manufactured parts can be improved when these defects are better understood.
Keywords: additive manufacturing, L-PBF, AlSi10Mg, porosity, surface roughness, density.
Introduction
Additive manufacturing (AM) is fast becoming an important production method in the fourth industrial revolution, due to the possibilities it presents in terms of complex as well as custom geometries (DebRoy et al., 2018; Dilberoglu et al., 2017; Korpela et al., 2020; Tofail et al., 2018). This allows shorter lead times through reduction of parts required for assembly by merging parts (DebRoy et al., 2018; Korpela et al., 2020; Tofail et al., 2018).
AlSi10Mg is popular in conventional casting methods, and substantial research effort has been applied to manufacture it successfully by AM. The addition of magnesium (Mg) gives an advantage by improving heat-treated strength due to the formation of Mg2Si precipitates (Sercombe and Li, 2016).
There are three main pore types associated with AM, namely spherical pores, lack-of-fusion defects, and keyhole pores. Spherical pores are usually a result of gas that becomes trapped in the melt pool during the rapid solidification which is characteristic of laser powder bed fusion (L-PBF). They are generally very small in size. Lack-of-fusion pores are created when there is insufficient overlap in layers during the melting process. Insufficient overlap can mean that an area of poor bonding is created or, for extreme cases, unmelted powder is trapped in the remaining cavities. As overlaps are difficult to fully re-melt, lack-of-fusion pores are formed (Zhang, Li, and Bai, 2017). Keyhole pores occur in a vapour-filled depression well which collapses and forms large, rounded pores.
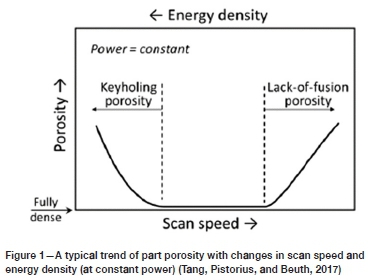
Porosity in AM, and especially L-PBF, is influenced by laser power, scanning speed, hatch spacing, layer thickness, and energy density (Tang, Pistorius, and Beuth, 2017). When scanning speed, layer thickness, and hatch spacing are kept constant, higher laser power (and higher temperature) is expected to create deeper melt pools, which cause keyhole pore formation (Bayat et al., 2019; Khairallah et al., 2016; Mohr et al., 2020; Shrestha et al., 2019; Stugelmayer, 2018; Zhao et al., 2020). Lower laser powers are expected to lead to lack-of-fusion pore formation (Bayat et al., 2019; Majumdar et al., 2019; Mohr et al., 2020; Stugelmayer, 2018). Similar to lower laser power, faster scan speed at fixed other parameters also leads to lack of fusion and similarly, slower scan speed leads to more keyhole pore formation. This is shown schematically in Figure 1. It has also been shown that parts never truly reach full density, i.e. 0% porosity, even at optimal process parameters.
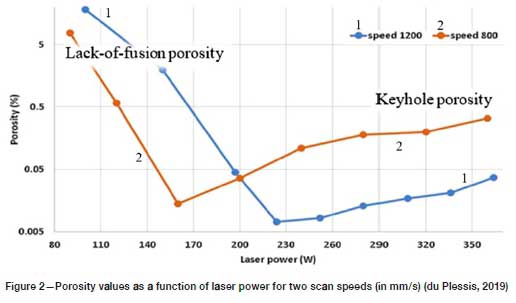
An optimal combination of processing parameters can minimize porosity to below 0.01%. The transition of lack-of-fusion pores is seen to be much sharper than for keyhole pores, where the transition is more gradual, as laser power is increased (du Plessis, 2019). This is illustrated in Figure 2. The optimal power for minimal porosity is seen to be lower for the lower scan speed. The alloy used in this experiment was L-PBF Ti6Al4V.
Characterizing porosity is especially important, as various studies have shown it to have a detrimental effect on the mechanical properties of AM parts. This specifically includes fatigue strength, where research revealed that pores act as crack initiators and that near-surface pores are the most critical (Zerbst et al., 2019a, 2019b, 2019c). Another study of AlSi10Mg formed by AM found that areas with significant unmelted powder will undergo local cracking (Read et al., 2015). Investigations into defect formation and anisotropic properties indicated that the anisotropy of both tensile ductility and fatigue properties is intensified by defects, specifically irregularly shaped porosity such as lack-of-fusion defects (Zhang, Li, and Bai, 2017; Tang and Pistorius, 2017; du Plessis, Yadroitsava, and Yadroitsev, 2020).
Non-destructive testing (NDT) is advantageous for understanding sample integrity or density without destroying the sample. Common NDT methods are the Archimedes method, gas pycnometry, ultrasonic testing, and X-ray computed tomography (CT) scanning. The Archimedes method is relatively simple, cheap, and fast. It calculates density based on the part's mass measured in air and in liquid (such as water or acetone). The density of the part is calculated according to Equation [1]:
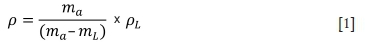
where ρ is the part density, pLis the temperature-dependent density of the liquid, mais the part mass in air, and mLis the part mass in the liquid. Acetone is recommended only in its pure form, as it is hygroscopic, otherwise de-ionized or distilled water is preferred to minimize air bubbles (Spierings, Schneider, and Eggenberger, 2011). The disadvantage of this method is that it can only determine bulk density relative to the fluid used for measurement, as well as assuming 100% material density. Porosity present in the part is then determined by comparing the Archimedes density to the reference density for the material. This also means localized pores cannot be individually evaluated (Wits et al., 2016).
Gas pycnometry is a process that measures part volume by displacement of an inert gas such as helium (He). Part density is calculated by measuring the mass and volume of the parts separately. As with the Archimedes method, pycnometry is relatively easy, but the disadvantages of this method are higher equipment costs and volume detection is limited only to parts that are relatively small. This method measures skeletal density, which means that the gas penetrates all open (surface connected) pores and hence excludes them from the measurement. This means that porosity is then again determined by comparing the calculated density to the reference density (Wits et al., 2016).
X-ray CT scanning can be used for both dimensional and porosity analysis, among other applications (du Plessis and le Roux, 2018; du Plessis et al., 2018a). X-rays are used to form a 'shadow' image of the sample, as the rays are projected around and through the sample. The sample is rotated in front of a stationary X-ray source and the scan records these images from the various angles presented. This is followed by a software algorithm that calculates X-ray density at each point using back-projection, creating the 3D volume data (du Plessis, Yadroitsava and Yadroitsev, 2020). The final result is a high-quality 3D image with a clear view of where pores are located, as well as the size range of the pores (du Plessis et al., 2018a).
A comparison of NDT methods by Wits et al. (2016) indicated that CT scanning can measure pore areas that are smaller than the detectable size for microscopic methods, as well as predict densities more accurately than the Archimedes method. It also allows further analysis of the porosity present in the parts, such as sphericity, pore distribution, and defect volume both on the surface and inside the sample (du Plessis, Yadroitsava and Yadroitsev, 2020; Wits et al., 2016).
Materials and methods
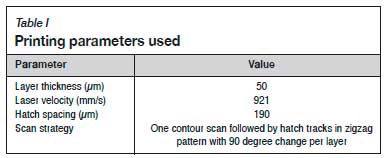
This study used AlSi10Mg samples that were printed at RMIT University in Melbourne, Australia. A total of 25 solid cubes were printed using an SLM500 Quad laser system from SLM Solutions, with dimensions 10 χ 10 χ 10 mm3, and material composition as described in Maconachie et al. (2020). Differences in porosity content were induced by varying the printing process parameters, specifically the laser power. Five different power settings were used, namely 210, 280, 350, 420, and 490 W, with five samples printed for each power setting. The other parameters used in the printing are listed in Table I.
Different characterization methods were used as described below. X-ray CT scanning was used in two ways: once to measure the volume of the cube for a density analysis method based on volume and scale mass, and once to do a conventional CT-based porosity analysis. The system used was a GE Nanotom S and the software used for image analysis was Volume Graphics VGSTUDIO MAX 3.3.
Initial testing
Initial testing done at the University of Pretoria included measuring dimensional accuracy and mass, using a New Classic ML Mettler Toledo scale, which has a draft shield to improve accuracy. The mass in air was taken as an average of three to four individual measurements. These values were used in the subsequent density calculations.
Density measurements
Three methods were used to determine the bulk density of the samples (average density), namely Archimedes, gas pycnometry, and a CT-based density method described previously in du Plessis et al. (2018b).
Archimedes density measurements were done using a New Classic ML Mettler Toledo scale, accurate to four decimals, and distilled water. Four individual measurements of the samples in water were taken. The water temperature was measured to ensure accurate water density was used. Density was then calculated according to Equation [1].
Gas pycnometry was carried out using a Micromeritics AccuPyc II 1340 gas pycnometer with helium gas at a calibrated pressure of approximately 19.5 psig (134.45 kPa). Five volume measurements were obtained per sample, and the average used to calculate density.
The CT-based density calculations were based on the mass scale of the samples in air and the CT-determined volume of the cube, segmented carefully to include all pore spaces.
NanoCT scan porosity measurement
The analysis method used a procedure identical to that outlined in du Plessis et al. (2018c), which minimized bias in the segmentation process. Porosity percentage values are used here, despite much more information being available. This additional data will be used in future work for further detailed analysis of pore morphologies.
Surface roughness
Surface roughnesses of the samples were obtained using optical microscopy with an Olympus DSX 510 at Wirsam Scientific. The microscope uses Olympus Stream software to plot a surface map of the sample and return surface roughness values, such as arithmetical mean height (Sa) along with a colour-scale map of the surface. Surface roughness was measured in a minimum of three separate areas (1960 μηι χ 1960 μηι each) on both the top surface and the side surfaces, to obtain an overall representative average. The distance between each layer scanned by the microscope was 12.1 μηι, whereas the height range scanned differed between samples due to different surface conditions.
Results and discussion
Three density methods were used to calculate the difference in density of the samples from the different laser power sets. This is shown in Table II. An increase in laser power is shown to lower the measured bulk density of the samples, and all three methods are consistent in this trend.
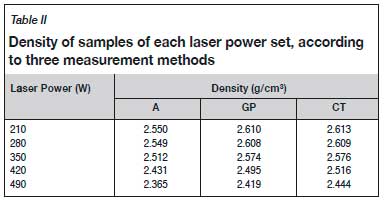
In the table A refers to Archimedes density, GP is gas pycnometry density, and CT is the CT scan density. AlSi10Mg has a theoretical density of approximately 2.68 g/cm3.
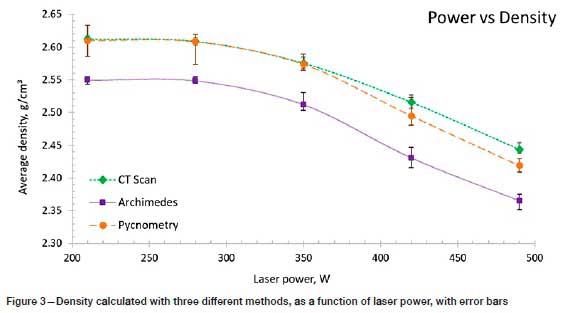
From Figure 3 it can be seen that the pycnometer and CT-based densities correlate well, whereas the Archimedes density is lower. This lower value might be attributed to air bubbles attached to the surface of the sample when submerged in water, which affects the measured mass of the sample in water. The rough surface is conducive to air bubbles attaching and this was physically observed.
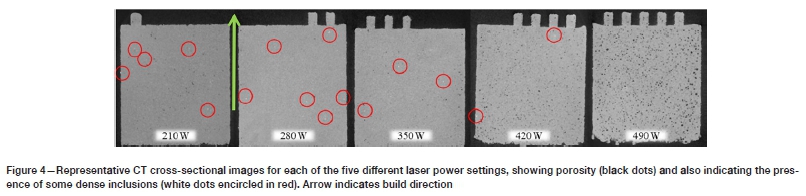
CT scan images of one representative sample from each laser power set are shown in Figure 4. From left to right the power settings were 210, 280, 350, 420, and 490 W. It can be seen that the first two cross-sections on the left have very small amounts of porosity, which corresponds to the lower power settings. The last two cross-sections on the right are seen to contain a greater number of pores, which are larger and are rounded, which corresponds to the higher laser power and subsequently higher energy density. This large, rounded porosity at high power is attributed to keyhole mode porosity formation.
The encircled areas in Figure 4 show the presence of high-density inclusions, which could potentially be due to contamination from the powder itself, as Al alloys usually contain iron (Fe) impurities. The system used by RMIT University does not print other metal alloys, so the contamination is not from a previous build. Higher density particles from the powder itself could include iron (approx. 7.9 g/cm3), chrome (approx. 7.2 g/cnr3), manganese (approx. 7.3 g/cnv3), nickel (approx. 8.9 g/cnr3), titanium (approx. 4.5 g/cnr3), or copper (approx. 8.9 g/cm3). It is also quite possible that some of the inclusions are Al2O3 (3.99 g/citf) if oxidation occurred during spattering, even in the inert gas atmosphere used for printing. The density of the inclusions is higher than that of the alloy, thus they appear brighter in the scans. It is clear that as laser power increases, the number of high-density inclusions decreases. This can be attributed to higher temperatures or larger or deeper melt pools creating more melting/remelting and homogenization of the material. The samples have pins on the upper surface to help identify them and to keep samples from the different laser power sets separated. The number of pins indicates which laser power was used, with one pin referring to 210 W, up to five pins referring to 490 W. The green vertical arrow indicates an upwards building direction.
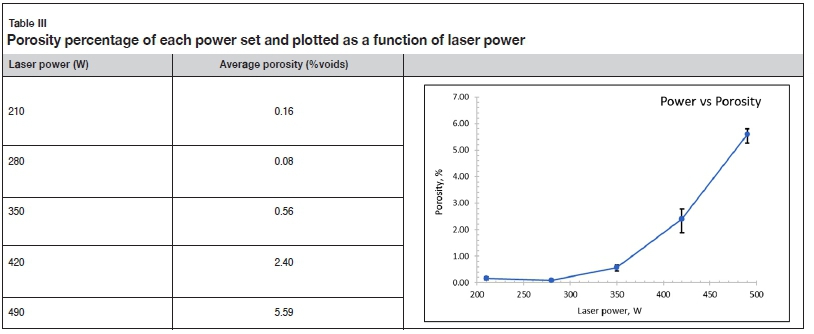
Table III shows the total percentage of porosity, obtained from the CT results, corresponding to each laser power set, as well as the relationship between power and porosity in a graph insert. As seen in Figure 4 and in Table III, the lowest power (E1) sample has slightly greater porosity than E2. This can be explained as due to lack of fusion porosity at 210 W and the ideal melting with lowest porosity content at 280 W compared to 210 W. The difference is statistically significant, as the 210 W laser power resulted in an average of 0.16% porosity with a variance of 0.0024 and standard deviation of 0.0495, whereas the 280 W laser power resulted in an average of 0.08% porosity with a variance of 0.0001 and standard deviation of 0.0103. As laser power increases further, the total porosity increases, due to more keyhole porosity, which is consistent with previous work (du Plessis, 2019). The error bars are calculated using the difference between the average porosity and the maximum and minimum porosity values for each laser power set.
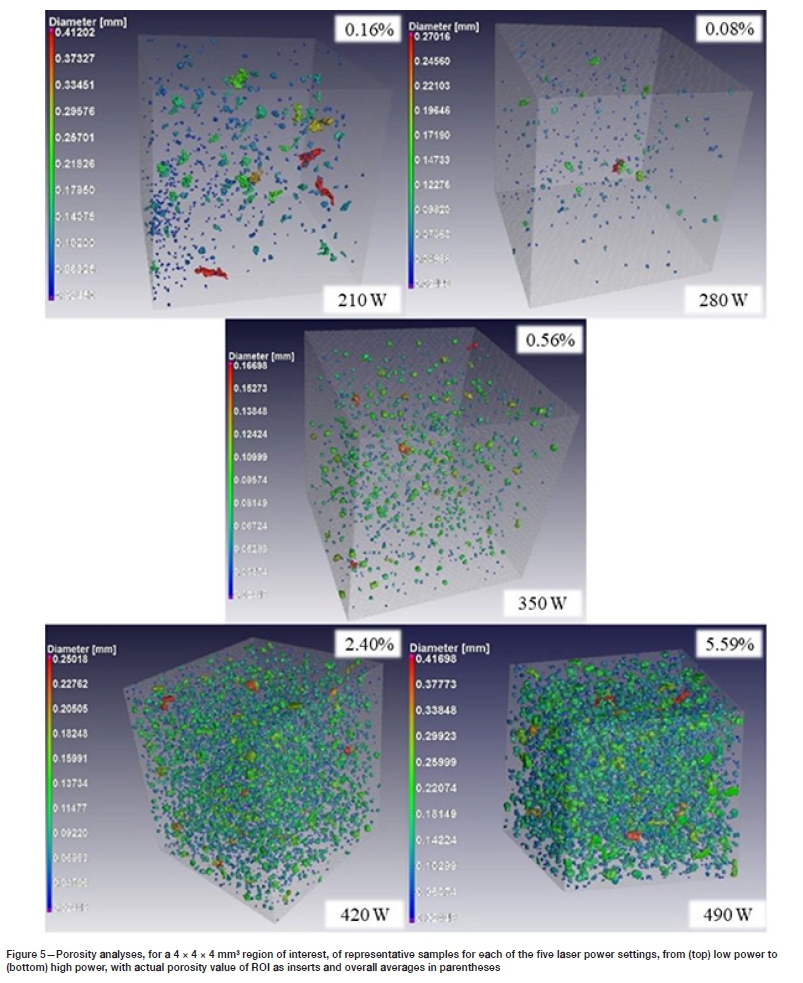
The CT porosity analyses are shown in 3D representations in Figure 5. The porosity percentages of those specific region-of-interest (ROI) cubes are added as inserts, with the overall average of the porosity from all 10 χ 10 χ 10 mm3 cubes in each laser power set in parentheses.
Here it is clearly seen that the lower laser power samples have relatively little porosity, especially compared to the samples manufactured at the higher laser powers. The higher laser power samples are seen to have much higher porosity and the pores are more spherical in shape, whereas the lower power samples have less spherical, lack-of-fusion type porosity.
The presence of lack-of-fusion porosity at high values in E1, compared to E2, is not consistent with the measured density values in Figure 3 and Table II and therefore requires explanation. Despite the small average values of 0.16 and 0.08%, all density methods showed the E1 sample to be slightly denser. The most likely explanation for this observation is that the bulk density measurements inaccurately measure the bulk when irregularly shaped pores are present on the surface. Such pores create open cavities, allowing water or gas to enter the object in surface-connected pores, and are thus excluded from the measurements. The CT-based segmentation also might select more of this type of porosity or may be inaccurate - the CT volume measurement for bulk density requires accurate calibration of the voxel size, unlike the porosity percentage value in Table III and Figure 5. The shapes of the pores are clearly more irregular at the lowest laser power and more spherical at higher power. The long, irregular pores are seen clearly in E1 versus the more spherical pores at higher laser powers. A scale representation is inserted to show the lengths of each side for all five cubes.
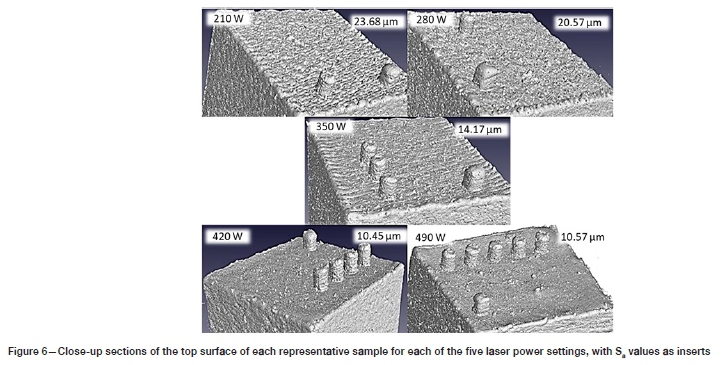
Figure 6 shows close-ups of the top surfaces of the representative samples for each laser power. These images were also obtained using VGSTUDIO MAX. As laser power is increased it can be seen that the surface roughness decreases. The first two top surfaces are seen to have a much higher surface roughness than the last two, corresponding to lower and higher laser power, respectively. The surface roughness values, Sa, are included as inserts in the figure for visual comparison. The values themselves were obtained using optical microscopy with an Olympus DSX 510, which is not dependent on track orientation relative to scanning as it is a surface area scan, which takes the Ra line profile parameter and expands it into three dimensions. The top surface was analysed as it is the final layer in the printing process, which means it is likely to be the most affected by process parameters. The bottom surface was excluded as the samples were printed on supports, leading to an irregular surface that is not representative of the parameters.
The solitary pin on the samples indicates that the samples were the first in each laser power set. The pins that range from one to five indicate the laser power setting that was used, as indicated by the powers in the inserts.
Figure 7 shows how the surface roughness in general decreases with an increase in laser power. The decrease is most likely due to wider and more overlapping melt pools, which creates a relatively smoother top surface. The error bars show that the surface roughness varied greatly in each laser power set.
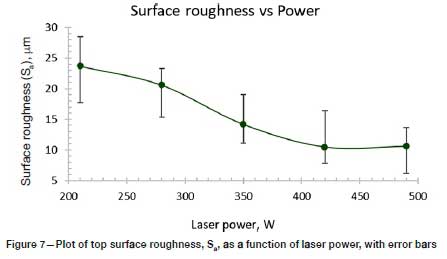
The error bars are calculated using the difference between the average surface roughness, Sa, and the maximum and minimum Sa values for each laser power set.
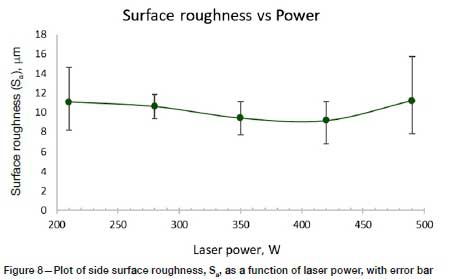
The side surfaces were measured to obtain a general idea of the surface roughness on the sides, to see how they differ from the top surfaces. The sides of the samples showed a much smaller variation between laser power settings, averaging between 9 and 11 pm Sa across all laser powers.
This effect is shown in Figure 8. The errors bars also show how, at the highest and lowest laser powers, the surface roughness varies much more than for the middle laser powers.
Conclusions
From the results it can clearly be seen that higher laser power induces a larger volume of porosity. The higher power leads to more keyhole-type porosity, whereas the lower power samples have more lack-of-fusion type pores. The results show that high-density inclusions decrease in volume with higher laser power, due to remelting, or deeper melt pool penetration.
While higher laser power seems to decrease the surface roughness, it comes at the cost of larger volumes of porosity. If only the variation of porosity with laser power is considered, the optimal power for the given scan speed is in the range 210-280 W, with the lowest porosity at 280 W. However, when considering the measured surface roughness, the lowest porosity values for the top surface are obtained at higher powers. Therefore, depending on the requirements, a suitable combination of roughness and porosity minimization can be obtained. These results indicate some of the challenges associated with L-PBF. Typically, values for porosity < 0.5% are considered reasonable and a roughness, Sa, in the range 20-24 μm might be acceptable for some applications.
Understanding porosity formation and pore morphology associated with laser-powder bed fusion manufactured parts aids in improving parts to decrease the limiting effect these defects can have on parts in industry.
Future work will include investigation of the effect of porosity and surface conditions on corrosion and mechanical properties. Work is also ongoing on detailed 3D pore morphology evaluation using the CT data obtained in this work.
Acknowledgments
The Light Metals Development Network (LMDN) is acknowledged for their financial support. The Collaborative Programme for Additive Manufacturing (CPAM), funded by the South African Department of Science and Innovation, is acknowledged for additional funding.
The authors would like to thank the Stellenbosch University Research group 3DInnovation staff (Ms Carlyn Wells) for their contribution to the success of this project.
The authors acknowledge use of facilities in the RMIT Advanced Manufacturing Precinct
Special thanks to Mr Dewald Noeth and Ms Colleen Syrett at Wirsam Scientific for the use of their Olympus DSX 510 microscope.
Special thanks also to the staff at the University of Pretoria (Dr Robert Cromarty, Mr Sibusiso Mahlalela, Mr Dirk Odendaal, Mr Mfesane Tshazi) for all their assistance during this project.
Authors' contributions
Heinrich Möller: supervision. Anton du Plessis: supervision. Muofhe Tshibalanganda: nano-CT scanning. Martin Leary: printing and provision of samples. Carlien Taute: sample preparation, density and surface roughness measurements. The article was written by Carlien Taute and reviewed by all the authors.
References
Bayat, M., Thanh, A., Möhanty, S., Witvrouw, A., Yang, S., Thorborg, J., Tiedje, N.S., and Hattel, J.H. 2019. Keyhole-induced porosities in Laser-based Powder Bed Fusion (L-PBF) of Ti6Al4V: High-fidelity modelling and experimental validation. Additive Manufacturing, vol. 30. p. 100835. https://doi.org/10.1016/j.addma.2019.100835 [ Links ]
DebRoy, T., Wei, H.L., Zuback, J.S., Mukherjee, T., Elmer, J.W., Milewski, J.O., Beese, A.M., Wilson-Heid, A., De, A., and Zhang, W. 2018. Additive manufacturing of metallic components - Process, structure and properties. Progress in Materials Science, vol. 92. pp. 112-224. https://doi.org/10.1016/j.pmatsci.2017.10.001 [ Links ]
Dilberoglu, U., Gharehpapagh, B., Yaman, U., and Dolen, M. 2017. The role of additive manufacturing in the era of Industry 4.0. Procedia Manufacturing, vol. 11. pp. 545-554. http://dx.doi.org/10.1016/j.promfg.2017.07.148 [ Links ]
Du Plessis, A. 2019 Effects of process parameters on porosity in laser powder bed fusion revealed by X-ray tomography. Additive Manufacturing, vol. 30. p. 100871. https://doi.org/10.1016/j.addma.2019.100871 [ Links ]
Du Plessis, A. and le Roux, S.G. 2018. Standardized X-ray tomography testing of additively manufactured parts: A round robin test. Additive Manufacturing, vol. 24. pp. 125-136. https://doi.org/10.1016/j.addma.2018.09.014 [ Links ]
Du Plessis, A., Yadroitsev, 1., Yadroitsava, I. and le Roux, S.G. 2018a. X-Ray microcomputed tomography in additive manufacturing: A review of the current technology and applications. 3D Printing and Additive Manufacturing, vol. 5, no. 3. pp. 227-247. https://doi.org/10.1089/3dp.2018.0060 [ Links ]
Du Plessis, A., Sperling, P., Beerlink, A., Tshabalala, L., Hoosain, S., Mathe, N., and le Roux, S.G. 2018b. Standard method for microCT-based additive manufacturing quality control 2: Density measurement. MethodsX, vol. 5. pp. 1117-1123. https://doi.org/10.1016/j.mex.2018.09.006 [ Links ]
Du Plessis, A., Sperling, P., Beerlink, A., Tshabalala, L., Hoosain, S., Mathe, N., and le Roux, S. G. 2018c. Standard method for microCT-based additive manufacturing quality control 1: Porosity analysis. MethodsX, vol. 5. pp. 1102-1110. https://doi.org/10.1016/j.mex.2018.09.005 [ Links ]
Du Plessis, A., Yadroitsava, I., and Yadroitsev, I. 2020. Effects of defects on mechanical properties in metal additive manufacturing: A review focusing on X-ray tomography insights. Materials & Design, vol. 187. p. 108385. https://doi.org/10.1016/j.matdes.2019.108385 [ Links ]
Khairallah, S.A., Anderson, A.T., Rubenchik, A., and King, W.E. 2016. Laser powder-bed fusion additive manufacturing: physics of complex melt flow and formation mechanisms of pores, spatter, and denudation zones. Acta Materialia, vol. 108. pp. 36-45. https://doi.org/10.1016/j.actamat.2016.02.014 [ Links ]
Korpela, M., Riikonen, N., Piili, H., Salminen, A., and Nyrhïïa, Ο. 2020. Additive manufacturing-Past, present, and the future. Technical, Economic and Societal Effects of Manufacturing 4.0. [ Links ]
Collan, M. and Michelsen, K.E. (eds.) Palgrave Macmillan, Cham, Finland. https://doi.org/10.1007/978-3-030-46103-4_2 [ Links ]
Maconachie, T., Leary, M., Zhang, J., Medvedev, A., Sarker, A., Ruan, D., Lu, G., Faruoue, Ο., and Brandt, M. 2020. Effect of build orientation on the quasi-static and dynamic response of SLM AlSi10Mg. Materials Science and Engineering A, vol. 788. p. 139445. https://doi.org/10.1016/j.msea.2020.139445 [ Links ]
Majumdar, T., Bazin, Τ., Massahud Carvalho Ribeiro, E., Frith, J.E., and Birbilis, N. 2019. Understanding the effects of PBF process parameter interplay on Ti-6Al-4V surface properties. PLoS ONE, vol. 14, no. 8. p. 24. https://doi.org/10.1371/journal.pone.0221198 [ Links ]
Mohr, G., Altenburg, S.J., Ulbricht, A., Heinrich, P., Baum, D., Maierhofer, C., and Hilgenberg, K. 2020. In-situ defect detection in laser powder bed fusion by using thermography and optical tomography-comparison to computed tomography. Metals, vol. 10, no. 1. p. 19. https://doi.org/10.3390/met10010103 [ Links ]
Read, N., Wang, W., Essa, K. and Attallah, M.M. 2015. Selective laser melting of AlSi10Mg alloy: Process optimisation and mechanical properties development. Materials & Design, vol. 65. pp. 417-424. http://dx.doi.org/10.1016/j.matdes.2014.09.044 [ Links ]
Sercombe, T.B. and Li, X. 2016. Selective laser melting of aluminium and aluminium metal matrix composites: Review. Materials Technology, vol. 31. pp. 77-85. https://doi.org/10.1179/1753555715Y.0000000078 [ Links ]
Shrestha, S., Starr, Τ., and Chou, K. 2019. A study of keyhole porosity in selective laser melting: Single-track scanning with micro-CT analysis. Journal of Manufacturing Science and Engineering, vol. 141, no. 7. p. 11. https://doi.org/10.1115/1.4043622 [ Links ]
Spierings, A.B., Schneider, M., and Eggenberger, R. 2011. Comparison of density measurement techniques for additive manufactured metallic parts. Rapid Prototyping Journal, vol. 17, no. 5. pp. 380-386. https://doi.org/10.1108/13552541111156504 [ Links ]
Stugelmayer, E. 2018. Characterization of process induced defects in laser powder bed fusion processed AlSi10Mg alloy. Master's thesis, Montana Technological University. https://digitalcommons.mtech.edu/grad_rsch/157 [ Links ]
Tang, M. and Pistorius, P.c. 2017. Anisotropic mechanical behavior of AlSi10Mg Parts produced by selective laser melting. JOM, vol. 69. pp. 516-522. https://doi.org/10.1007/s11837-016-2230-5 [ Links ]
Tang, M., Pistorius, P.c., and Beuth, J.L. 2017. Prediction of lack-of-fusion porosity for powder bed fusion. Additive Manufacturing, vol. 14. pp. 39-48. https://doi.org/10.1016/j.addma.2016.12.001 [ Links ]
Tofail, S.A.M., Koumoulos, E.P., Bandyopadhyay, A., Bose, S., O'Donoghue, L., and Charitidis, C. 2018. Additive manufacturing: Scientific and technological challenges, market uptake and opportunities. Materials Today, vol. 21, no. 1. pp. 22-37. https://doi.org/10.1016/j.mattod.2017.07.001 [ Links ]
Wits, W.W., Carmignato, S., Zanini, F., and Vaneker, T.H.J. 2016. Porosity testing methods for the quality assessment of selective laser melted parts. Manufacturing Technologies, vol. 65. pp. 201-204. http://dx.doi.org/10.1016/j.cirp.2016.04.054 [ Links ]
Zerbst, U., Madia, M., Klinger, C., Bettge, D., and Murakami, Y. 2019a. Defects as a root cause of fatigue failure of metallic components. I: Basic aspects. Engineering Failure Analysis, vol. 97. pp. 777-792. https://doi.org/10.1016/j.engfailanal.2019.01.055 [ Links ]
Zerbst, U., Madia, M., Klinger, C., Bettge, D., and Murakami, Y. 2019b Defects as a root cause of fatigue failure of metallic components. II: Non-metallic inclusions. Engineering Failure Analysis, vol. 98. pp. 1-12. https://doi.org/10.1016/j.engfailanal.2019.01.054 [ Links ]
Zerbst, U., Madia, M., Klinger, C., Bettge, D., and Murakami, Y. 2019c. Defects as a root cause of fatigue failure of metallic components. III: Cavities, dents, corrosion pits, scratches. Engineering Failure Analysis, vol. 97. pp. 759-776. https://doi.org/10.1016/j.engfailanal.2019.01.034 [ Links ]
Zhang, B., Li, Y., and Bai, Ο. 2017. Defect formation mechanisms in selective laser melting: A review. Chinese Journal of Mechanical Engineering, vol. 30. pp. 515-527. https://doi.org/10.1007/s10033-017-0121-5 [ Links ]
Zhao, C., Parab, N. D., Li, X., Fezzaa, K., Tan, W., Rollett, A. D. and Sun, Τ. 2020. Critical instability at moving keyhole tip generates porosity in laser melting. Science, vol. 370, no. 6520, pp. 1080-1086. https://doi.org/10.1126/science.abd1587 [ Links ]
 Correspondence:
Anton du Plessis
Email: anton2@sun.ac.za
Received: 27 Aug. 2020
Revised: 12 Apr. 2021
Accepted: 19 Apr. 2021
Published: April 2021
ORCID: C. Taute https://orchid.org/0000-0001-5771-3915; H. Möller https://orcid.org/0000-0001-6075-9965; A. du Plessis https://orchid.org/0000-0002-4370-8661; M. Tshibalanganda https://orcid.org/0000-0003-1933-5698; M. Leary https://orcid.org/0000-0002-2135-1681

