


Services on Demand
Article
 English (pdf)
 Article in xml format
 Article references
Indicators

Related links
-
 Cited by Google
 -
 Similars in Google
Share

 Permalink
Journal of the Southern African Institute of Mining and Metallurgy
On-line version ISSN 2411-9717
Print version ISSN 2225-6253
J. S. Afr. Inst. Min. Metall. vol.121 n.1 Johannesburg Jan. 2021
http://dx.doi.org/10.17159/2411-9717/1325/2021
PROFESSIONAL TECHNICAL AND SCIENTIFIC PAPERS
Exploratory development of a rotary offset crusher
T. Nghipulile; M. Bwalya; M. Moys; H. Simonsen
School of Chemical and Metallurgical Engineering, University of the Witwatersrand, Johannesburg, South Africa
SYNOPSIS
The quest for efficiency in comminution is an ongoing concern as comminution usually constitutes a major cost component in the metal production industry. Such improvements can be made by circuit optimization or development of more efficient equipment. A novel crusher, known as the rotary offset crusher (ROC), promises to deliver in this space. The ROC was invented in 2002 by Michael Hunt, Henry Simonsen, and Ian Sinclair, but failed to garner enough support to progress to production. The original design concept was recently rekindled, and a laboratory version of the crusher has been built and commissioned at the University of the Witwatersrand. The crusher is simple in design, with two cylindrical discs that are parallel to each other, and, as the name implies, there is an offset between the vertical axes of the discs. The top disc has a conical section on its lower face, and this creates a crushing zone between the opposite faces of the two spinning discs. Centrifugal motion transports particles through the crushing zone. Batch experiments have been conducted with quartz at various crusher settings (discs offset, rotational speed, and vertical exit gap) for various feed size distributions. The indications so far suggest that the disc speed is a key factor affecting the performance. Size reduction ratios as high as 11 were recorded from experiments with quartz at a speed of 830 r/min.
Keywords: rotary offset crusher, comminution, throughput.
Introduction
The mining industry consumes about 7% of global energy (Manouchehri, 2015), of which about 30 to 70% is utilized in comminution circuits (Ballantyne and Powell, 2014; Curry, Ismay, and Jameson, 2014; Jeswiet and Szekeres, 2016; Nadolski et al., 2014; Napier-Munn, 2015; Radziszewski, 2013; Tromans, 2008). Comminution is, at present, a relatively inefficient process with only a small fraction of the energy, meant for size reduction, being used to effect breakage, with the rest being lost in different forms of energy; such as heat, sound, mechanical losses, and others (Tavares and King, 1998; Radziszewski, 2013; Wills and Finch, 2006). Energy efficiency in comminution is therefore an issue that continues to receive much attention. In addition, conventional crushers are characterized by low reduction ratios in the range of 3:1 and 10:1 (Gupta and Yan, 2006). Thus innovation to lower comminution costs and effect improvement of the overall efficiency remains a goal for the sustainability of the mineral industry. The rotary offset crusher (ROC), under development at the University of the Witwatersrand, has the potential advantage of reducing equipment size as energy can be concentrated in a small space simply by increasing the rate of rotation of the discs, which aids both particle transportation and comminution frequency.
The ROC is a novel crushing device that exploits the centrifugal motion of particles between two off-centre, high-speed spinning discs and the consequential closure and opening of the hollow conical space in the upper disc due the discs being off-centre. The ROC is a new device with many of its aspects yet to be understood, and thus an experimental programme has been initiated to establish what drives the capacity of this machine. The crusher has been instrumented to provide information about the process.
Theoretical background
Breakage mechanisms in comminution machines
Size reduction concerns the fracture of brittle particles due to applied compressive stress (Tavares and King, 1998). The degree of fracture (of rocks) depends on the mechanical properties of the individual minerals in the ore matrix and, more importantly, upon the presence of cracks in the matrix. Cracks act as sites for stress concentration (Griffith, 1920; Tavares and King, 1998). Crack propagation, on which primary and secondary crushing rely, begins where the stress is concentrated and, depending on the magnitude of the applied stress relative to the strength of the material, the crack may propagate, resulting in some degree of comminution.
Fragmentation of rocks in comminution equipment occurs due to three mechanisms - impact, compression, and abrasion. Impact breakage occurs when a large compressive stress is applied rapidly on the particles resulting in the production of daughter particles of a wider size distribution. In the ROC, the rapid variation of the gap between the crushing discs during each revolution as particles are transported away from the centre to the crusher periphery will subject particles to cyclic impulses of compressive forces. At this point it can only be hypothesised that both impact, due to rapid movement of the discs, and compressive loading are possible. Compression breakage, which dominates in the high pressure grinding roll (HPGR) and vertical roller mill (VRM), is said to be energy-efficient (Altun et al., 2015; Genf and Benzer, 2016; Reichert et al., 2015; Rosario and Hall, 2010; Saramak, Wasilewski, and Saramak, 2017; Wang and Shrive, 1995; Wang et al., 2009; Schönert, 1996, 1988). This is due to the application of stress (pressure) on the feed particles, resulting in the production of daughter particles that are about the same size as their component grain size in the parent particle, as well as much finer progeny particles that originate at the points of stress application. It is also claimed that the progeny particles from the HPGR and VRM contain many residual micro-cracks (Ozcan and Benzer, 2013), which suggests that less comminution energy will be required and grinding kinetics improved in the subsequent grinding mills such as a ball mill (Barani and Balochi, 2016). With the particles in the ROC being forced between the fast-spinning discs, there is a degree of compression breakage. The last mode of breakage, abrasion, is a surface phenomenon which occurs when particles move parallel to their plane of contact (Napier-Munn et al., 2005). In the ROC, abrasion is expected due to the comminuted particles sliding along the discs' surfaces.
Energy laws in comminution
The relationship between the input energy and the particle size of the feed that provides a particular product size from the comminution device can be mathematically described by Equation [1].
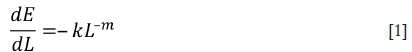
where dE is an infinitesimal change in specific energy, dL is an infinitesimal size change, L is the particle size, k is a constant and m is a constant related to the material and the way it is broken.
The exponent m in Equation [1] was assigned three possible values by three researchers (2, 1, and 1.5 for Rittinger, Kick, and Bond's laws respectively). Rittinger's law, which relates energy to the change in surface area, provides a reasonable estimate for energy when the machine is handling finer particles while Kick's law, which postulates that the energy required to reduce a material in size is directly proportional to the percentage reduction, applies to particles with sizes greater than 1 cm (Wills and Finch, 2016). Bond's law, called a third theory in comminution, states that the energy required in comminution is proportional to the new crack length created. Bond's law is commonly used as it applies to a wider range of particle size handled in conventional mills. Integrating Equation [1] and assigning a value of 1.5 to the exponent m results in the Bond work index equation below.
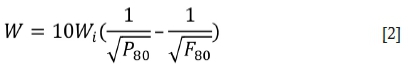
where W is the input energy (kWh/t), W¡ is the work index (kWh/t), and F80and P80are the 80% passing sizes of the feed and product respectively.
The Bond equation can predict the specific energy with acceptable accuracy for ball and rod mills but, as pointed out by Morrell (2004), this law tends to either over-predict, or under-predict the specific comminution energy for autogenous (AG) or semi-autogenous (SAG) mills, HPGRs, and conventional crushers. In the quest to establish a more accurate estimation of the specific energy, not just for tumbling mills but for more general application to comminution equipment such as jaw, gyratory, and cone crushers as well as HPGRs, Morrell (2009) proposed the equation below:
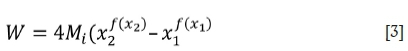
where W is the specific energy in kWh/t, M¡ is the work index related to the breakage property of an ore and the comminution machine (in kWh/t), x2is the 80% passing size for the product (μm), and x1is the 80% passing size for the feed (μm).
The Morrell equation differs from the Bond equation as the exponent/(x) in Equation [3] does not have a specific value, but it is rather a function of the 80% passing size and can be estimated using another equation Morrell has developed:
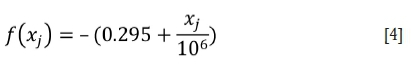
where xjis the 80% passing size. We thus have some basis for comparing specific energy consumption between different comminution equipment.
Design features and operating principles of the rotary offset crusher
Design features of the ROC
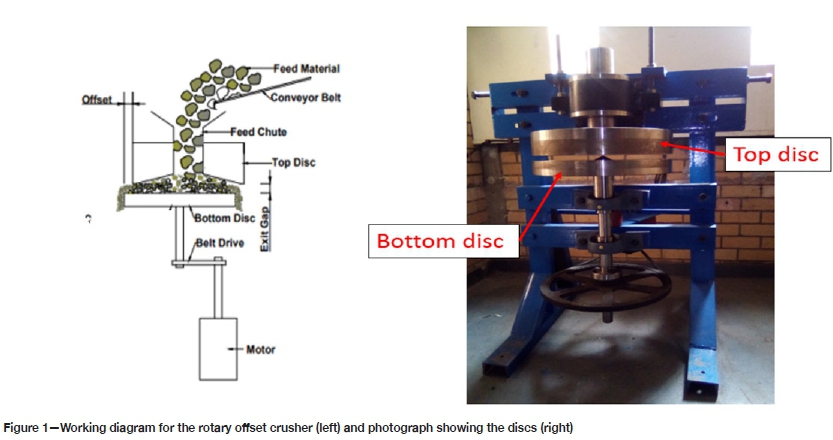
The working diagram and a photograph depicting the main components are shown in Figure 1. The crusher's cylindrical discs both have a radius of 250 mm, with the bottom disc having a thickness of 50 mm while top disc has a thickness of 80 mm. The discs, which are made of mild steel, are not mechanically linked. The whole structure is 1.1 m high and 1 m wide. The legs of the equipment are bolted onto the floor to minimize mechanical vibrations. In this design, only the bottom disc is driven by the motor using the V-belt. The speed can be varied by changing the diameters of the pulleys. The top disc moves due to transmission of motion by the particles that get nipped between the discs. The crusher is powered using a 3 kW three-phase induction motor that has a full-load speed of 1420 r/min.
Effect of the horizontal offset on the geometry of crushing zone
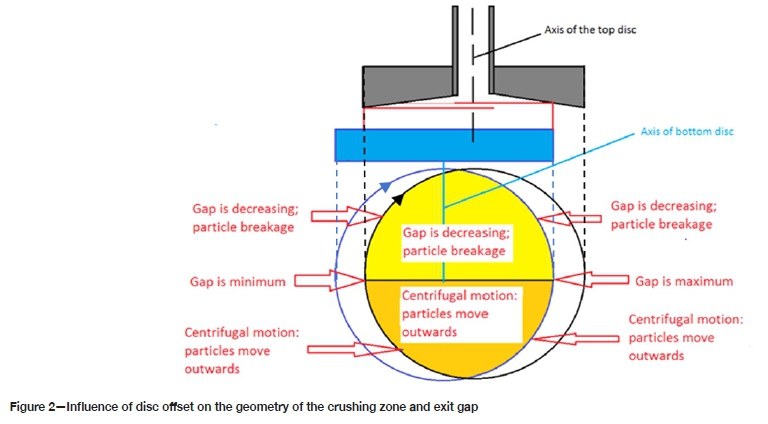
As shown in Figure 1, there is an offset between the vertical axes of the crusher discs. This horizontal offset of the top disc relative to the bottom disc produces a change in the geometry of the crushing zone during rotation. The horizontal offset between the discs is adjusted by sliding the top disc support structure. From the top view of the discs in Figure 2, it can be observed that there is a volume contraction in 180° rotation of the crushing chamber, which suggests that comminution occurs predominantly in this half. On the other hand, there is volume expansion in the other 180°, implying that transportation is dominant here. Due to the offset, as shown in Figures 2 and 3, the exit gap is not constant during a rotation (it is minimum on the left side and maximum on the right side). This implies that the largest particle that can be discharged from the crusher depends rather on the exit gap shown on the right side. The maximum exit gap (denoted as Ge,max) increases with the offset and thus it can be hypothesised that increasing the offset ensures fast transportation of particles to some extent, i.e. changing the offset results in an increase in crusher throughput. The effect of offset on the throughput, size reduction, and power draw are discussed later.
With the current configuration of the crushing surfaces, there is a variation in the input and exit gaps only when the offset is greater than the interior flat edge of the top disc, which is 10 mm. With the offset equal to, or less than, this value there is no variation in the exit gap as shown in Figure 3, but the volume contraction and expansion of the crushing zone still occurs regardless of the whether the offset is less than, equal to, or greater than the interior flat edge of the top disc.
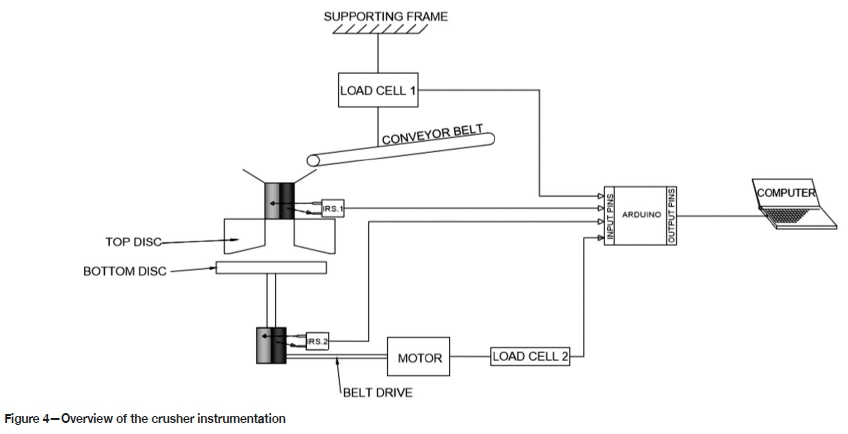
Crusher instrumentation
Figure 4 shows the positions of the four transducers installed on the crusher. These include two IR sensors (shown as IRS.1 and IRS.2) directed to the shafts for the two discs of the crusher to measure their rotational speeds and two strain gauge load cells for measuring the loads (weight of material fed to the crusher and force required to keep the torque arm of the motor stationary). The speeds of the discs and the motor drive torque are used to calculate the mechanical power of the system, while the change in the mass of the material on the conveyor belt gives the feed rate.
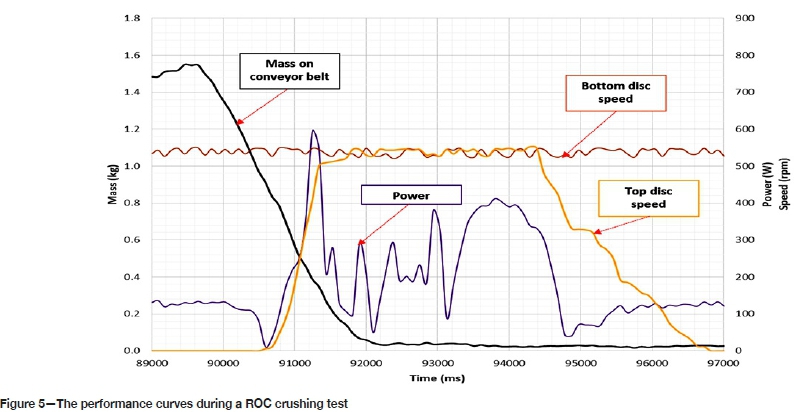
With the instrumentation circuit in Figure 4, various signals are captured. Figure 5 is a plot of some typical results obtained during batch operation. We observe the conveyor weight signals decreasing steadily between 89 600 ps and 92 000 ps, which can be converted to feed rate, using Equation [5], as 2220 kg/h.
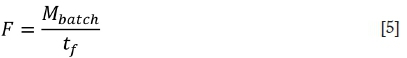
where F is the feed rate (kg/h or t/h), Mbatch is the total mass fed to the crusher (in kg or tons), and tf is the feeding time (in hours).
As soon as the particles get nipped between the discs, the upper disc is accelerated to the speed of the lower disc and its speed decrease only when there are no longer particles nipped between the discs. Thus, the signal of the top disc speed indicates the time when the particles are trapped between the discs.
The area under the power signal, for the time when the particles are being crushed, can be numerically integrated to provide the energy expended during crushing. The specific energy during crushing is calculated using Equation [6]. The power signal provides insight into mechanisms of crushing and transportation of particles in the crushing zone. For example, the first 'rise' in the power signal indicates the locking of particles between the discs and commencing of particle breakage. The subsequent 'rise' and 'drop' indicate the successive particle locking and releasing along the comminution cavity, respectively.
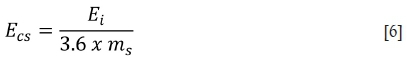
where Fcsis the specific energy (in kWh/t), F¡ is the input energy (in J) during crushing, msis the mass of the crushed rocks (in grams), and 3.6 is a factor for converting specific energy from J/g to kWh/t.
Particle transportation in the crusher
The centrifugal motion provides the means for transportation of particles from the centre of the crushing zone to the periphery, where they are discharged to the collection box, for as long as they are smaller than the spacing between the edges of the discs. The centrifugal acceleration is a function of the speeds and radii of the two discs, as shown by Equation [7]. The higher the rotational speed, the higher the centrifugal acceleration which, in turn, implies high crusher throughput. Using Equation [7], the centrifugal accelerations in the crushing zone, as a function of the radius of the disc, were evaluated for speeds of 330, 550, and 830 r/min (the speeds that have been tested during the experiments). The results are plotted in Figure 6. It is observed that increasing the speed by a factor of 1.7 (i.e. from 330 to 550 r/min) results in the centrifugal acceleration increasing by a factor of 2.8 (obtained by dividing the slopes of the two graphs). Increasing the speed to 830 r/min would result in centrifugal acceleration increasing by a factor of 6.3 (with reference to a speed of 330 r/min).

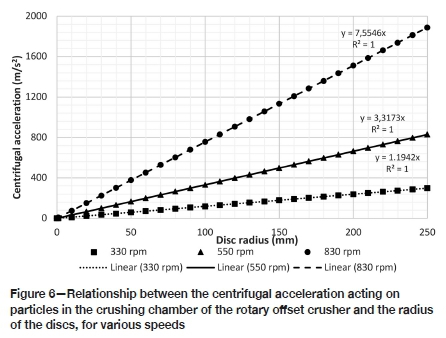
where acis centrifugal acceleration, ω is angular velocity in rad/s, and r is the radius of the bottom disc.
The largest particle size in the feed material is dependent on the throat (internal diameter) of the chute and, most importantly, on input gap (Gin) of the crusher. This input gap is a function of the angle of the comminution cavity and the exit gap (Ge) as shown in Figure 7. A larger angle α suggests that coarser particles can be fed to the crusher. This angle greatly influences the geometry of the crushing chamber, and in turn, the capacity of the crusher. The angle of the comminution cavity for the current design used in this study is 6°.
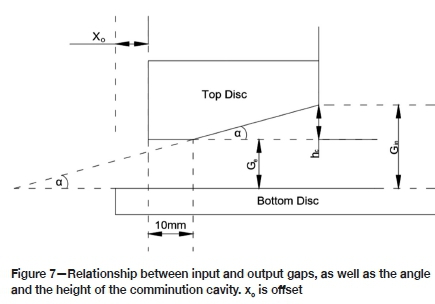
The largest particle discharged from the crusher is dependent, to a degree, on the exit gap (Ge). The input and exit gaps are related by Equation [8]. Other factors that are expected to affect the product size distribution are feed material characteristics (hardness and size distribution), rotational speed, disc offset, and profile design. This exit gap is set before the experimental run and measured after every run to check if there is any change.

where hc is the height of comminution cavity, Ge is the exit gap, and Giis the input gap.
Experimental work
Sample preparation
The quartz sample was dry-sieved to obtain the three narrow size fractions, -6.7+4.75 mm, -13.2+9.5 mm, and -19+13.2 mm, in 1.5 kg sub-samples for the three size classes prepared using a rotary splitter. The prepared samples were used for the comminution tests discussed below.
ROC crushing tests
The effects of the operating variables (feed size distribution, rotational speed, horizontal offset between the vertical axes of the discs, and vertical exit gap) were investigated using the prepared single size fraction samples. The following crusher settings were considered: offset (10, 16, and 23 mm), rotational speed (330, 550, and 830 r/min), and vertical exit gap (1.5 and 3 mm). Firstly, the effect of rotational speed on crusher performance was investigated using the -13.2+9.5 and -19+ 13.2 mm size fractions and rotational speeds of 330, 550, and 830 r/min. The horizontal offset and vertical exit gap were fixed at 10 and 3 mm respectively. The effect of the horizontal offset on the performance of the ROC was then investigated using the -6.7+4.75 and -19+13.2 mm size fractions with offsets of 10, 16, and 23 mm. The speed was fixed at 830 r/min, while two vertical exit gaps (1.5 and 3 mm) were used. A typical test involves feeding the material using the conveyor and, after crushing is done (when the top disc has stopped), the machine is powered off before the crusher product in the collection box is collected for size analysis. The speeds of the two discs, weights of the material conveyed to the feed hopper, and the force required to keep the torque arm stationary are measured and recorded in real time during each test.
Results and discussion
Effect of rotational speed on crusher performance
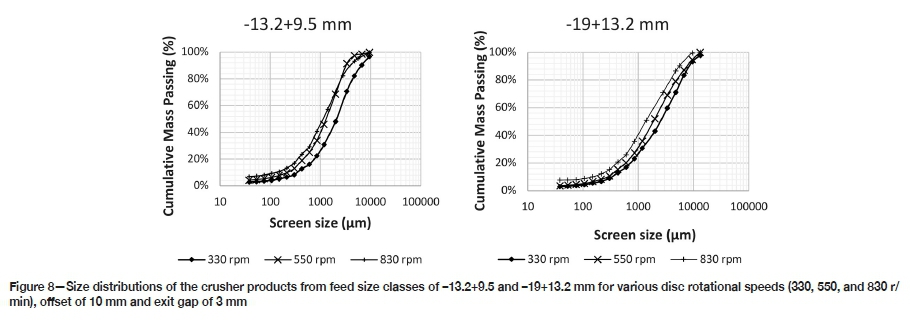
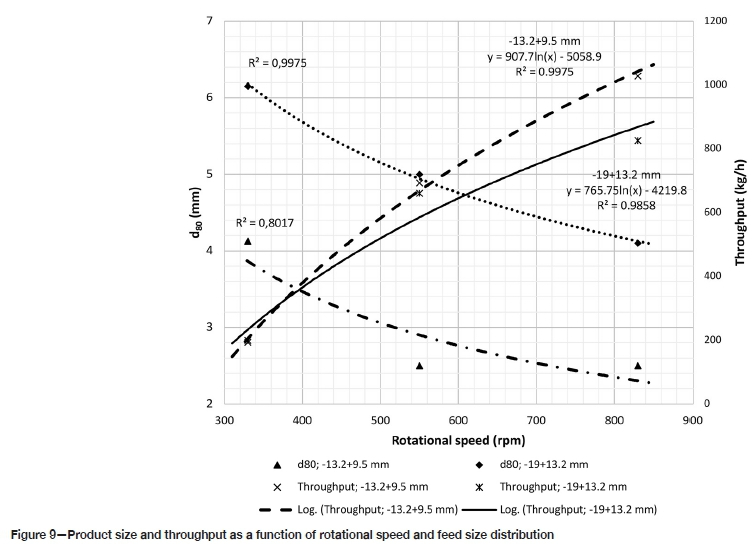
The product size distributions for the two feed size classes (-13.2+9.5 and -19+13.2 mm) at various speeds are shown in Figure 8. The d80 sizes were interpolated from Figure 8 and are plotted, together with the crusher throughput, in Figure 9. It is observed that the higher the speed the finer the crusher product. As shown in Figure 9, the throughput increases with the rotational speed for both the -13.2+9.5 and -19+13.2 mm fractions.
Effect of horizontal disc offset and vertical exit gap
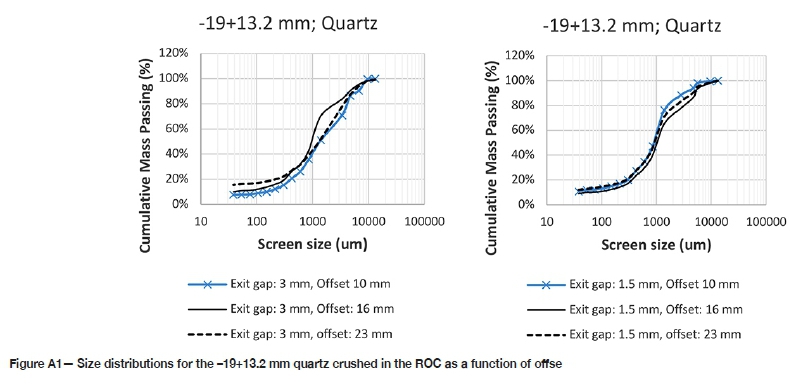
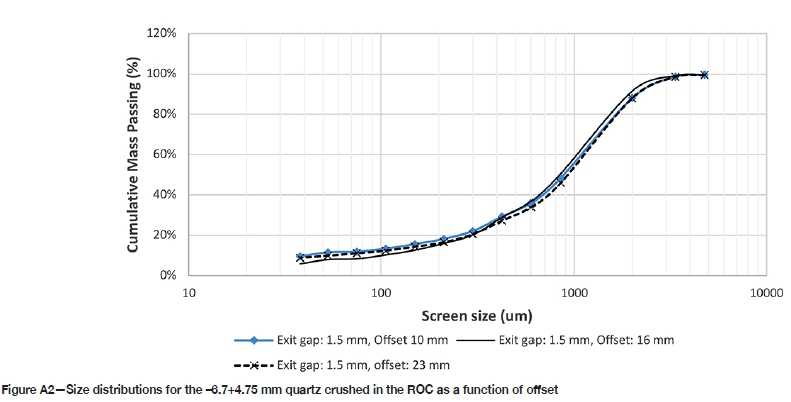
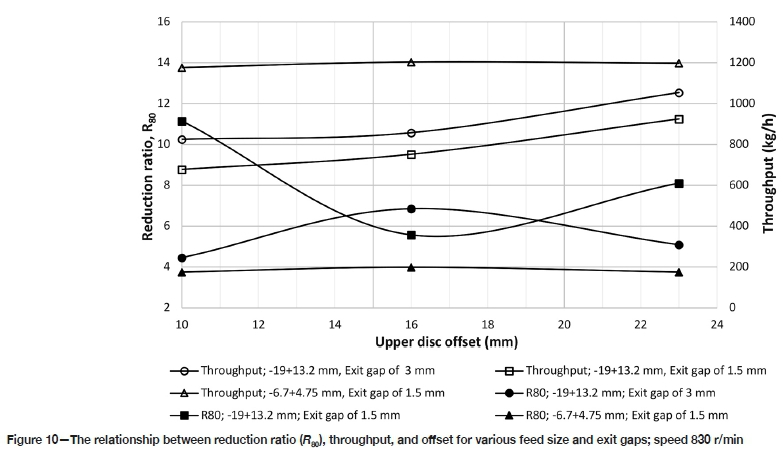
The product size distributions for the -19+13.2 and -6.7+ 4.75 mm size fractions of quartz that were used to investigate the effect of horizontal offset on crusher performance are listed in Appendix A. In Figure 10, the effects of varying the horizontal offset on the reduction ratio (based on product d80size) and throughput are shown.
Relationship between energy and product size
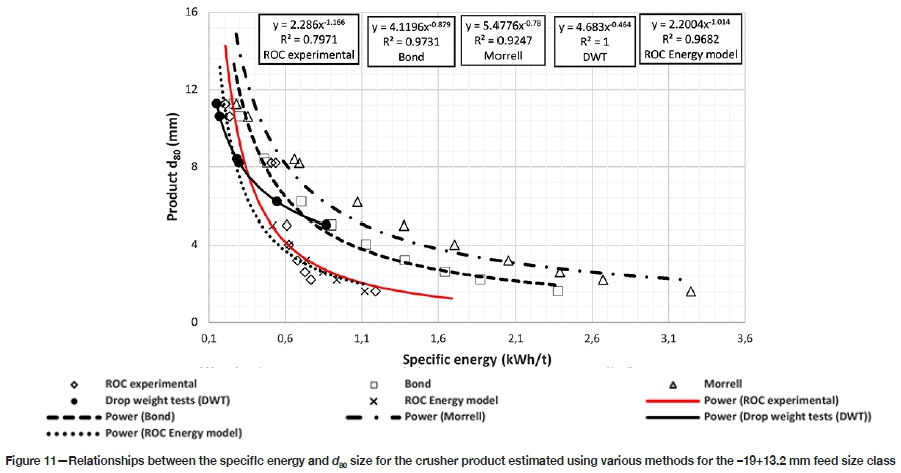
The major types of energy in the ROC include (1) the rotational energy (stored in the discs) and (2) comminution energy (responsible for creating new surface areas). The balance is accounted for by the friction in the system. Figure 11 shows the specific energy calculated from the total energy utilized during crushing of the -19+13.2 mm particles. The methodology for calculating the specific energy was discussed earlier. The existing formulae (Bond's in Equation [2] and Morrell's in Equation [3]) for estimating the specific energy were assessed for the ROC application, and results are also plotted in Figure 11. In addition, the relationship between the product d80 sizes and specific energy from the drop weight tests (DWT) using single quartz particles was also used to estimate the energy input for the experimental d80sizes obtained from the ROC, and the results included in Figure 11. As can be observed from the coefficient of correlation (R2) values, there exist well-defined relationships (fitting the power function) between the product size and specific energy.
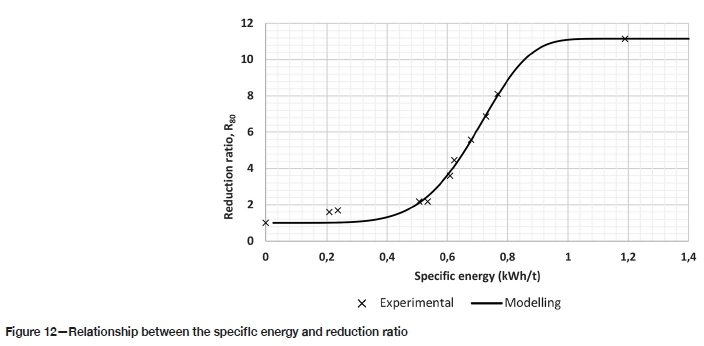
The relationship between the reduction ratio (calculated from the d80 in Figure 11) and specific energy is shown in Figure 12.
Discussion of results
From the trends in Figures 8 and 9, it is clear that the crusher product becomes finer with increasing speed. The frequency of crushing actions is the function of the rate of rotation of the discs. With a high rotational speed there is a corresponding increase in the frequency of comminution events, resulting in higher throughput as well as higher reduction ratios. Thus far the highest reduction ratio of 11 has been achieved with the highest speed attempted so far (830 r/min) and it is clear there is a need to attempt higher speeds in future to establish more optimal speeds related to both material and feed size distribution.
There is an indication that the horizontal offset affects the reduction ratio of the coarse feed (-19+13.2 mm) but has little effect with a finer feed (-6.7+4.75 mm), as seen in Figure 10. We also notice that the larger gap of 3 mm was optimal for the medium offset (16 mm) while the gap of 1.5 mm suggests otherwise for this offset. We do not have a complete explanation for this and this issue will probably become clearer when higher speeds are attempted in future. There is also technical challenge of structural flexure of the equipment to address, which we refer to later.
It can be seen from Figure 10 that feeding the crusher with fine particles (-6.7+4.75 mm) results in high throughputs (compare the throughputs for the -6.7+4.75 mm and -19+ 13.2 mm size classes. For the -6.7+4.75 mm feed particles, the throughput did not change with the increasing offset. This is contrary to the results for the -19+13.2 mm particles, where the throughput increased slightly with increasing offset, although the effect of offset on throughput is not as significant as that of speed (see Figure 9). The throughput dependence on the exit gap can be observed from the -19+13.2 mm size class plots for two exit gaps (1.5 and 3 mm). For each offset, a higher throughput was recorded for the larger exit gap (3 mm).
It is worth mentioning that 'slab' particles were produced by the ROC. We are considering using discrete element modelling (DEM) software to assess the crusher performance (breakage and transportation) for various shapes (profiles) of crushing surfaces to establish whether the production of slabs can be minimized. An apparent flexure in the structure was also observed, with the thickness of some of slab particles produced being greater than the exit gap. The present structure was designed primarily to facilitate experimentation and thus its mechanical rigidity still needs to be reinforced to allow full transmission of energy to the particles.
In Figure 11, the energy efficiency of the ROC is analysed by applying the Bond and Morrell formulae and compared with drop weight test (DWT) data that was obtained for this quartz sample. It is seen that the experimental data (shown as the red curve) lies between the relationships for the DWT and Bond data for product specific energies less than 0.35 kWh/t. For specific energies greater than 0.35 kWh/t, the experimental specific energies are below what is predicted by Bond's and Morell's equations as well as the relationship from the single particle DWTs. The specific energies predicted using the relationship established from the DWT experiments, are smaller than those predicted by Bond's and Morrell's equations. Single particle breakage is the most efficient breakage mechanism in terms of energy utilization (Tavares, 2004). The estimated values using the Bond equation are lower than those indicated by Equation [3] (Morrell, 2004).
It is important to note that for both Equations [2] and [3], the Bond work index of 13.57 kWh/t for quartz (as reported in Wills and Finch, 2016) was used. The most reliable work index for the rocks crushed in the ROC could perhaps be obtained from the SCM test® (Morrell, 2009) and this is likely to be smaller than 13.57 kWh/t. It should be noted that the ROC is classed as a secondary or tertiary crusher.
A more reliable relationship between ROC specific energy and the feed and product size distributions was found to take the form of Equation [9] with exponent m equal to 0.216 (obtained using the iteration method with the objective function set to measure the minimum root mean square error). The specific energies computed using Equation [9] for the experimental d80 sizes are also plotted in Figure 11, where they are labelled 'ROC energy model'. This relationship gives a better estimate for the ROC specific energy, especially for specific energies above 0.6 kWh/t, as compared to Bond's and Morrell's equations. It should, however, be noted that this is from the small amount of experimental data generated thus far. A more reliable model would have to be formulated as the experimental programme progresses.

where W is the specific energy in kWh/t, Wi is the Bond work index in kWh/t, P80 is the 80% passing size of the product in μm, F80 is the 80% passing size in μm, and m is the exponent with an estimated value of 0.216187582.
It can be seen from Figure 12 that the reduction ratio generally increases with specific energy. The experimental data was fitted to Equation [10]. For energies below 0.4 kWh/t there is no significant size reduction, as it can be seen that the reduction ratios are very similar and equal to unity. The size reduction ratio increases steadily with input energy for specific energies between 0.4 and 1 kWh/t. When further experiments are conducted in future at higher speeds, this model needs to be revisited.
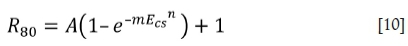
where A, m, and n are constants and 1 is the reduction ratio at zero input energy.
Conclusions
➤ A working prototype of the laboratory ROC has been built and an experimental programme has been commissioned.
➤ The work so far has revealed that the disc speed is a key factor affecting the performance. Size reduction ratios as high as 11 were recorded for experiments with quartz at a speed of 830 r/min.
➤ From the experimental results there are no clear trends between the horizontal offset of the upper disc and product size distribution. However, there is a noticeable increase in crusher throughput with the offset.
➤ Slab particles were produced from the ROC. This is could be attributed to insufficient crushing energy (suggesting a need to attempt higher speeds to increase the energy intensity in the crusher) and the shape of the profiles on the crushing surfaces. Consideration is being given to using the discrete element method (DEM) for various design configurations to study the flow and breakage behaviours of the particles in the crusher.
➤ There is also a need to strengthen the structure to ensure that there is no significant flexure, thereby ensuring that the energy meant for breaking the particles is efficiently utilized and thus allowing the full potential of the crusher to be established.
➤ Further experimental work will be conducted on more materials, including some common ores, under a variety of operating conditions to establish sufficient data on which to base comparison with other comminution equipment such as the HPGR, cone crusher, and Loesche mill.
➤ Measurement of the wear rate on the crushing surfaces will also need to be considered in future.
Acknowledgement
We acknowledge the financial support in the form of grant from South African Minerals to Metals Research Institute (SAMMRI). The workshop team in the School of Chemical and Metallurgical Engineering at University of the Witwatersrand is acknowledged for their technical support.
References
Alton, D., Gerold, C., Benzer, H., Alton, 0., and Aydögan, N. 2015. Copper ore grinding in a mobile vertical roller mill pilot plant. International Journal of Mineral Processing, vol. 136. pp. 32-36. https://doi.org/10.1016/j.minpro.2014.10.002 [ Links ]
Ballantyne, G.R. and Powell, M.S. 2014. Benchmarking comminution energy consumption for the processing of copper and gold ores. Minerals Engineering, vol. 65. pp. 109-114. https://doi.org/10.1016/j.mineng.2014.05.017 [ Links ]
Barani, K., and Balochi, H. 2016. A comparative study on the effect of using conventional and high pressure grinding rolls crushing on the ball mill grinding kinetics of an iron ore. Physicochemical Problems of Mineral Processing, vol. 52, no. 2. pp. 920-931. https://doi.org/10.5277/ppmp160231 [ Links ]
Curry, J.A., Ismay, M.J.L., and Jameson, G.J. 2014. Mine operating costs and the potential impacts of energy and grinding. Minerals Engineering, vol. 56. pp. 70-80. https://doi.org/10.1016/j.mineng.2013.10.020 [ Links ]
Genç, and Benzer, A.H. 2016. Effect of High Pressure Grinding Rolls (HPGR) pre-grinding and ball mill intermediate diaphragm grate design on grinding capacity of an industrial scale two-compartment cement ball mill classification circuit. Minerals Engineering, vol. 92. pp. 47-56. https://doi.org/10.1016/j.mineng.2016.02.009 [ Links ]
Griffith, A.A. 1920. The phenomena of rupture and flow in solid. https://royalsocietypublishing.org/doi/pdf/10.1098/rsta.1921.0006 [ Links ]
Gupta, A. and Yan, D.S. 2006. Mineral Process Design and Operations: An Introduction (1st edn). Elsevier, Amsterdam. [ Links ]
Jeswiet, J., and Szekeres, A. 2016. Energy consumption in mining comminution. Procedía CIRP, vol. 48. pp. 140-145. https://doi.org/10.1016/j.procir.2016.03.250 [ Links ]
Manouchehri, H.R. 2015. Towards sustainability by bridging the gap in comminution - from finely crushed ore to stirred media milling. Proceesings of the 6th International Semi-Autogenous Grinding and High Pressure Grinding Roll Technology Conference, Vancouver, September 2015. pp. 1-16. https://www.ceecthefuture.org/wp-content/uploads/2015/11/55-Hamid-Reza-Manouchehri-Towards-Sustainability-by-Bridging-the-Gap-in-Comminution-%E2%80%93-From-Finely-Crushed-Ore-to-Stirred-Media-Milling.pdf [ Links ]
Morrell, S. 2004. Predicting the specific energy of autogenous and semi-autogenous mills from small diameter drill core samples. Minerals Engineering, vol. 17, no. 3. pp. 447-451. https://doi.org/10.1016/j.mineng.2003.10.019 [ Links ]
Morrell, S. 2009. Predicting the overall specific energy requirement of crushing, high pressure grinding roll and tumbling mill circuits. Minerals Engineering, vol. 22, no. 6. pp. 544-549. https://doi.org/10.1016/j.mineng.2009.01.005 [ Links ]
Nadolski, S., Klein, B., Kumar, Α., and Davaanyam, Z. 2014. An energy benchmarking model for mineral comminution. Minerals Engineering, vol. 65. pp. 178-186. https://doi.org/10.1016/j.mineng.2014.05.026 [ Links ]
Napier-Munn, T. 2015. Is progress in energy-efficient comminution doomed? Minerals Engineering, vol. 73. pp. 1-6. https://doi.org/10.1016/j.mineng.2014.06.009 [ Links ]
Napier-Munn, T. J., Morrell, S., Morrison, R. D., and Kojovic, T. 2005. Mineral Comminution Circiuits: Their Operation and Optimisation (3rd edn). Julius Kruttschnitt Mineral Research Centre, University of Queensland, Australia. [ Links ]
Ozcan, 0. AND Benzer, H. 2013. Comparison of different breakage mechanisms in terms of product particle size distribution and mineral liberation. Minerals Engineering, vol. 49. pp. 103-108. https://doi.org/10.1016/j.mineng.2013.05.006 [ Links ]
Radziszewski, P. 2013. Energy recovery potential in comminution processes. Minerals Engineering, vol. 46-47. pp. 83-88. https://doi.org/10.1016/j.mineng.2012.12.002 [ Links ]
Reichert, M., Gerold, C., Fredriksson, A., Adolessön, G., and Lieberwirth, H. 2015. Research of iron ore grinding in a vertical-roller-mill. Minerals Engineering, vol. 73. pp. 109-115. https://doi.org/10.1016/j.mineng.2014.07.021 [ Links ]
Rosario, P. and Hall, R. 2010. A structured approach to the evaluation of the energy requirements of HPGR and SAG mill circuits in hard ore applications. Journal of the Southern African Institute of Mining and Metallurgy, vol. 110, no. 3. pp. 117-123. [ Links ]
Saramak, D., Wasilewski, S., and Saramak, A. 2017. Influence of copper ore comminution in HPGR on downstream minerallurgical processes. Archives of Metallurgy and Materials, vol. 62, no. 3. pp. 1689-1694. https://doi.org/10.1515/amm-2017-0258 [ Links ]
Tavares, L. 2004. Optimum routes for particle breakage by impact. Powder Technology, vol. 142, no. 2-3. pp. 81-91. [ Links ]
Tavares, L. and King, R. 1998. Single-particle fracture under impact loading. International Journal of Mineral Processing, vol. 54, no. 1. pp. 1-28. https://doi.org/10.1016/s0301-7516(98)00005-2 [ Links ]
Tromans, D. 2008. Mineral comminution: Energy efficiency considerations. Minerals Engineering, vol. 21, no. 8. pp. 613-620. https://doi.org/10.1016/j.mineng.2007.12.003 [ Links ]
Wang, E.z. and Shrive, N.G. 1995. Brittle fracture in compression: Mechanisms, models and criteria. Engineering Fracture Mechanics, vol. 52. pp. 1107-1126. https://doi.org/10.1016/0013-7944(95)00069-8 [ Links ]
Wang, J.H., Chen, Q.R., Kuang, Y.L., Lynch, A.J., and zhuo, J.W. 2009. Grinding process within vertical roller mills: experiment and simulation. Mining Science and Technology, vol. 19, no. 1. pp. 97-101. https://doi.org/10.1016/S1674-5264(09)60018-1 [ Links ]
Wills, B.A. and Finch, j. 2016. Wills' Mineral Processing Technology: An Introduction to the Practical Aspects of Ore Treatment and Mineral Recovery. 8th edn. Elsevier Butterworth-Heinemann. [ Links ] ♦
 Correspondence:
T. Nghipulile
Email: 1871606@students.wits.ac.za ngh.titus@gmail.com
Received: 25 Aug. 2020
Accepted: 15 Dec. 2020
Published: January 2021
ORCID
T. Nghipulile https://orcid.org/0000-0003-4399-2620
M. Bwalya https://orcid.org/0000-0002-2009-2913
M. Moys https://orcid.org/0000-0003-1533-2668
H. Simonsen https://orcid.org/0000-0001-5302-7280
Size distributions for the effect of offset

