


Serviços Personalizados
Artigo
 Inglês (pdf)
 Artigo em XML
 Referências do artigo
Indicadores

Links relacionados
-
 Citado por Google
 -
 Similares em Google
Compartilhar

 Permalink
Journal of the Southern African Institute of Mining and Metallurgy
versão On-line ISSN 2411-9717
versão impressa ISSN 2225-6253
J. S. Afr. Inst. Min. Metall. vol.120 no.12 Johannesburg Dez. 2020
http://dx.doi.org/10.17159/2411-9717/1103/2020
PROFESSIONAL TECHNICAL AND SCIENTIFIC PAPERS
A critical analysis of recent research into the prediction of flyrock and related issues resulting from surface blasting activities
J. van der Walt; W. Spiteri
Department of Mining Engineering, University of Pretoria, South Africa. J. van der Walt: https://orcid.org/0000-0002-9542-3721
SYNOPSIS
Since 2010, a number of researchers have investigated the development of new models to generate accurate predictions relating to the risks from flyrock. The purpose of this paper is to summarize and analyse these recent studies in order to determine the validity of the findings as a global solution. Recent publications have proposed a wide range of potential approaches and techniques to predict or investigate flyrock. Several authors have proposed viable solutions based on assumed causative parameters and their impact as inputs. However, the results were concluded to be site-specific and could not be applied to other environments. Since the actual impact of blast design parameters on the risk of flyrock remains debatable, based on the varying assumptions made in recent research, it is important to use an objective methodology for evaluating the impact of design parameters as well as environmental considerations. The testing methodologies used to measure the actual flyrock distance are not scientific and are highly dependent on the scrutiny of the researcher. In order to present results that are objective and uncriticizable, an accurate, quantitative and objective method of measuring the travel distance of flyrock is required.
Keywords: flyrock, flyrock prediction, flyrock measurement, blast safety, blast analysis, blast damage.
Introduction
Flyrock is the main cause of damage to equipment or infrastructure resulting from a blast and has fatally injured people in the vicinity of a blast (Bajpayee et al., 2003). Injury to mine employees as well damage to surrounding property or infrastructure can result in high financial and reputational penalties for a mine. It is, therefore, imperative that the risk of flyrock is minimized. In order to reduce flyrock and minimize the severe consequences associated with excessive flyrock, it is important to understand the phenomena and how various blast parameter contribute to it.
The research relating to predicting the flight distances of flyrock prior to 2010, starting from a paper by Lundborg et al. (1975) has been reviewed in the 18th edition of the Blasters' Handbook (ISEE, 2011). This prior research culminated in the principle of scaled depth of burial (SDoB), which is currently considered the most effective model for estimating the flight distance of flyrock (ISEE, 2011). However, several studies have indicated that flyrock, and the effect of various blasting (causative) parameters on the risk of flyrock in different environments, is still not well understood. These studies recommended that the existing prediction models be reviewed and that the effect of the causative factors on the projection ranges of flyrock should be investigated further, in order to gain an understanding of how these parameters can affect the risk posed by flyrock.
Since 2010, a number of researchers have investigated flyrock and developed new prediction models in an effort to generate accurate predictions relating to the flyrock distance (i.e. the distance the flyrock is thrown from the blast). The purpose of this paper is to summarize and critically analyse these recent studies in order to determine the validity of the findings as a global solution, across all commodities and mining methods. All of these research studies were focused on surface mining operations since flyrock is largely associated with surface blasting activities.
The review of these studies served as a motivation for further work to develop a method to quantify the motion of flyrock, in order to develop a tool to accurately measure flyrock field data. This research is currently being pursued by the Mining Engineering Department at the University of Pretoria.
This paper aims to achieve three main objectives, namely:
1. To emphasise and support the statements made by previous researchers, i.e. that flyrock is a topic that is still not fully understood and that significant gaps in knowledge exist
2. To review the various methodologies, techniques, and technologies that have recently been used to develop flyrock prediction models
3. To investigate and critically analyse the methods of testing or evaluating the proposed prediction models (if the models was evaluated during the studies) and evaluate the conclusions based on the results obtained.
Literature review
Most of the recent work relevant to flyrock has been done since 2010. Research studies conducted before 2010 has been amalgamated in the Blasters' Handbook (ISEE, 2011) and will, therefore, not be reviewed in this paper. Several recent publications on flyrock have proposed models based on one of the following approaches.
1. Artificial Intelligence (AI) principles or techniques.
(a) Artificial neural networks (ANNs).
ANNs are developed in an attempt to imitate human thought processes. An ANN process consists of an input, weights, neurons (where the data is processed), and an output. ANNs are often the backbone of machine learning methodologies and can be combined with other systems such as fuzzy inference (Kukreja, et al., 2016).
(b) Adaptive neuro-fuzzy inference system (ANFIS). An ANFIS is based on the principles of ANN but incorporates the principles of fuzzy logic inference. Therefore, instead of just incorporating the input-output system flow of an ANN, ANFIS combines the ANN and the if-then rules of the fuzzy logic algorithms, allowing the system to model and interpret real-world scenarios (Prakash, 2014).
2. Rock engineering systems (RES).
RES was first introduced by Hudson (1992). Faramarzi, Mansouri, and Farsangi (2014) describe this as an interaction matrix that represents the various relevant parameters and their relationships. The purpose is to reduce the uncertainty in the system by evaluating the interaction of these parameters in order to determine the degree of influence of each parameter on the overall system.
3. Empirical- and statistical analysis. Empirical and statistical analysis have been the foundation of most of the prediction approaches since the 1980s. Lundborg et al. (1975) published one of the first papers that considered an empirical approach in an attempt to predict the maximum throw resulting from a blast. However, due to the vast number of variables and uncertainties that influence flyrock, modelling based on empirical approaches have not been favoured in recent studies.
4. Forensic or ballistics approach.
In terms of the basic principles of physics and natural laws that are accepted globally, flyrock should follow the principles that apply to projectile motion. Flyrock is fragments of rock propelled by a force from an external energy source. The energy exerted on these fragments is converted into kinetic energy, based on the law of conservation of energy.
These studies, categorized according to the authors' approaches, are summarized chronologically beow, in terms of the aim or focus of the researchers and the final outcome of the study.
Flyrock research based on AI principles
Numerous authors have presented concepts and techniques to predict or estimate flyrock or flyrock-related factors using AI principles. The main similarity between these proposed techniques is that the output of the system is highly dependent on the quality of the input parameters and the accuracy of estimation of these parameters. Note that the details pertaining to the algorithms used in these concepts or techniques are not discussed in detail. This section only serves as an overview of the work conducted in an attempt to predict flyrock.
1. Monjezi, Amini Khoshalan, and Yazdian Varjani (2010) used a a neuro-genetic approach to predict flyrock and back-break in open pit blasting operations: The motivation for this study was the poor predictions resulting from the existing empirical models at that time. The authors used a feed-forward ANN (with a 9-16-2 architecture) as the basis for their model and incorporated a genetic algorithm (GA) in an attempt to optimize the network parameters.
The study concluded that the prediction results from the proposed model correlated with the measured flyrock distances. However, the methodology by which these 'actual' flyrock measurements were obtained and the accuracy thereof was not discussed. The neuro-genetic ANN model proved to be superior to the existing empirical and statistical models. Stemming length and powder factor were concluded to be the most influential parameters.
2. Monjezi et al. (2012) developed a model to predict flyrock using a feed-forward ANN with a 9-5-2-1 architecture. The outcomes were compared with thoss from existing empirical and statistical models, and the influential input parameters investigated. The motivation behind this study was the insufficient prediction capabilities of existing models. The input parameters were similar to those used in the aforementioned study. However, since the objective was to identify the influential parameters, some of the parameters were designed to be outputs of the system, along with flyrock.
The study concluded by comparing the predicted flyrock with the measured flyrock. Again, the test methodology followed to obtain these 'actual' flyrock measurements or the accuracy thereof were not discussed. Similar to the 2010 publication, the ANN model was determined to be superior to the existing empirical and statistical models. Finally, the key influential parameters, based on this model, were identified as the powder factor, blast-hole diameter, stemming length, and charge mass per delay.
3. Raina, Murthy, and Soni (2013) investigated the influence of shape on the travel distance of flyrock. The motivation was that kinematic equations can be difficult to apply to flyrock in different environments due to the uncertainty of air resistance based on the weight, size, and shape of a fragment. Air resistance or drag forms an essential component of motion analysis based on kinematic principles and cannot, therefore, be neglected.
The ANN model was made up of a 7-20-14-81 architecture, and was developed based on data collected from 75 test blasts. Seventy-five concrete blocks were blasted with a single hole and varying blast parameters in an attempt to identify the influence of these parameters. The input parameters were the initial velocity of the fragment, launch angle, sphericity, and the weight, length, width, and thickness of the fragment.
The initial velocity, launch angle, and weight of individual fragments were considered key parameters in this investigation. However, it was concluded that these are difficult to estimate in field conditions and further research and investigations were required. The authors noted that the effect of external factors such as the velocity of the air and specific weather conditions should also be investigated to determine their effect on the flyrock travel distance.
4. Ghasemi et al. (2014) applied artificial intelligence techniques for predicting flyrock distance. The aim was to develop and compare two predictive models based on AI concepts. The first model, based on ANN, was a feed-forward network with a 6-9-1 architecture. The second model, based on ANFIS, was described as consisting of 'triangular, trapezoidal membership functions' and was based on a Mamdani algorithm. Both models were presented with six input parameters, i.e. blast-hole length, burden, spacing, stemming length, powder factor, and charge mass per delay. The results showed that both models were able to yield accurate predictions when compared to the measured flyrock distances. This is, however, dependent on the accuracy and reliability of the measurements. Similar to the previous two publications, there is no discussion relating to the measurement methodology. The ANFIS method proved to be the better, but the ANN still produced accepted results and was concluded to be a 'good tool to minimize uncertainties' (Ghasemi et al., 2014).
5. Marto et al. (2014) conducted a study on blast-induced flyrock prediction based on an imperialist competitive algorithm (ICA) and artificial neural network. The main objective was to predict flyrock by combining ANNs and ICA to produce a novel ICA-ANN prediction model. Seven input parameters were identified and determined to be influential to the system. These parameters are the blast-hole depth, burden-to-spacing ratio, stemming length, maximum charge mass per delay, powder factor, rock density, and the Schmidt hammer rebound number. The data from 113 blasts was recorded and the flyrock measured, but no discussion on the measurement methodology was presented. Predictions were first evaluated against the measured flyrock. The results from the developed ICA-ANN model were compared to that of other pre-developed ANN models and multiple regression analysis (MRA) results.
The proposed ICA-ANN model did yield a tighter scatter of data-points, which implies that it presents an improved prediction capability compared to the other models. Marto et al. (2014) concluded their study by stressing that the models are dependent on the accuracy of the input parameters.
6. Trivedi, Singh, and Gupta (2016) used to predict flyrock using ANN and ANFIS approaches to predict flyrock. The same input parameters were used for both approaches, namely linear charge mass, burden, stemming length, specific charge, unconfined compressive strength, and rock quality. The proposed models were evaluated with data from 125 blasts. As in the previous publications, the predictions from the proposed models were evaluated against the measured flyrock. The authors conducted visual observations of the blast and measured the landing positions of the fragments with a hand-held GPS. High-speed cameras were used to record the blasts and estimate parameters such as initial velocities and launch angles. The authors concluded that the ANFIS approach produced better results than the ANN model.
7. Armaghani et al. (2016a) proposed a method to predict flyrock using an empirical approach. The motivation for conducting this study was that existing empirical models are not adequate due to the complex nature of flyrock. ANN and ANFIS models were also developed in an attempt to reduce the uncertainties and solve the complex nonlinear functions derived by an empirical approach.
Two empirical formulae were presented that have been published. However, these empirical equations are often site-specific and cannot be used as a universal prediction model.
The authors developed an empirical graph using the maximum charge per delay and powder factor as the two main influential parameters. This study also concluded that AI techniques, such as ANN and ANFIS, are superior for developing a prediction model.
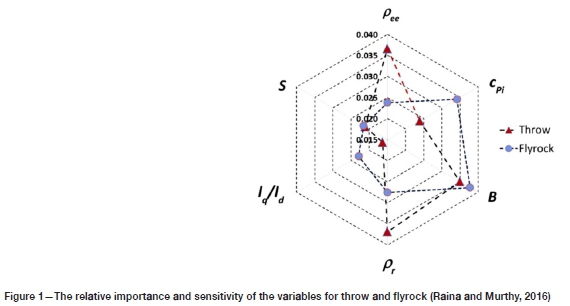
8. Raina and Murthy (2016) presented a study based on the ANN method' with the aim of identifying the significance of different parameters in flyrock prediction. Blast data was collected from ten mines and analysed by means of ANN software, EasyNN-Plus©, in order to design, train, and validate a suitable ANN model. A feed-forward ANN model with a 20-16-6-4-1 architecture was suggested as an optimized network. The key input parameters for this model were identified as burden (B), spacing (S), P-wave (primary wave) velocity (cpi), the density of the rock (pr), the effective in-hole density of the explosives (pee), and the charge length to hole depth ratio (lq/ld).
The study concluded with a spider graph illustrating the relative importance and sensitivity of the various input parameters. This graph is reproduced in Figure 1.
The main conclusion drawn from the above investigations is that implementing AI principles in prediction models yields improved results compared to existing empirical models. However, it is very important to note that all the aforementioned ANN or ANFIS models are highly dependent on the quality and accuracy of the input parameters.
The methodologies followed to measure the actual flyrock distance are not elaborated on in any of the publications. Since each proposed method was evaluated against these measurements, some of the results and conclusions come into question, owing to the uncertainty regarding the accuracy of these measurements.
Flyrock research based on rock engineering principles
Faramarzi, Mansouri, and Farsangi (2014) describe this as an interaction matrix that represents the various relevant parameters and their relationships. Hudson (2014) mentions that the effective parameters that drives specific circumstances are selected and the interactions between these parameters are considered in the matrix. The purpose is to reduce the uncertainty in the system by evaluating the interaction of these parameters and determining the degree of influence of each parameter on the overall system.
This degree of influence of each parameter is described by allocating weights, also known as coding, to the matrix. This can ultimately be used to derive a cause-and-effect graph from the system. Additional detail regarding RES is outside the scope of this project; however, this approach may hold some potential for minimizing the uncertainties relating to flyrock and flyrock prediction.
Only one publication (Faramarzi, Mansouri, and Farsangi, (2014) could be identified that implements this method to predict flyrock risk. The authors used data from 57 blasts and applied 13 input parameters - the burden, maximum instantaneous charge, powder factor, spacing-to-burden ratio, stemming-to-burden ratio, stiffness factor, time delay, blast-hole diameter, the velocity of detonation (VoD), blast-hole deviation, burden-to-hole diameter ratio, and RMR. Most of these parameters were measured on the bench with a measuring tape.
Flyrock travel distance was the only output of the system. The distances were measured after each blast and used to evaluate the performance of the proposed RES. Faramarzi, Mansouri, and Farsangi (2014) described the measuring methodology as properly cleaning the mine area prior to the blast, visually observing the flight path of the rock fragments, and measuring the landing positions with a hand-held GPS.
The authors concluded that the RES methodology is superior to other methods such as the multivariable regression analysis, and has better predictive capability. However, similar to most of the proposed predictive models, the RES model presented in this study was site-specific and cannot be used as a general solution.
Flyrock research based on empirical and statistical analysis
Empirical and statistical analysis have been the foundation of most of the prediction approaches since the 1980s. Lundborg (1975) published one of the first papers that considered an empirical approach in an attempt to predict the maximum throw resulting from a blast. However, due to the vast number of variables and uncertainties that influence flyrock, modelling based on empirical approaches has not been favoured in recent studies, although some researchers still conduct studies based on this approach.
Empirical and statistical approaches to develop flyrock prediction models have been proposed since the early 1980s. However, due to the significant progress in technology over the past two decades, only recent concepts and techniques proposed (publications from 2010) are summarized for the purpose of this review.
1. Ghasemi et al. (2012) described the development of an empirical model for predicting the effects of controllable blasting parameters on flyrock distance. The authors used data from 150 blasts and analysed this data by means of a dimensional approach. The large data-set presented the advantage of improving the overall accuracy of the system. However, all of the blasts were from a single mining operation and the results of this study can be considered to be very site-specific.
The data collected formed the input parameters to the dimensional analysis and included the burden (B), spacing (S), stemming length (St), blast-hole length (H) and diameter (D), powder factor (P), and mean charge mass per delay (Q). These input parameters were measured on the bench using a measuring tape.
The flyrock distances were also measured as evaluation criteria for the proposed model. The measurement data was acquired through visually observing the flyrock thrown from a blast and measuring the landing positions with a hand-held GPS. The fragments that were thrown the farthest distance from the blast were found to be 10 cm in diameter.
Ghasem, et al. (2012) proposed a model based on the assumptions that the influential parameters discussed above, resulting in a flyrock function:
Flyrock distance (Fd) = ƒ (B, S, St, H, D, P, Q)
This function resulted in the following empirical formula:
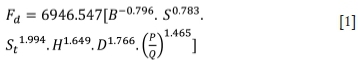
with
B = burden
S = Spacing
St = Stemming length
H = Blast-hole length
D = Blast-hole diameter
P = Powder factor
Q = Mean charge mass per delay
It is important that, again, this model is very site-specific. The validity of this equation was evaluated by means of Monte Carlo simulation. However, the authors noted that the validity of this prediction model depends on the range of the data and the quality of the samples and measurements taken.
Ghasemi et al. (2012) concluded by stating that, based on the sensitivity analysis, the stemming length, spacing, blast-hole length and diameter, and the powder factor showed a direct relationship to the flyrock distance, whereas, the burden and mean charge mass per delay showed an indirect relationship to flyrock distance. This was a counter-intuitive result since it would be logical to assume that burden and charge mass per delay would directly influence the distance travelled by rock fragments (Ghasemi et al., 2012). This may indicate a flaw in the proposed system.
2. Armaghani et al. (2016b) conducted a study that combined multiple regression analysis (MRA) and Monte Carlo simulations of quarry blasting'. The main purpose was to develop a prediction model based on MRA and simulate flyrock using Monte Carlo (or probability) simulations.
The study utilized data from 62 blasts. The input parameters, consisting of the burden (B), spacing (S), stemming length (ST), blast-hole depth (HD), maximum charge mass per delay (MC), the powder factor (PF) and rock mass rating (RMR) were measured by means of a measuring tape. As in the study summarized previously, the flyrock was measured by cleaning the blast area prior to the blast, visually observing the flyrock thrown from the blast, and recording the landing positions with a handheld GPS.
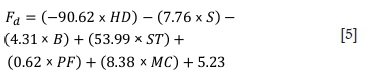
In order to run simulations of flyrock using Monte Carlo simulations, an empirical equation is required to describe the relationship between the input parameters and the output. Armaghan, et al. (2016b) therefore used software (SPSS, version 16) to generate this empirical equation, based on MRA. The resulting equation is:
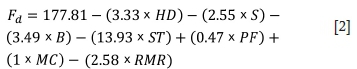
with
Fd= Flyrock distance
B = Burden
S = Spacing
ST = Stemming length
HD = Blast-hole depth
MC = Maximum charge mass per delay
PF = Powder factor
RMR = Rock mass rating
The primary goal of the Monte Carlo simulations was to quantitatively determine the uncertainties and variabilities when exposed to certain risks. The secondary goal was to investigate the major drivers of this uncertainty and variability (Armaghani et al., 2016b).
The results of this study favour the empirical equation based on MRA above previously published empirical models. The Monte Carlo simulations presented promising results, although the credibility of these results is highly dependent on the quality of the input parameters. The authors concluded that the powder factor was the most influential parameter. It is important to note that, similar to the previously proposed models, this model remains site-specific and is not a generalized solution.
3. Dehghani and Shafaghi (2017) attempted to address the inadequate predictive capability of existing empirical models by using a combination of differential evaluation (DE) and dimensional analysis (DA) algorithms. DA is defined as an engineering method that is used to create equations that will satisfy the analysis of complex multivariable systems. DE is defined as an optimization algorithm based on the evolution strategy of individuals in a population
The methodology involved collecting data from 300 blasts and measuring and recording both the input parameters and the resulting flyrock. The input parameters considered were the blast-hole diameter (D) and length (L), number of blast-holes (NB), spacing (S), burden (B), ANFO charge mass (Q), stemming length (St), powder factor (PF) and specific drilling (SD) (Dehghani and Shafaghi, 2017). Data was collected in the same manner as in the studies discussed previously.
The resulting equation obtained from DA is:
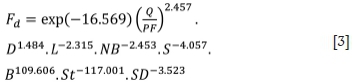
With
Fd= Flyrock distance
D = Blast-hole diameter
L = Blast-hole length
NB = Number of blast-holes
S = Spacing
B = Burden
Q = ANFO charge mass
St = Stemming length
PF = Powder factor
SD = Specific drilling
The relatioship obtained from DE is presented in Equation [4].
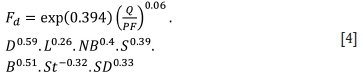
With
Fd= Flyrock distance
D = Blast-hole diameter
L = Blast-hole length
NB = Number of blast-holes
S = Spacing
B = Burden
Q = ANFO charge mass
St = Stemming length
PF = Powder factor
SD = Specific drilling
Both of these equations are site-specific.
Dehghani and Shafaghi (2017) concluded that the DE equation yielded more accurate results than the DA equation. A sensitivity analysis showed that the powder factor and stemming length were the most influential parameters in both models. The authors recommended further research to investigate the principles of physics, incorporation of the pressure measured in the rock, trajectory in the air, and the influence of fragment size and shape on the travelling distance.
4. Hasanipanah (2017) used a regression tree technique to develop a model for prediction of blast-induced flyrock. The regression tree technique is broadly defined as a simple and understandable structure for decision-making. Data was collected from 65 blasts, with the important parameters being blast-hole length (HD), spacing (S), burden (B), stemming length (ST), maximum charge mass per delay (MC), and the powder factor (PF). The input parameters and the output (flyrock distance) were measured in a similar way to previous studies.
The developed regression tree model consisted of 52 nodes, with the powder factor as the root node. A multiple linear regression (MLR) model was also created, using SPSS (version 16) software, in order to conduct a brief comparative analysis between the performance of both models. The equation created during the development of the MLR model is:
with
Fd= Flyrock distance
HD = Blast-hole diameter
S = Spacing
B = Burden
ST = Stemming length
PF = Powder factor
MC = Maximum charge mass per delay
Hasanipanah (2017) concluded that the regression tree model produced more accurate predictions compared to the MLR model, but both models were able to predict flyrock travelling distance. A sensitivity analysis of the models showed that the powder factor and the burden were the most influential parameters.
In each of the publication summarized, it is emphasised that the proposed models are site-specific and cannot be used as universal models. The important thing to notice is that the empirical equations presented differ significantly. This could be due to the site-specific input parameters used in each model; however, it does bring into question the validity of the proposed models.
Flyrock research based on ballistics principles
According to the fundamentals of physics, the same principles that describe projectile motion should be applicable to flyrock. Flyrock is fragments of rock propelled by a force from an external energy source. The energy exerted on these rock fragments is converted into kinetic energy, based on the law of Conservation of Energy. As stated in Newton's Second Law of Motion, the fragment maintains its motion unless it is subjected to an external force. Therefore, a system based on physics or a ballistics approach may possess the potential to accurately estimate flyrock distance.
Three consecutive articles were published from 2011 to 2015 by research teams led by Sasa Stojadinovic', driven by the need to develop a prediction model based on forensic analysis. Stojadinovic', Pantovic', and Zikic' (2011) stressed that the scaled depth of burial (SDoB) approach of estimating flyrock behaviour is favoured across the mining industry, but it applies only to normal or expected flyrock. 'Wild' or unexpected flyrock due to bad blasting practices or unexpected geological factors was never considered and requires a forensic analysis.
These three articles are summarized chronologically.
1. Stojadinovic', Pantovic', and Zikic' (2011 published the first article in the series, titled 'Prediction of flyrock trajectories for forensic applications using ballistic flight equations'. The objective was to develop a method of determining the maximum throw of flyrock in order to estimate safe distances.
Flyrock was considered to be a projectile (Figure 2), allowing the investigators to derive a numerical solution from ballistics flight principles (also known as projectile motion principles).
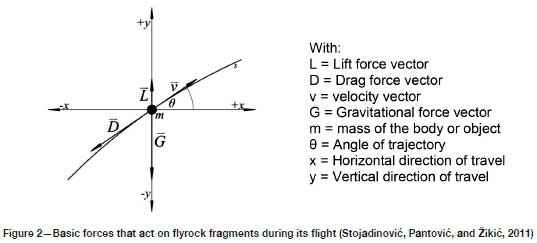
This numerical solution is presented for motion in the x- and y-directions and is given in Equations [6] and [7] respectively.
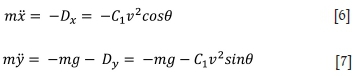
with
x = acceleration in the x -direction (m/s2)
y = acceleration in the y -direction (m/s2)
C1 = a constant equal to the product of the density of air, the cross-sectional area of the projectile, and the drag coefficient (Pair.A.CD)
v = velocity of the projectile (m/s)
θ = angle between the velocity vector and the horizontal axis (degree or °)
m = mass of the projectile (kg)
g = gravitational force (N)
Data was collected from a mining operation using the blast design and bench conditions as input parameters. The flyrock (output) was measured by means of visual observation of the blast, measuring landing positions, and recording damage to surrounding structures and equipment (Stojadinovic', Pantovic', and Zikic' 2011).
The assumptions applied to this analysis were:
> A launch angle of 45° reults in a maximum throw
> Launch velocity was calculated based on an equation presented by past publications.
According to the equations, the launch velocities are dependent on the size of the fragment, and ranged from 55 m/s for a 0.5m diameter fragment to 150 m/s for a 0.05 m diameter fragment.
Stojadinovic', Pantovic', and Zikic' (2011) concluded that this forensic approach is better suited for post-incident analysis since the results are highly dependent on the accuracy of the input parameters, such as actual launch velocity and launch angle. In a final comment, the authors noted that aerodynamic drag has a crucial influence on the trajectory and overall motion of flyrock fragments. Therefore, further research is required for incorporating an accurate drag coefficient into the equations.
A key aspect of the conclusion of this article is a discussion of the relationship between the size of a fragment and the drag force exerted on it. Stojadinovic', Pantovic', and Zikic' (2011) stressed that the acceleration of the fragment is dependent on the drag and the mass of the fragment, and the drag is dependent on the cross-sectional area of the fragment and its velocity squared. However,, the acceleration is also inversely dependent on the mass of the fragment, due to its inertia. Therefore, a smaller fragment with a smaller cross-sectional area and higher velocity will experience a larger drag force and, due to its smaller mass, will not be able to overcome these drag forces. This means that smaller fragments will not travel long distances (Stojadinovic', Pantovic', and Zikic' 2011). Larger fragments, with more mass, have the potential to overcome the drag forces and travel further. However, lower travel velocities will also limit the travel distance. It can, therefore, be assumed that there is an ideal fragment size that can travel the maximum distance, which is the focus of most of the studies conducted.
2. In 2013, Stojadinovic' et al. published a sequel article describing a new model for determining flyrock drag coefficient. By comparing previous prediction models proposed throughout the years, the authors argued that implementing ballistics principles to predict flyrock is the most precise approach. However, the drag exerted on the rock fragments plays a significant role in the total travelling distance of the fragments. The main objective of this study was, therefore, to improve the ballistic approach by increasing the accuracy of the drag coefficient estimate.
From the previous article (2011), Stojadinovic' et al. (2013) deduced the following:
> The fragments that will travel the maximum distance range between 20 cm and 35 cm in diameter.
> Launch velocity is the most influential factor to be considered in a ballistics approach, and can be up to 150 m/s. Launch velocities of 350 m/s and 430 m/s have been recorded but, according to the final argument in the previous article, the maximum recorded launch velocity would not result in the maximum travel distance.
> The launch angle resulting in maximum throw ranges from 35° to 43°, taking the effect of drag into account.
Initially, it was planned to use a wind tunnel to evaluate the drag forces, but this idea was abandoned due to the complicated procedure involved (Stojadinovic' et al., 2013). Therefore, the the blast was recorded with high-speed cameras (480 χ 360 resolution). The known blast design parameters in the footage were used as control points and equipment in the field of view was used as scaling items (Stojadinovic' et al., 2013).
The video footage was divided into individual frames and imported into CAD software in order to analyse the flyrock motion. The exact measuring technique is not discussed in the article. A key problem with this methodology was that the image quality was extremely poor, especially when magnified. The authors decided to measure the estimated centre points of the pixelated clouds thought to be the rock fragments. The initial purpose of this technique was to gather data on the launch velocity of the flyrock. However, the data could be used for the purpose of this study as well (Stojadinovic' et al., 2013).
The drag coefficient was calculated by analysing the movement of the fragment at terminal velocity. The main problems experienced by the research team were determining the size and trajectories of the individual fragments (Stojadinovic' et al., 2013).
The equations presented in the 2011 paper were used to test the results, using the following initial conditions for a vertical shot:
> t0= 0 seconds
> v0= 200 m/s
> θ 0 = 90°.
A vertical shot was considered since it was the most likely situation in which to measure a fragment's motion at terminal velocity.
The final expectation was that the same, or a similar, drag coefficient would have been calculated for different rock fragments. However, this was not the case. The drag coefficient results did not yield a unique value. This could have been due to the influence of the shape of the fragment (Stojadinovic' et al., 2013). Measurement error could also have contributed to the unexpected results, due to the poor quality of the images.
Stojadinovic' et al. (2013) concluded that since the drag coefficient is a very important input parameter to the ballistics equations, this drag coefficient should vary with changes in launch angle and fragment size.
3. The final article in this series was published in 2015. The motivation behind this study (Stojadinovic' et al., 2015) was that most prediction models require an accurate launch velocity as a key input. All of the previously proposed models are highly dependent on the quality and accuracy of the input parameters. The main objective was, therefore, to develop an adaptive system application capable of predicting the launch velocities of flyrock.
Data was collected from a total of 36 blasts at three mining operations. The methodology followed for measuring and recording the input parameters as well as the output (flyrock) was the same as in Stojadinovic' et al., 2013). The input parameters considered were divided into technical and natural parameters.
> Technical input parameters:
• Blast-hole diameter, length, and inclination
• Stemming length
• Stemming factor
• Specific stemming
• Burden
• Spacing
• Volume of rock broken per blast-hole
• Inter-hole delay;
• Number of free faces
• Charge mass per delay
• Powder factor;
• Explosives density
• Velocity of detonation
• Volume of gaseous products of detonation.
> Natural input parameters:
• Rock density
• Compressive and tensile strength
• Presence of groundwater.
An ANN model with a 19-8-6-1 architecture was developed using a Peltarion synapse, described as a fuzzy algorithm for used optimization (Stojadinovic' et al., 2015). The predictor that formed part of this system demonstrated the potential for predicting the initial velocity of flyrock fragments. However, Stojadinovic' et al. (2015) emphasised that the predictor in this system was only a concept and not fully developed. The authors concluded that this was due to the similar geology at the three mining sites, resulting in a lack of diversity in the data. They stated that this lack should be viewed as an opportunity for future research towards the ultimate goal of developing a universal prediction model.
Critical analysis of recent studies in the literature review
Several prediction models have been proposed in recent research studies based on various techniques. However, all these studies concluded that the respective models are primarily site-specific. Based on the the techniques used to develop the prediction models, the accuracy and reliability of the results are highly dependent on the quality and accuracy of the input parameters, as well as the postulated effect of these input parameters on the desired output (i.e. the weighting assigned to any input parameter in a model).
The following analysis is structured to address the three objectives of this paper. The first analysis emphasises the gap in knowledge and understanding of the flyrock phenomena by considering the most recent research in the field (i.e. objectives 1 and 2). Note that the aim of this first phase of analysis is not to evaluate the accuracy of the models. The second analysis is focused on evaluating the techniques used to assess the accuracy of the prediction results from each of the proposed models (objective 3).
Analysis and evaluation of the recent flyrock prediction methodologies
The first phase of this analysis is aimed at achieving the first two objectives stated at the beginning of this paper, and was conducted according to three distinct aspects, namely:
1. The approach or technique implemented to generate or develop a result
2. The input parameters considered in each study's model or solution
3. The factors or blast parameters that were assumed to be the most influential or primary causative parameter(s) of the proposed models.
The different techniques used to develop flyrock prediction models in recent research studies are summarized in Figure 3, which shows that AI techniques have been most favoured, followed by empirical and ballistics approaches.
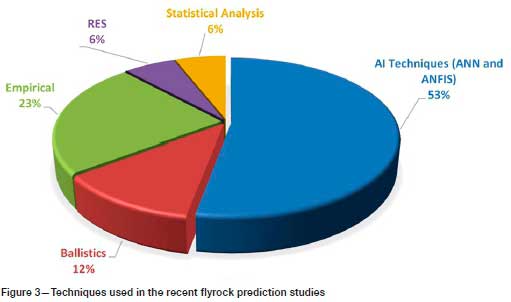
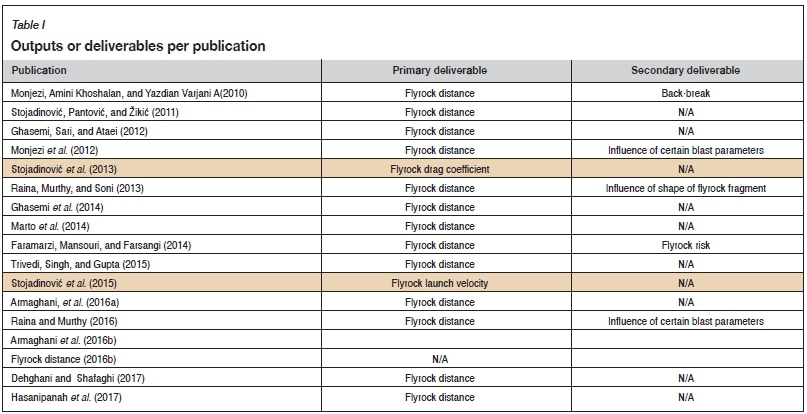
However, it is important to note that not all of these models were created with the view of estimating flyrock distance as the primary output (Table I).
Two publications (highlighted in Table I) focused more on determining or estimating contiguous parameters, but was considered in this review since the research still related to flyrock and flyrock prediction. The related two models are not considered in the following analysis; however, some key information can still be deduced.
Empirical techniques
Empirical approaches have been proposed since the early 1980s, but recent empirical approaches have still proven to be inadequate. Empirical models tend to be very site-specific, taking into consideration variables specific to the site geology and blast design. These models cannot, therefore, be used as a generic approach to predicting flyrock.
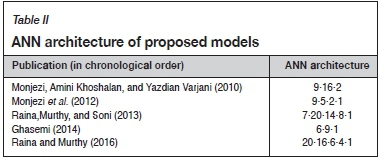
AI techniques
ANN and other AI concepts have proven effective in minimizing the uncertainties related to flyrock. However, it is apparent that the architecture of these models has evolved significantly with time (Table II). These networks have become increasingly complex, i.e. taking more input parameters into account and processing them over more hidden layers. This indicates that there still are several uncertainties related to flyrock, as well as which blast parameters directly influence the risk of flyrock and to what degree.
Finally, the ANN prediction models are highly dependent on the input parameters and their estimated influence on the desired output (Fd). Considering the level of uncertainty regarding these input parameters and how much they contribute to flyrock behavious, some errors can be expected in these models. The testing methodology applied by researchers now becomes critical in order to determine what these error(s) are and the magnitude(s) thereof.
Ballistics principles:
The application of ballistics to flyrock prediction may not be an ideal solution due to the varying environments; however, it presents exciting new opportunities. An object, in this case a fragment of rock, moving through the air will behave according to Newton's three Laws of Motion. The established ballistics formulae are based on these laws. Ballistics should, therefore, be a viable and accurate method of analysing the motion of flyrock.
There are some pertinent considerations put forward in the studies incorporating ballistics concepts (Stojadinovic', Pantovic, and Zikic' 2011; Stojadinovic' et al., 2013, 2015), namely:
> The influence of drag or air resistance is significant but is often neglected.
> The effect of the shape of the fragment on the drag force experienced is unknown.
> The influence of external factors such as weather conditions has not been investigated.
> The fragments that will likely travel the furthest distance (i.e. small enough to experience a large launch velocity but big enough to overcome some of the drag force) range between 10 cm and 35 cm in diameter.
> The launch angle that will allow a fragment to travel a maximum distance is not 45°, as would be expected, but rather ranges between 35° and 43° when taking the drag force into account.
Parameters considered as causative inputs to the proposed models
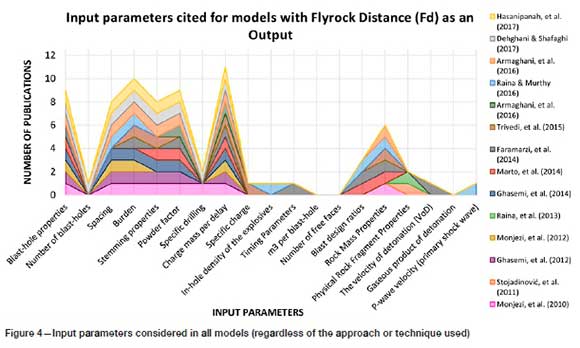
The input parameters considered in the publications are noticeably variable (Figure 4), while some remain consistent when similar techniques are applied (see Figures 5-8). Some of the input parameters are considered in most of the publications, while others are unique to specific studies. Charge mass per delay, powder factor, burden, spacing, stemming, and blast-hole properties are the most popular input parameters.
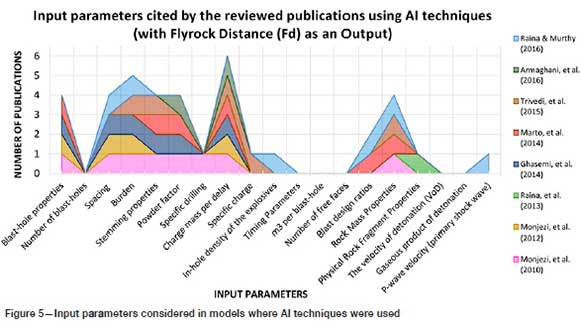
Referring to Figure 5, it is evident that most of the ANN models incorporate similar causative factors, although some models do include unique inputs. The models developed from AI techniques incorporate more inputs than those in the other approaches. Since it is still uncertain which blast parameters contribute to flyrock and to what degree, it is always beneficial to consider as many parameters as possible. However, the influence (or weight) assigned to each of these parameters is not described in all of the proposed models and cannot, therefore, be analysed or commented on.
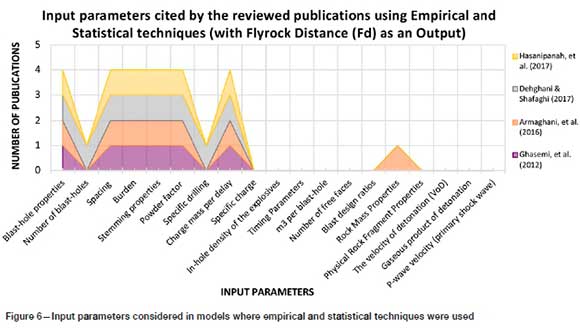
The inputs considered in the models based on empirical and statistical techniques are summarized in Figure 6. It is evident that, similar to the ANN models, various authors considered similar input parameters. This may be due to the use of similar background formulae or algorithms to build the models. However, the number of inputs is distinctly less that the number of inputs in the ANN models.
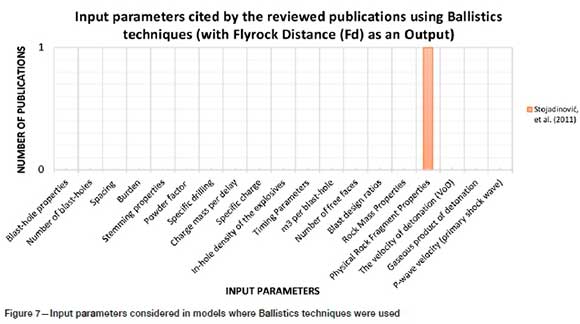
Three of the publications reviewed were based on ballistics principles, but only one focused on flyrock travel distance as its primary output. Therefore, only the input parameters considered in this single paper are summarized in Figure 7.
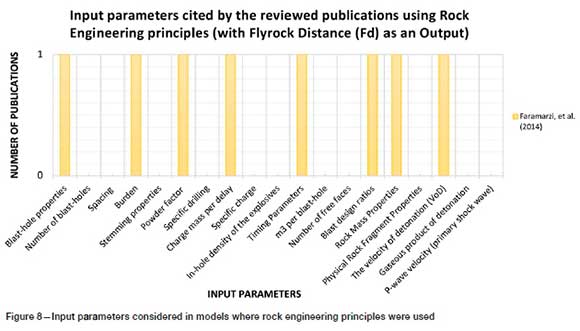
Similar to the ballistics approach, only one publication developed a model based on rock engineering principles. The input parameters for this model are summarized in Figure 8. Compared to the previous two graphs, the author considered more input parameters. It is also important to emphasise that this model also includes unique inputs such as the velocity of detonation (VoD).
From these graphical summaries of the various inputs considered in the recent proposed flyrock prediction models, it seems that there are some parameters that are accepted as being causative to flyrock. However, the variability between the prediction models using similar techniques, the additions of parameters unique to some models, and the assumed influence of each parameter on the desired output illustrate that the impact of various factors on flyrock behaviour is not an exact science. It will, therefore, be very difficult to apply a single model to multiple environments with the existing body of knowledge relating to flyrock.
Key influential parameters
In most of these studies, a sensitivity analysis was conducted to identify the most influential or significant input parameter(s), based on the proposed model. These parameters are summarized in Figure 9. It is important to note that due to differences in the input parameters between the models, the sensitivity analyses and, therefore, the most influential parameters, may be indicated as outliers in Figure 9. This is only intended as an overview of which parameters are interpreted as essential by the authors of the papers.
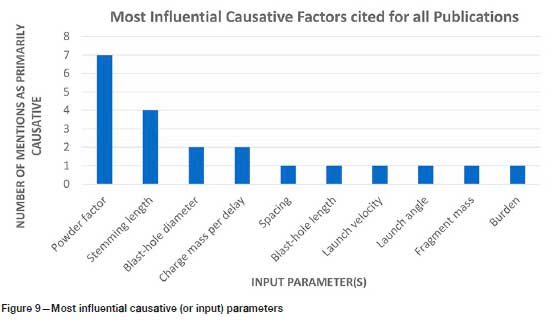
Based on Figure 9, the powder factor and stemming length seem to be the key parameters relating to flyrock, which is what one would expect. However, the burden is not highlighted as a critical parameter, which is contradictory to the face burst mechanism of flyrock. This summary of the fundamental causative parameters and the disregarding of the importance of burden also support the argument that the effect of blast parameters on flyrock is not fully known or understood.
Considering the recent work conducted in flyrock prediction or investigating the effect of certain parameters on flyrock travel distance, it can be concluded that implementing ballistics principles to analyse flyrock motion is the best method to understand flyrock behaviour. However, a lot of uncertainty exists in terms of how external forces, such as drag, impact the travelling distance of flyrock. The effect of the shape of a fragment on the drag force, as well as the effect of various weather conditions, can be investigated through wind tunnel tests.
ANN and ANFIS approaches hold significant potential for further refining (i.e. minimizing the related uncertainties) of a flyrock prediction model. However, the impact and relevance of the input parameters must be estimated accurately in order to achieve accurate predictions.
Analysis of the testing methods used to evaluate the output results for each prediction model
It is essential that any model or prototype be thoroughly tested.
The test results are assessed by (as a minimum) comparing them to baseline data or 'actual' measurements. The purpose of this second phase of analysis is to critically analyse the testing methodologies used in the recent publications, which allowed the authors to draw conclusions regarding the efficiency and accuracy of the proposed models.
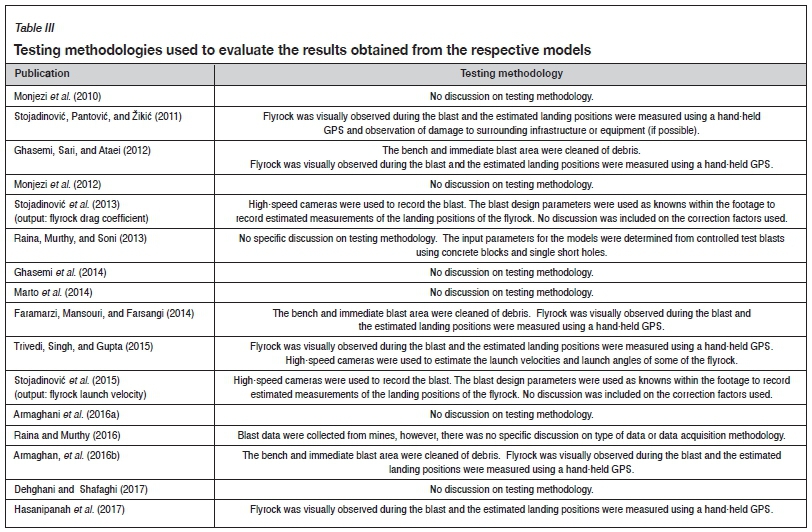
Unfortunately, most of the publications did not include a discussion on the testing methodologies used to acquire baseline or actual data. Only the testing methodologies discussed in the publications are analysed. The testing methodologies are summarized in Table III.
Visual observation of the blast and the resulting flyrock were the most popular methods used to collect 'actual' field data. The 'actual' flyrock distances (Fd) were measured by estimating the landing positions of some of the fragments through visual observation. These estimated landing positions were then measured using a hand-held GPS device. Even though this methodology may seem to be sufficient, it may not be the most scientific approach and the data acquired may be prone to error.
The subjectivity of the visual observation of flyrock trajectory may result in different researchers interpreting the landing positions differently. Visual observation can refer to video recordings of the blast or simple observation by eye. At increased distances form the blast, the error in visual estimation may increase significantly. To increase the accuracy of visual estimation some form of scale or control should be included within the observer's field of view. Two publications referred to the controls used in the respective test methodologies as the known blast design parameters visible, i.e. the burden and spacing. However, no discussions were included describing the correction factors considered (if any) relating to the different in visual planes, distances to the respective targets, influences of different lighting, etc.
An additional error should also be expected from the handheld GPS device. These devices are not used by professional surveyors due to the error associated with the measurements, but are designed to give approximate coordinates or locations. Some of these hand-held GPS devices can include errors ranging from 5 m to 10 m in the x, y, and zdirections (Hussein, 2016).
Considering the cumulative errors from both the subjective estimation of the flyrock landing positions and the inherent error associated with hand-held GPS devices, the actual measurements against which the proposed models were evaluated may deviate significantly from the real positions.
In three publications, the researchers included high-speed photography in the testing methodologies. However, these publications did not aim to investigate flyrock distances, but rather the launch velocity of fragments and the drag coefficients. The use of high-speed photography cannot, therefore, be analysed in terms of evaluating the flyrock travel distances.
Conclusion
Several authors have proposed viable models for predicting and analysing flyrock based on assumed causative parameters as inputs and their impact on flyrock as weights assigned to each input. However, all of these papers concluded that the respective models were site-specific and could not be applied to other environments.
Since the actual impact of blast design parameters on the risk of flyrock is debatable, based on the variable assumptions made in these publications, it can be concluded that flyrock is still not well understood. The biggest gap in knowledge seem to be the uncertainties concerning which blast and environmental parameter contribute to flyrock, and to what degree. These uncertainties open an opportunity for developing new models for analysing the flyrock when it occurs, rather than predicting it beforehand.
The techniques used to measure the actual distance travelled by the rock fragments (flyrock) in these studies are subjective and highly dependent on the scrutiny of the researcher. Obtaining objective data is critical in any investigation. Since the results of the proposed models were evaluated by comparing the predicted and measured (or actual) data, some margin of error can be expected from the findings, based on the transferred error from the testing methodology.
In order to present results that are objective and uncriticizable; an accurate, quantitative, and objective method of measuring the actual travel distance of flyrock is required. The main recommendation from this study is that the potential for developing such a measuring tool, which will yield unbiased field data, be investigated. Such a tool can be used to evaluate the results from existing and future flyrock prediction models.
Acknowledgement
This work was carried out under the auspices of the AELMS Chair in Innovative Rock Breaking Technology and Visualising of New Results using Virtual Reality at the Mining Engineering Department of the University of Pretoria. The authors would like to specifically acknowledge AECI Mining Explosives (formerly known as African Explosives Limited or AEL) for their continued support throughout this study.
References
Armaghani, D.J., ToNNizAM, E., Hajihassani, M., and Abad, S.V.A.N.K. 2016a. Evaluation and prediction of flyrock resulting from blasting operation using empirical and computational methods. Engineering with Computers, vol. 32, no. 1. pp. 109-121. [ Links ]
Armaghani, D.J., Mahdiyar, A., Hasanipanah, M., and Faradonbeh, R.S. 2016b. Risk assessment and prediction of flyrock distance by combined multiple regression analysis and Monte Carlo simulation of quarry blasting. Rock Mechanics and Rock Engineering, vol. 49, no. 9. pp. 3631-3641. [ Links ]
Bajpayee, T.S., Bhatt, S.K, Rehak, T.R., Mowrey, G.L., and Ingram, D.K. 2003. Fatal accidents due to flyrock and lack of blast area security and working practices in mining. Journal of Mines, Metals and Fuels, vol. 51, no. 11/12. pp. 344-350. [ Links ]
Dehghani, H. and Shafaghi, M. 2017. Prediction of blast-induced flyrock using differential evolution algorithm. Engineering with Computers, vol. 33, no. 1. pp. 149-158. [ Links ]
Faramarzi, f., Mansouri, H., and Farsangi, M.A. 2014. Development of rock engineering systems-based models for flyrock risk analysis and prediction of flyrock distance in surface blasting. Rock Mechanics and Rock Engineering, vol. 47, no. 4. pp. 1291-1306. [ Links ]
Ghasemi, E., Amini, H., Ataei, M., and Khalokakaei, R. 2014. Application of artificial intelligence techniques for predicting the flyrock distance caused by blasting operation. Arabian Journal of Geosciences, vol. 7, no. 1. pp. 193-202. [ Links ]
Ghasemi, E., Sari, M., and Ataei, M. 2012. Development of an empirical model for predicting the effects of controllable blasting parameters on flyrock distance in surface mines. International Journal of Rock Mechanics and Mining Sciences, vol. 52. pp. 163-170. [ Links ]
Hasanipanah, M., Faradonbeh, R.S., Armaghani, D.J., and Amnieh, H.B. 2017. Development of a precise model for prediction of blast-induced flyrock using regression tree technique. Environmental Earth Sciences, vol. 76. p. 27 (10). [ Links ]
Hudson, J.A. 1992. Rock Engineering Systems: Theory and Practice. Ellis Horwood, Chichester. [ Links ]
Hudson, J.A. 2014. A review of Rock Engineering Systems (RES) applications over the last 20 years. Rock Characterisation, Modelling and Engineering Design Methods. Feng, X., Hudson, J. A., and Tan, F., (eds). . Ellis Horwood, Chichester: pp. 419-424. [ Links ]
Hussein, z.E. 2016. Improving the accuracy of handheld GPS receivers based on NMEA file . Journal of Engineering, vol. 22, no. 5. pp. 162-174. [ Links ]
ISEE, 2011. Flyrock. Blasters' Handbook. Stiehr, J.F. (ed.). International Society of Explosives Engineers, Cleveland, OH, Chapter 15: pp. 383-410. [ Links ]
Kukreja, H., Bharath, N., Siddesh, C.S., and Kuldeep, S. 2016. An introduction to artificial neural network. International Journal of Advance Research and Innovative Ideas in Education, vol. 1, no. 5. pp. 27-30. [ Links ]
Lundborg, N., Persson, P. A., Ladegaard-Pedersen, A., and Holmberg, R. 1975. Keeping the lid on flyrock in open-pit blasting. Engineering and Mining Journal, vol. 176. pp. 95-100. [ Links ]
Marto, A., Hajihassani, M., Armaghani, D.J., Mohamad, E.T., and Makhtar, A.M. 2014. A novel approach for blast-induced flyrock prediction based on imperialist competitive algorithm and artificial neural network. The Scientific World Journal, vol. 5. doi: 10.1155/2014/643715 [ Links ]
Monjezi, M., Amini Khoshalan, H., and Yazdian Varjani, A. 2010. Prediction of flyrock and backbreak in open pit blasting operation: a neuro-genetic approach. Arabian Journal of Geosciences, vol. 5, no. 3. pp. 441-448. [ Links ]
Monjezi, M., Mehrdanesh, A., Malek, A., and Khandelwal, M. 2012. Evaluation of effect of blast design parameters on flyrock using artificial neural networks. Neural Computing and Applications, vol. 23, no. 2. pp. 349-356. [ Links ]
Prakash, A. 2014. ANFIS (Adaptive Neural Fuzzy Inference Systems). [interview] 14 September 2014. [ Links ]
Raina, A.K. and Murthy, V.M.S.R. 2016. Importance and sensitivity of variables defining throw and flyrock in surface blasting by artificial neural network method. Current Science, vol. 111, no. 9. pp. 1524-1531. [ Links ]
Raina, A.K., Murthy, V.M.S.R., and Soni, A.K. 2013. Relevance of shape of fragments on flyrock travel distance: An insight from concrete model experiments using ANN. Electronic Journal of Geotechnical Engineering, vol. 18. pp. 899-907. [ Links ]
SAS Institute Inc., 2019. Artificial intelligence: What is it and why it matters. https://www.sas.com/en_za/insights/analytics/what-is-artificial-intellegence.html[accessed 3 September 2019]. [ Links ]
Stojadinovic', S., Lilic, N., obradovic', I., Pantovic', R., and Denic', M. 2015. Prediction of flyrock launch velocity using artificial neural networks. Neural Computing and Applications, vol. 27, no. 2. pp. 515-524. [ Links ]
Stojadinovic', S., Lilic, N., Pantovic', R., and Zikic', M. 2013. A new model for determining flyrock drag coefficient. International Journal of Rock Mechanics and Mining Sciences, vol. 62. pp. 68-73. [ Links ]
Stojadinovic', S., Pantovic', R., and Zikic', M. 2011. Prediction of flyrock trajectories for forensic applications using ballistic flight equations. International Journal of Rock Mechanics and Mining Sciences, vol. 48, no. 7. pp. 1086-1094. [ Links ]
Trivedi, R., Singh, T N., and Gupta, N. 2015. Prediction of blast-induced flyrock in opencast mines using ANN and ANFIS. Geotechnical and Geological Engineering, vol. 33. pp. 875-891. [ Links ]
 Correspondence:
J. van der walt
Email: Jennifer.vanderwalt@up.ac.za
Received: 29 Jan. 2020
Revised: 30 Jun. 2020
Accepted: 9 Nov. 2020
Published: December 2020

