


Servicios Personalizados
Articulo
 Inglés (pdf)
 Articulo en XML
 Referencias del artículo
Indicadores

Links relacionados
-
 Citado por Google
 -
 Similares en Google
Compartir

 Permalink
Journal of the Southern African Institute of Mining and Metallurgy
versión On-line ISSN 2411-9717
versión impresa ISSN 2225-6253
J. S. Afr. Inst. Min. Metall. vol.120 no.12 Johannesburg dic. 2020
http://dx.doi.org/10.17159/2411-9717/1139/2020
PROFESSIONAL TECHNICAL AND SCIENTIFIC PAPERS
Evaluation of mineral resources carrying capacity based on the particle swarm optimization clustering algorithm
S. HeI, II; D. LuoI; K. GuoI
ICollege of Management Science, Geomathematics Key Laboratory of Sichuan Province, Chengdu University of Technology, China. D. Luo: https://orcid.org/0000-0002-0374-5855
IIDepartment of Computer Science and Information Engineering, Yibin University, China. S. He: https://orcid.org/0000-0002-0650-458x
SYNOPSIS
As minerals are a non-renewable resource, sustainability must be considered in their development and utilization. Evaluation of the mineral resources carrying capacity is necessary for the sustainable development of mineral resource-based regions. Following the construction of a comprehensive evaluation index system from four aspects, namely resource endowment, socio-economic status, environmental pollution, and ecological restoration, a method combining particle swarm optimization (PSO) and the K-means algorithm (PSO-Kmeans) was used to evaluate the mineral resources carrying capacity of the Panxi region southwest Sichuan Province, China. The evaluation method is data-driven and does not consider the classification standards of different carrying capacity levels. At the same time, it avoids the problems of local optimization and sensitivity to initial points of the K-means algorithm, thereby providing more objective evaluation results and solving the problem of subjective division of each grade volume capacity in carrying capacity evaluation. The algorithm was verified through UCI data-sets and virtual samples. By superimposing a single index on the carrying capacity map for analysis, the rationality of the evaluation results was validated.
Keywords: particle swarm optimization, K-means algorithm , mineral resources, carrying capacity, sustainability.
Introduction
The sustainable use of resources is an issue that any country should pay attention to and monitor over the long term. In China, the world's largest energy producer, the rational exploitation and utilization of mineral resources is the key to the healthy development of energy production, the economy, and society. Xie, Zhou, and Lin (2005) pointed out that the population and economic development of China have not exceeded the natural resources carrying capacity, but some areas and natural resources are seriously overloaded. The mineral resources carrying capacity is the capacity of mineral resources to support human social and economic activities in a foreseeable period under certain resource and environmental constraints. Monitoring the mineral resources carrying capacity in natural resource exploitation must be conducted over the long term.
An objective evaluation of the carrying capacity of regional mineral resources will enable rational development and utilization. However, at present there are few studies on the evaluation of the mineral resources carrying capacity, and mathematical statistical models or related integration methods have been adopted using indexes constructed from the aspects of economy, society, and environment. Li and Lyu (2018) used the set pair analysis and entropy value methods to evaluate mineral resources carrying capacity. Wang et al. (2016) used the entropy method. Wei (2006) used the fuzzy comprehensive evaluation method. Wanga, Shi, and Wan (2020) proposed the RCA-TOPSIS-RSR method to comprehensively evaluate the carrying capacity of mineral resource-based cities. In the process of classification, the RCA-TOPSIS-RSR method was used to classify the cities into high, medium, and low carrying capacity levels by evaluating the range of the rank-sum ratio (RSR). Bakhtavar and Yousefi (2019) used TOPSIS to rank 14 candidate well-sites and choose the best.
In these studies, the determination of classification standards for different carrying capacity grades is generally subjective, done mainly by setting thresholds or demarcating ranges. At present, there is also a lack of common methods for classifying the carrying capacity. The clustering algorithm, a common method in data mining technology, is a data-driven method, without considering classification standards of different grades, to solve the problem of the subjective classification of carrying capacity grades, which makes the evaluation results more objective and reasonable.
In recent years, an increasing number of clustering algorithms have been applied to ecological environment evaluation, functional region division, and other problems. The K-means clustering algorithm is the most commonly used. Celestino and Cruz (2018) proposed using the PCA method to reduce the data dimensionality and the K-means clustering algorithm to evaluate groundwater quality. Xua et al. (2018) proposed an improved entropy-weighted method and K-means clustering algorithm for an urban flood risk assessment model. Compared with the traditional clustering and TOPSIS methods, the improved algorithm achieved better results. Salehnia, Ansari, and Kolsoumi (2019) described the common characteristics of low-, medium- and high- yield wheat years by clustering climate data. In addition, the fitness function was used to evaluate the climate data clustering results with the AI, AOC, GA, and K-means algorithms. Wang, Wang, and Niu (2017) proposed an effective mapping framework for landslide susceptibility by combining information theory, K-means clustering analysis, and a statistical model. Liu, Peng, and Wu (2018) proposed a method to identify urban expansion, using K-means clustering of the gridded population density and local spatial entropy to cluster four geographical units through two indicators. Javadi et al. (2017) used K-means clustering to evaluate the vulnerability of groundwater, but pointed out that the limitations in the application of the K-means clustering algorithm still need to be considered.
The K-means clustering algorithm is one of the most widely used clustering algorithms. The algorithm is simple and easy to use and is suitable for processing large-scale data. It is suitable for the clustering of numerical attributes and provides good clustering results for superspherical and convex data (Wei, 2013), and it converges to a local optimum (Lei et al., 2008). The shortcomings of the K-means clustering algorithm are also clear, as it is very sensitive to initial point selection. Improper initial point selection can easily cause the clustering result to converge to a local optimum or even provide an incorrect clustering result (Ismkhan 2018; Xiong, Peng, and Yagb, 2017; Ia and Li et al, 2016; Ye et al., 2015; Lei et al, 2008; Sun, Li, and He et al, 2008). At the same time, the K-means clustering algorithm is based on the gradient descent solution, which easily determines a local optimum but does not necessarily determine a global one (Xu, Xu, and Zhang , 2018; Ye et al, 2015). The simplicity and ease of use of the K-means clustering algorithm are also subject to its shortcomings. Optimizing the initial cluster centre and determining the appropriate number of clusters have therefore been the focus of research on K-means clustering.
Although the K-means clustering algorithm has been widely used in ecological environment assessment, its clustering results may be only local optimal results instead of strictly global ones. At the same time, the clustering results may suffer instability problems. In this paper we propose an optimized K-means algorithm and apply it to the assessment of mineral resources carrying capacity.
Recently, there have been an increasing number of studies on improving the K-means algorithm, mainly combining an optimization algorithm with the K-means clustering algorithm. Niknam and Amiri (2010) proposed a hybrid algorithm based on particle swarm optimization (PSO), ant colony optimization (ACO), and the K-means algorithm to optimize clustering. Xu and Li (2011) and Xie and Li (2014) proposed a K-means optimized clustering algorithm based on the improved PSO algorithm. The powerful global search ability of the PSO algorithm was used to optimize the selection of the initial clustering centre. The clustering accuracy rate was higher than 80% through UCI dataset verification. Because of the PSO algorithm, it could maintain its random behaviour better than the artificial bee colony (ABC) algorithm in determining the global optimum, and the result was superior to that of the ABC algorithm (Niknam and Amiri, 2010).
In this paper, the proposed method combines the PSO and K-means algorithms to conduct a global search for particles in the solution space after initial random classification, thereby classifying the shortest distance of the K-means as its principle, and adopts the fitness function of K-means as the standard for detecting updated particles. A sufficient number of iterations is carried out to make the final clustering result both globally optimal and locally optimal, so that the fitness function value converges. This method entails carrying out a local search and a global search simultaneously, which is also different from other PSO-Kmeans algorithms, which first carry out a global search to find the optimal initial point, followed by a local search from the initial point. When this model is applied to the evaluation of mineral resources carrying capacity, the evaluation unit can be placed into different classes by global and local optimization based on the value of the multi-attribute index, and the number of each class also depends on the index data itself. This model also avoids the traditional evaluation methods (such as the traditional entropy method) to get the order of evaluation units after the comprehensive evaluation, and how to divide the grades and how many evaluation units of each grade to use can only be done using subjective experience.
Study area and data-set
Study area
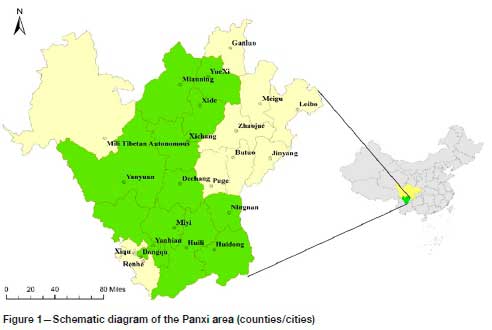
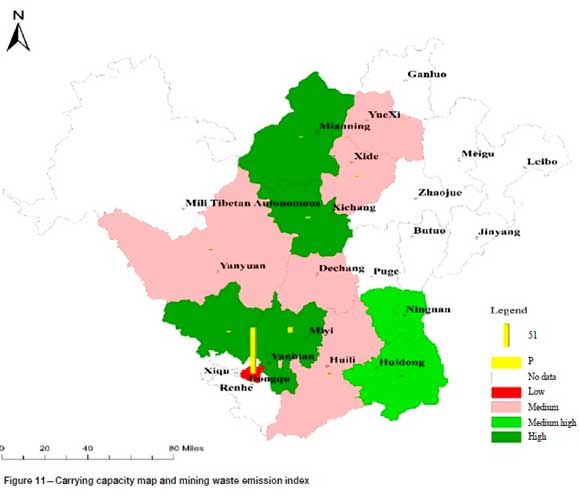
The Panxi region is located in the southwest of Sichuan Province, and comprises Panzhihua City and the Liangshan Yi Autonomous Prefecture. The region borders Ya'an City in the north, Leshan City and Yibin City in the northeast, the Ganzi Tibetan Autonomous Prefecture in the northwest, and Yunnan Province in the east, south, and southwest. The Panxi region is one of the most resource-rich areas in western China and is characterized by large reserves of vanadium-titanium magnetite, which are excellent rare earth resources, and suitable resource development conditions. Abundant vanadium-titanium magnetite ore reserves have been identified, accounting for more than 15% of the total iron ore reserves in China. Therefore, this paper mainly considers vanadium-titanium magnetite as a single mineral in its evaluation. The evaluation area consists of the districts and counties in Panxi with iron ore mining, production, and reclamation activities in 2017, including Dongqu, Yanbian County, and Miyi County of Panzhihua City, Xichang City, Dechang County, Huili County, Huidong County, Ningnan County, Yuexi County, Xide County, Mianning County, and Yanyuan County of the Liangshan Yi Autonomous Prefecture. There are 12 counties (cities) in total, as shown in Figure. 1.
Data
To evaluate the mineral resources carrying capacity in the 12 counties (cities) of Panxi, data was collected on social, economic, and environmental aspects, including the following.
> The population and area data are from the Panzhihua 2018 Statistical Yearbook and the Liangshan Yi Autonomous Prefecture 2018 Statistical Yearbook
> The data on the remaining recoverable mineral reserves, employment in the mining industry, annual taxes, sales revenue from mineral products, actual production amounts, and treated areas are from the Department of Natural Resources of Sichuan Province.
> The waste emission coefficient data from iron ore mining came from the Manual of the First National Pollution Source Survey of Emission Coefficient of Industrial Pollution Sources (revised in 2010).
Methodology
Overall framework of the study
The overall framework of the research method in this paper is shown in Figure. 2. It mainly consists of the following three parts.
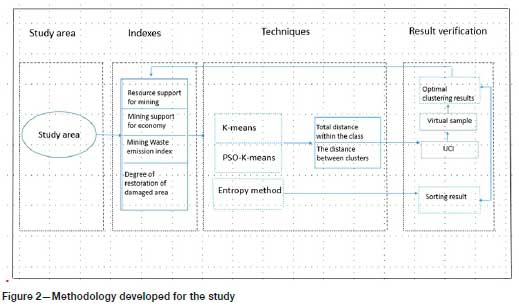
> On the basis of establishing an index system, the K-means clustering and PSO-Kmeans algorithms are used to cluster the evaluation units according to the attribute value of the index. The total distance of the class centre and the total distance within the class are used as criteria for evaluating the validity of the clustering results. The robustness of the algorithm is verified with UCI data-sets and virtual samples.
> Under the same index system, the entropy method is used to determine the weight, calculate the comprehensive evaluation value of the evaluation unit, and rank the carrying capacity of the evaluation unit. The ranking result is then compared with the optimal clustering result.
> A single indicator is superimposed on the carrying capacity map, and the results are analysed in combination with the carrying capacity evaluation level to verify the results.
Indicator system
The selection of mineral resources carrying capacity evaluation indicators is considered mainly from the economic, social, and environmental aspects (Li and Lyu, 2018; Wei, 2006). Clearly, the population carrying capacity (Wang,1998) and economic carrying capacity (Hou, 2007) are also evaluated. This paper will start from the four aspects of resource endowment, social economy, environmental pollution, and ecological restoration to reflect the mineral resources carrying capacity of human social and economic activities. At the same time, reference is made to the technical requirements for regional geological resources and environmental carrying capacity evaluation in accordance with the mineral industry standards of China. An index system is established consisting of resource support for mining, mining support for the economy, mining waste emission index, and degree of restoration of damaged areas.
Resource support for mining
The number of years that the resource endowment of each region can actually support the regional mining production is also the sustainable period of its resources. The remaining recoverable reserves of the region divided by the actual annual mining rate were used to measure the degree of support of the resource endowment of the region to the mining industry, represented by R in Equation [1], which is a positive indicator.
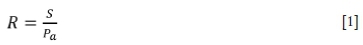
where S is remaining recoverable reserves, and Pais the actual annual mining rate.
Mining support for the economy
The social and economic benefits generated by the mining industry in each region are reflected by the proportion that mining contributes to the economy, the tax rate paid by the mining industry, and the proportion of employment in the mining industry, and is represented by E in Equation [2], which is a positive indicator.
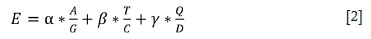
where A is the added value of the industry, G is the GDP of the city/district, T is the annual tax, C is the sales revenue of mining products, Q is the mining employment, D is the total population of the city/district, and a,ß,and γ are proportion indexes. These factors are determined by experts according to the general trend of national industrial added value, employment rate, and taxation growth trends. Take 2017 as an example. According to data from the Ministry of Industry and Information Technology, the country's industrial added value in 2017 was the best in the past three years, indicating that industrial added value has an increasing impact on social and economic support, therefore experts assign a larger value to α. For 2017, α,β and γ are 0.45, 0.30, and 0.25 respectively.
Mining waste emission index
To reflect the environmental pollution caused by waste discharge during the mining and production processes, according to the Manual of the First National Pollution Source Survey of Emission Coefficient of Industrial Pollution Sources (revised in 2010), the various waste emission coefficients generated during the mining and production of iron ore are determined, including industrial wastewater, chemical oxygen demand, petroleum, industrial waste gas, industrial dust, sulphur dioxide, and nitrogen oxides. Based on the above coefficients, the pollution emission index per square kilometre of ore production is calculated as a measure of the environmental pollution caused by mining, and is represented by P, which is a negative indicator.
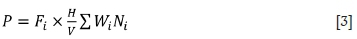
where H is the output of mineral products, V is the total area of the city/district, Wiis the weight of class i waste in the total discharge, which is calculated by analytic hierarchy process. Ni is the discharge coefficient of class i waste, and Fiis the normalization coefficient of class i waste. The value of Fiis 100 times the reciprocal of the maximum value of waste emission.
Degree of restoration of damaged areas
To reflect the ecological restoration of damaged areas during mining in each region, the damaged area that has been treated is divided by the damaged area that should be restored; that is, the treatment rate; and O is the restoration degree index of damaged areas in mining development, which is a positive indicator.
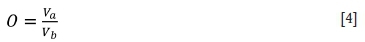
where Vais he damaged area that has been treated, and Vbis the damaged area that should be restored.
Evaluation method of the mineral resources carrying capacity based on the PSO-Kmeans algorithm
Cluster analysis is data-driven. Based on the establishment of the index system, clustering is performed by evaluating the similarity between the unit index attribute values. The most commonly used and simplest clustering algorithm is the K-means clusteriwng algorithm.
K-means clustering
K-means clustering is a classification approach based on partitioning. After the initial clustering centre has been randomly selected according to the number of clusters, the classification is redistributed by calculating the distances between other points and the clustering centre, and the clustering centre is iterated continuously using Equation [6] until the objective function J obtains the optimal solution via Equation [5].
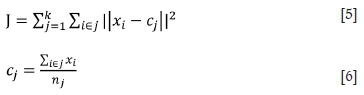
where xiis the ith data object in the X data-set, cjis thejth clustering centre, and njis the number of data objects in the jth clustering centre.
PSO-Kmeans clustering
The PSO algorithm is a group of behaviour algorithms simulating the foraging activities of birds. According to the optimal position of individuals relative to food and the optimal position shared by the group, the flight direction is changed, and the optimal position relative to food is reached after constantly updating the position and speed. Assuming that the particle flight space is an m-dimensional space, at the t iteration, the position and velocity vectors of the j-th particle are expressed as Xtj= (xtj1, xtj2, xtj3,......, xtjm) and Vtj= (vtj1, vtj2, vtj3 ,......, vtjm), respectively. The individual optimal position is found in each iteration, Pbestj= (pj1, pj2,......Pm), and the global optimal position is Gbest= (gvg2,......gm). At each iteration, the particles update their speed and position with Equations [7] and [8], respectively (Shi and Eberhart, 1998).
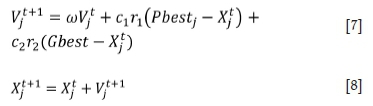
where C1and C2are learning factors controlling the maximum duration of the iteration, with a value of generally 2, r1and r2 are random numbers between 0 and 1, and ω is the inertial weight (Equation [9]), which has the ability to balance local and global optima. Generally, the initial value of ω decreases rapidly as the number of iterations increases. When the particle swarm converges to the optimal solution, the value of ω decreases slowly.

where ωmax and ωminare the maximum and minimum inertia weights, tmaxis maximum number of iterations, and t is current iteration number.
Therefore, PSO-Kmeans combines the two algorithms to conduct a global search for particles in the solution space after initial random classification, thereby classifying the shortest distance of the K-means as its principle, and adopts the fitness function of K-means as the standard for detecting updated particles. The steps of the mineral resources carrying capacity evaluation model proposed in this paper are as follows:
Input: Number of particles N, number of iterations M, number of clusters K, data-set data, learning factor c1, c2, maximum and minimum weights ωmax, ωπη, maximum and minimum speeds vmaxc, vmin, maximum and minimum positions xmaa, xmn.
Output: fitness function value J, K clustering centres, data data-set classification, data data-set evaluation level.
Model steps:
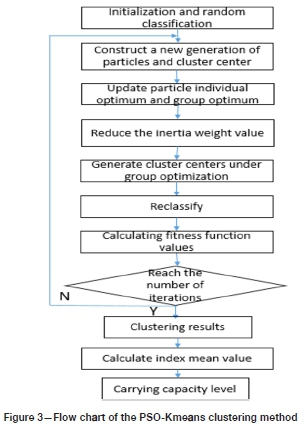
Step 1: Initialization and random classification
1 Initializes each set value of particle velocity and input.
2 The data-set is randomly divided into K classes, and the category centre of each class is calculated by Equation [6]. The category centre is the position of the particle. If the dataset has π dimension, the position of the ith particle is χ = (x0i, x1i......xki), xki = (Yk1i, Yk2i.......Yikm) ykmi, is the π-dimensional data of the Kth clustering center of the ith particle.
3 Equation [5] is used to calculate the fitness function value of the particle, which is taken as the initial value of the optimal fitness of the particle.
4 Repeat 2-3 to generate the positions of N particles and take them as the best positions for individual particles. The minimum value of the individual optimal fitness of N particles is taken as the group optimal fitness, and the particle position under the fitness is taken as the group optimal position, Gbest. Step 2: Construct a new generation of particles
The particle speed is updated in Equation [7] and controlled within [vmax vmin], while the particle position is updated in Equation [8] and controlled within [xmaxxmn]. Update the individual optimal and group optimal positions of particles. Step 3: Generate new cluster centres.
Step 4: Generate the optimal fitness and optimal position of individual particles.
Step 5: Generate the optimal fitness and optimal position of group.
Step 6: Reduce the inertia weight value.
Step 7: Divide Gbest into K clustering centres.
Step 8: Reclassify the data-set according to the principle of the shortest distance between K clustering centres.
Step 9: Calculate the fitness function value by Equation [5].
Step 10: Repeat step 2 - step 9 until reach the set number of iterations, then go to step 12.
Step 11: Output fitness function value J, K clustering centres, data data-set classification.
Step 12: Calculate the data mean value of each category of K categories, and assign each class an ordered label according to the mean value (Xu et al., 2018).
The process of mineral resource carrying capacity evaluation based on the PSO-Kmeans algorithm is shown in Figure 3.
Virtual sample
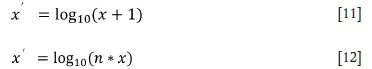
Faced with the problem of small samples in actual engineering practice, one solution is to generate virtual samples in order to expand the number of samples and enrich the limited information content of small samples (Zhu, Chen, and Yu, 2016). Yang et al. (2011), according to smoothness, proposed a novel VSG method based on Gaussian distribution (VSGGD). The basic concept is to generate several Gaussian random numbers around a certain original sample, and keep the label unchanged. Based on the methods of Yang et al. (2011) and Ding (2013), the original data is transformed to a Gaussian distribution to generate virtual samples. There are many methods for Gaussian distribution transformation, such as square root transformation, logarithmic transformation, and BOX-COX transformation. We use the logarithmic transformation to construct a Gaussian distribution N(μ,σ2), where μ is the mean and σ2 the standard deviation, as in Equation [10]. The number of ore-producing areas is inherently small, so there is small sample problem. It is proposed to use the method of putting the virtual samples into the model together with the original samples, and then removing the virtual samples after classification. In this way, the consistency of the evaluation results obtained with the original samples and after adding the virtual samples is tested.

When x is 0 or a small number, Equations [11] and [12] are used to avoid negative numbers and wrong values.
Results and discussion
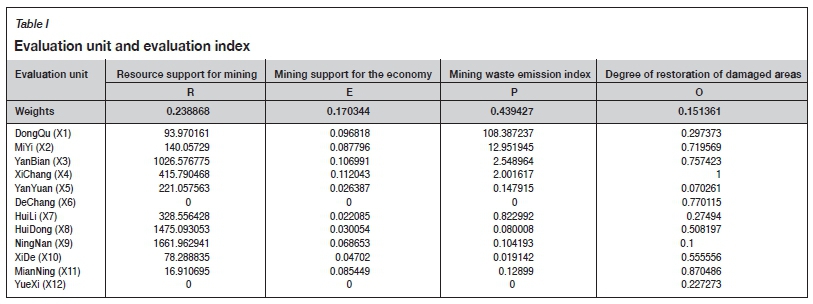
According to the previous modeling steps, use MATLAB software for modeling. The evaluation index data and weights are shown in Table I for data normalization and input as data-set. Input particle number N = 50, number of iterations M = 50, number of clusters K = 4, learning factor c1= c2= 2, maximum and minimum weights ωmax= 0.9, ωmin= 0.4, maximum and minimum speeds νπαχ= 1, νmin= -, maximum and minimum positions χπαχ= 1, χmin= 0. Number of clusters K = 4, namely, the rating grade of data-set can be divided into four categories: high, medium-high, medium, and low.
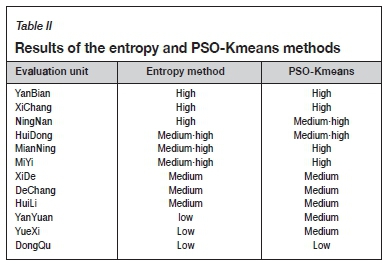
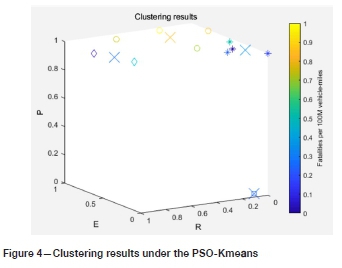
By using the K-means and PSO-Kmeans clustering methods, evaluation unit clustering was realized using MATLAB software, and the carrying capacity rating was evaluated. Because the K-means and PSO-Kmeans algorithms randomly select initial points, different initial points may lead to different clustering results. Therefore, ten operations were performed with the two methods, and 80% probability in PSO-Kmeans method is the same clustering result after multiple operations. However, only 50% of the probability under K-means is the same clustering result. The other clustering results are different, and the clustering results are unstable. The results of the evaluation units ranked by the entropy method and clustered by the PSO-Kmeans method are compared, as summarized in Table II. The clustering results under PSO-kmeans are shown in Figure 4. X6 and X12 units are coincident after dimension reduction processing.
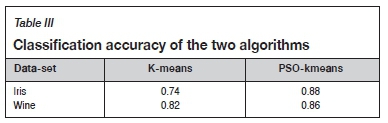
In order to prove the generalization ability of PSO-Kmeans and the robustness of the results, Iris and Wine in the UCI data-set were selected for experiments. Iris has 150 labelled 4-dimensional samples; Wine has 178 labelled 13-dimensional samples. K-means and PSO-Kmeans were used for clustering, and the average accuracies of correct clustering are shown in Table III. It can be seen that PSO-Kmeans has good clustering ability for high-dimensional and low-dimensional data.
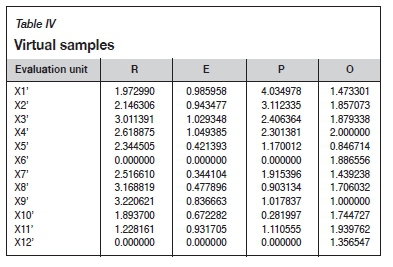
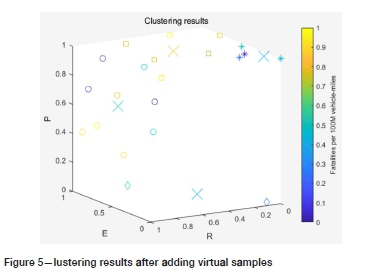
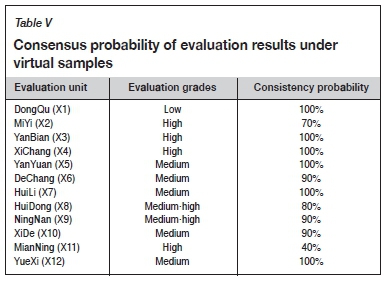
When the large data-sets of UCI are running well, in order to prove the stability of the evaluation results of the model, the virtual samples are expanded according to Equations [10]-[12] on the basis of the original samples, as shown in Table IV. The virtual samples are added to the original samples and put into the model to run 10 times randomly. The clustering results are shown in Figure 5. The probability of consistency with the evaluation results of the original samples is shown in Table V. It can be seen that, except for the large difference in X11 evaluation units, the evaluation results after adding the virtual samples are basically the same as the original evaluation results.
Comparison of the different methods
Comparison of algorithms
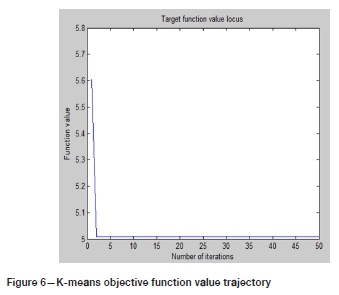
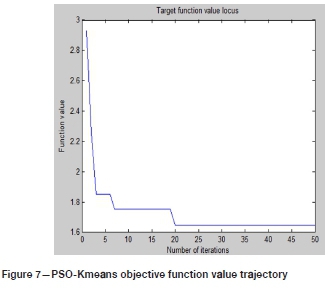
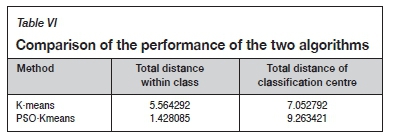
Both the K-means and PSO-Kmeans algorithms rely on Equation [5] as the objective function, and the number of iterations is 50. After multiple calculations using the K-means algorithm, the clustering results are different, but the objective function values are convergent, as shown in Figure 6. After multiple operations, the PSO-Kmeans algorithm basically generates the same clustering result, and the value of the objective function also converges, as shown in Figure 7. The optimal clustering result is obtained when the distance within the class is minimized while the distance between the centres of the classes is maximized. That is, the difference between classes is larger, while the distance within classes is smaller. The total distance of the class centre and the total distance within the class were used to evaluate the validity of the two methods. After 10 random runs, the average values of the total distance to the centre of the class and the total distance within the class of the two methods are obtained, as summarized in Table VI. It can be observed that the total distance of the class centre under the PSO-Kmeans algorithm is larger than that under the K-means algorithm, and the total distance within the class is smaller than that under the K-means algorithm. Therefore, the clustering results of the PSO-Kmeans algorithm are better than those of the K-means algorithm, and after global and local optimization of the initial points with the PSO-Kmeans algorithm, the clustering results show almost no difference and are more stable than those of the K-means algorithm.
Comparison of evaluation methods
Under the entropy method, the number of each grade can be set subjectively. The grade can also be determined by setting a threshold for the comprehensive evaluation value. However, at present there is no unified threshold standard, and there may be a problem in that the threshold is not applicable due to regional differences. Therefore, when the comprehensive evaluation value is taken as the evaluation standard (such as in the entropy method, TOPSIS), the number of samples for each grade can only be divided in a subjective way. Table II shows the evaluation results of 12 evaluation units using the two methods. With the entropy method, after sorting the comprehensive evaluation value, the number of each category is divided subjectively and equally. Compared with the PSO-Kmeans method, X9 changed from high to medium-high, and X12 and X5 from low to medium. As can be seen from Figure 9, X9 and X8 are the two regions with the most abundant resources, and the other three indicators are not significantly different. Using subjective division, the two areas are rated at different grades. Only taking them as an evaluation category can highlight the great differences between them and other regions under the common characteristics, and the evaluation will be more reasonable. As can be seen from Figure 11, the waste emission intensity in X1 is very high - thousands of times greater than in X5 and X12 while the differences in the other three indicators are very small. However, in the subjective division, X5, X12, and X1 are classified in the same grade. At the same time, it can be seen from Figure 4 that X1 has become very different from other regions. Therefore, it is more reasonable to treat X1 as a category by itself. PSO-Kmeans is data-driven and classifies high and low based on the principle of similarity to solve the subjective division of the number of samples for each grade.


Discussion of the evaluation results
Discussion under a single indicator
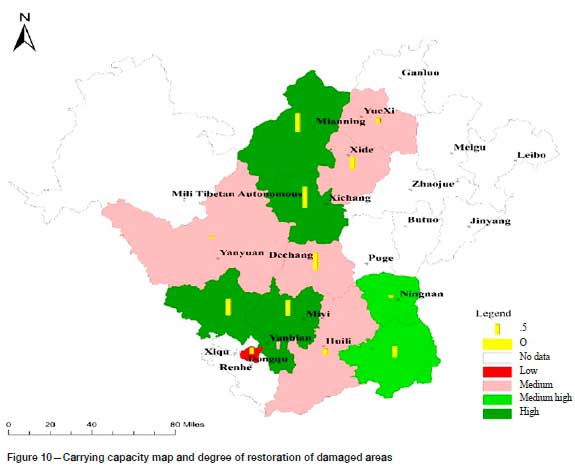
According to the evaluation results of the PSO-Kmeans algorithm, the mineral resources carrying capacity of the Panxi area is divided into four levels. The carrying capacity of the evaluation unit clustered by the PSO-Kmeans algorithm is used as the base map, and each evaluation index element is superimposed on the carrying capacity base map. Figure 8 reveals that the evaluation unit with a high regional economic support occurs in the region with high and medium-high carrying capacity levels. Figure 9 shows that the evaluation unit with a relatively short sustainable life of the regional mineral resources is the region with medium and low carrying capacities. Figure 10 demonstrates that the difference in the index of regional ecological restoration degree is not too large, and the better evaluation unit is the region with high and medium-high carrying capacity levels. Figure 11 shows that the mining waste emission index is high in the region with a low carrying capacity. Therefore, in the discussion under a single index, the evaluation result after clustering with the PSO-Kmeans algorithm is reasonable.
Discussion and suggestions for the results under comprehensive indicators
The evaluation method based on the PSO-Kmeans algorithm can better meet the needs of grade evaluation of the mineral resources carrying capacity of the Panxi region. After the evaluation grade has been objectively determined, the four indexes are superimposed. By combining the index data collected in the early stage and the superimposed graph, as shown in Figure 12, the following can be concluded.
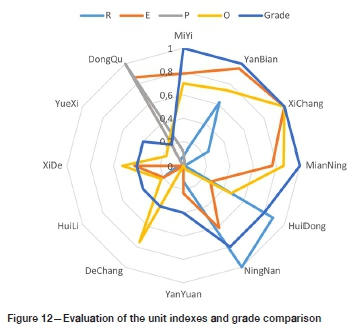
Xichang, Yanbian, and Miyi, with high carrying capacity levels, are rich in mineral resources with a long sustainable life. The high output of mineral products generates a high level of economic support and suitable conditions for ecological restoration. Although the sustainable life of Mianning's mineral resources is short, it has high degree of economic support and suitable ecological restoration. Therefore, in the short term, its carrying capacity is still high, but will decrease if resources are rapidly exhausted. Therefore, X11 also shows greater uncertainty after adding virtual samples.
The medium-high carrying capacity levels of Huidong and Ningnan are attained despite the low output of mineral products, and the region is highly dependent on the mineral economy, while its resources have a long sustainable life and the degree of ecological restoration is acceptable. The carrying capacity is relatively high in the short term but may be increased if mining output is moderately increased in the later period.
The medium carrying capacities of Yanyuan, Dechang, Huili, Xide, and Yue Xi are a result of very low mineral outputs, and there are no mining activities in certain areas. The mining economy is severely contracted, but ecological restoration is still being carried out. Therefore, the short-term carrying capacity is medium, but after ecological restoration reaches a certain level and mineral resources are developed and exploited, the carrying capacity will increase.
Dongqu, which has a low carrying capacity, has a high output of mineral products and a high degree of support for the economy, but its resources have a short sustainable life. Dongqu's high output and small area result in a high intensity of pollutant discharge per square kilometre of ore production in the area, and a low degree of ecological restoration. Therefore, in the short term, if the output is not controlled, the carrying capacity will decrease.
Conclusion
Mineral resources carrying capacity is an important indicator of the sustainable development potential of regions whose economies are based on mineral resources. To comprehensively evaluate the regional mineral resources carrying capacity and solve the problem of subjective division of the number of samples for each grade, a mineral resources carrying capacity evaluation model based on the PSO-Kmeans algorithm is proposed. This paper takes the Panxi region as an example and applies the PSO-Kmeans algorithm to carry out a grade evaluation of the mineral resources carrying capacities, which provides a basis for the relevant authorities to formulate sustainable utilization policies for mineral resources.
This paper applies the improved data mining algorithm to the objective evaluation of the mineral resources carrying capacity. Because there are only 12 (city) counties in the area where iron ore mining and production are carried out, the number of possible evaluation units is small. However, iron ore is being mined in only 14 cities in the whole province. The evaluation model proposed in this paper is generated from the actual needs of the research area, and it is necessary to apply an objective data-mining algorithm in practice. Therefore, it is proposed to construct virtual samples and verify the algorithm through the virtual samples under the premise of the UCI data-sets verification. The next step is to evaluate the mineral resources carrying capacity of an entire province based on the unit of a city and the PSO-Kmeans algorithm model. The PSO-Kmeans algorithm evaluation model should also be applied to other resources and environmental carrying capacity fields.
Acknowledgements
This research is supported by the Opening Fund of the Geomathematics Key Laboratory of Sichuan Province (No. scsxdz2019yb06). Also thank these funds for their support: the Geomathematics Key Laboratory of Sichuan Province (NO. scsxdz2019zd02); Sichuan Mineral Resources Research Center(No. SCKCZY2019-ZD002); Sichuan Mineral Resources Research Center(No. SCKCZY2019-ZC002).
References
Bakhtavar, E. and YousEH, S. 2019. Evaluation of shaft locations in underground mines: Fuzzy multiobjective optimization by ratio analysis with fuzzy cognitive map weights. Journal of the Southern African Institute of Mining and Metallurgy, vol. 119, no. 10. pp. 855-864. [ Links ]
Celestino, A.E.M. and Cruz, D.A.M. Groundwater quality assessment: An improved approach to K-means clustering, principal component analysis and spatial analysis: A case study. Water, vol. 10. pp. s437. doi:10.3390/w10040437 [ Links ]
Cmcioglu, P. and Besdok, E. 2013. A conceptual comparison of the Cuckoo-search, particle swarm optimization, differential evolution and artificial bee colony algorithms. Artificial Intelligence Review, vol. 39. pp. 315-346. doi: 10.1007/s10462-011-9276-0 [ Links ]
Cui, C-Q., Wang, B., Zhao, Y-X., and Wang, Q. 2019. China's regional sustainability assessment on mineral resources: Results from an improved analytic hierarchy process-based normal cloud model. Journal of Cleaner Production, vol. 210. pp. 105-120. https://doi.org/10.1016/j.jclepro.2018.10.324 [ Links ]
Ding, Z. 2013. A small sample clustering algorithm by generating random samples from Gaussian distribution. Computer Knowledge and Technology, vol. 9, no. 29. pp. 6609-6611. [ Links ]
Fana, Y. and Fang, C. 2020. Evolution process analysis of urban metabolic patterns and sustainability assessment in western China, a case study of Xining city. Ecological Indicators, vol. 109. pp. 105784. https://doi.org/10.1016/j.ecolind.2019.105784 [ Links ]
Guo, Q. 2018. A comprehensive evaluation model of regional atmospheric environment carrying capacity: Model development and a case study in China. Ecological Indicators, vol. 91. pp. 259-267. [ Links ]
Hou, H-I. 2007. Research status and development of carrying capacity of mineral resources. Proceedings of the2007Annual Conference of China Geological and Mineral Economics Association. [ Links ]
Jia, R-Y. and Li, Z. 2016. The level of K-means clustering algorithm based on the minimun spanning tree. Microelectronice & Computer, vol. 33, no. 3. pp. 86-93. [ Links ]
Ismkhan, H. 2018. I-k-means An iterative clustering algorithm based on an enhanced version of the k-means. Pattern Recognition, vol. 79. pp. 402-413. https://doi.org/10.1016/j.patcog.2018.02.015 [ Links ]
Javadi, s., Hashemy, s.M., Mohammdi, K., and Howard, K.W.F. 2017. Classification of aquifer vulnerability using K-means cluster analysis. Journal of Hydrology, vol. 549. pp. 27-37. https://dx.doi.org/10.1016/j.jhydrol.2017.03.060 [ Links ]
Lei, X-F., Xie, K-Q., Lin, f., and Xia, Z- Y. 2008. An efficient clustering algorithm based on local optimality of K-means. Journal of Software. pp. 1683-1692. [ Links ]
Leote, P., Cajaiba, R.L., and Cabral, J.A. 2020. Are data-mining techniques useful for selecting ecological indicators in biodiverse regions? Bridges between market basket analysis and indicator value analysis from a case study in the neotropics. Ecological Indicators, vol. 109.p. 105833. https://doi.org/10.1016/j.ecolind.2019.105833 [ Links ]
Li, M. and Lyu, Y. 2018. Evaluation of the bearing capacity of the coal resources in Taiyuan city. China Mining Magazine, vol. 27, no. 6. pp. 62-65. [ Links ]
Liu, L., Peng, X., and Wu, H. 2018. Fast identification of urban sprawl based on K-Means clustering with population density and local spatial entropy. Sustainability, vol. 10. p. 2683. doi:10.3390/su10082683 [ Links ]
Niknam, T. and Amiri, B. 2010. An efficient hybrid approach based on PSO, ACO and k-means for cluster analysis. Applied Soft Computing, vol. 10. pp. 183-197. doi:10.1016/j.asoc.2009.07.001 [ Links ]
saisana, W.B.M., Paruolo, p., and Vandecasteele, I. 2017. Weights and importance in composite indicators: Closing the gap. Ecological Indicators, vol. 80. pp. 12-22. https://dx.doi.org/10.1016/j.eecolind.2017.03.056 [ Links ]
salehnia, N., Ansari, H., and Kolsoumi, s. 2019. Climate data clustering effects on arid and semi-arid rainfed wheat yield: a comparison of artificial intelligence and K-means approaches. International Journal of' Biometeorology, vol. 63. pp. 861-872. [ Links ]
shi, Y.E. 1998. RCA modified particle swarm optimizer. Evolutionary Computation. Prcoceedings of the 1998 IEEE World Conferemce on Computation Intelligence. pp. 69-73. IEEE, New York. [ Links ]
sun, Y-H., Li, Z-s., and He, P-I. 2008. K-means clustering algorithm based on local search mechanism. Computer Engineering, vol. 34,, no. 11. pp. 15-17. [ Links ]
Talebi, H., Mueller, u., and Tolosana-Delgado, R. 2019. Geostatistical simulation of geochemical compositions in the presence of multiple geological units: Application to mineral resource evaluation. Mathematical Geosciences, vol. 51. pp. 129-153. https://doi.org/10.1007/s11004-018-9763-9 [ Links ]
Wang, Q., Wang, Y., and Niu, R. 2017. Integration of information theory, K-means cluster analysis and the logistic regression model for landslide susceptibility mapping in the Three Gorges Area, Chin. Remote Sensing, vol. 9. p. 938. doi: 10.3390/rs9090938 [ Links ]
Wang, R., Cheng, J., Zhu, Y., and Xiong, W. 2016. Research on diversity of mineral resources carrying capacity in Chinese mining cities. Resources Policy, vol. 47. pp. 108-114. [ Links ]
Wang, Y. and Wang, D. 2010. Clustering study of fabric deformation comfort using bi-swarm PSO algorithm. Journal of Textile Research, vol. 31, no. 4. pp. 60-64. [ Links ]
Wang, Y-P. 1998. Population carrying capacity of mineral resources. China Population Resources and Environment, vol. 8, no. 3. pp. 19-22. [ Links ]
Wanga, D., shi, Y., and Wan, K. 2020. Integrated evaluation of the carrying capacities of mineral resource-based cities considering synergy between subsystems. Ecological Indicators, vol. 108. https://doi.org/10.1016/j.ecolind.2019.105701 [ Links ]
Wei, H. 2013. Improved hierarchical K-means clustering algorithm. Computer Engineering and Applications, vol. 49, no. 2. pp. 157-159. [ Links ]
Wei, J. 2006. Analysis on mineral resource carry capacity competitiveness and sustainable power in Hel Long Jang province. China Mining Magazine, vol. 15, no. 11. pp. 102-109. [ Links ]
Xie, G-D. and Zhou, H.L. 2005. Analysis of carrying capacity of natural resources in China. China Population, Resources and Environment, vol. 15, no. 5. pp. 93-97. [ Links ]
Xie, X-H. and Li, T-s. 2014. An optimized K -means clustering algorithm based on improved particle swarm optimization. Computer Technology and Development, vol. 24, no. 2. pp. 34-38. [ Links ]
Xiong, K-I, Peng, J-J., and Yabg, X-F. 2017. K-means clustering optimization based on kernel density estimation. Computer Technology and Development, vol. 27, no. 2. pp. 1-5. [ Links ]
Xu, D., Xu, Y., and Zhang, D. 2018. A survey on the initialization methods for the K-means algorithm. Operations Research Transactions, vol. 22, no. 2. pp. 31-40. [ Links ]
Xu, H. and Li, s-J. 2011. A clustering integrating particle swarm optimization and K-means algorithm. Journal of Shanxi University (Natural Science Edition), vol. 34, no. 4. pp. 518-523. [ Links ]
Xua, H., Ma, C., Lian, J., Xu, K., and Chaima, E. 2018. Urban flooding risk assessment based on an integrated k-means cluster algorithm and improved entropy weight method in the region of Haikou, China. Journal of Hydrology, vol. 563. pp. 975-986. [ Links ]
Yang, J., Yu, X., Xie, Z-Q., and Zhang, J-P. 2011. A novel virtual sample generation method based on Gaussian distribution. Knowledge-Based Systems, vol. 24. pp. 740-748. [ Links ]
Yang, Y. 2016. Improved K-means dynamic clustering algorithm based on information entropy. Journal of Chongqing University of Posts and Telecommunications (Natural Science Edition), vol. 2. pp. 254-59. doi:10.3979/j.issn.1673-825X.2016.02.018 [ Links ]
Ye, Z-W., Yin, Y-J., Wang, <-W., and Zhao, W. 2015. A clustering approach based on cuckoo search algorithm. Microelectronice & Computer, vol. 32, no. 5. pp. 104-110. [ Links ]
Yu, s-s., Chu, s.w., and Wang, C-M. 2018. Two improved k-means algorithms. Applied Soft Computing, vol. 68. pp. 747-755. https://doi.org/10.1016/j.asoc.2017.08.032 [ Links ]
Zhu, B. Chen, Z., and Yu, L. 2016. A novel mega-trend-diffusion for small sample. CIESC Journal, vol. 67, no. 3. pp. 820-826. [ Links ]
 Correspondence:
D. Luo
Email: luodejiang06@cdut.cn
Received: 21 Feb. 2020
Revised: 7 Oct. 2020
Accepted: 24 Nov. 2020
Published: December 2020

