


Serviços Personalizados
Artigo
 Inglês (pdf)
 Artigo em XML
 Referências do artigo
Indicadores

Links relacionados
-
 Citado por Google
 -
 Similares em Google
Compartilhar

 Permalink
Journal of the Southern African Institute of Mining and Metallurgy
versão On-line ISSN 2411-9717
versão impressa ISSN 2225-6253
J. S. Afr. Inst. Min. Metall. vol.120 no.11 Johannesburg Nov. 2020
http://dx.doi.org/10.17159/2411-9717/1205/2020
PROFESSIONAL TECHINICAL AND SCIENTIFIC PAPERS
Natural oxidation of coal tailings from Middelburg area (South Africa), and impact on acid-generation potential
N. van WykI; E. Fosso-KankeuI; D. MoyakheI; F.B. WaandersI; M. Le RouxII; Q.P. CampbellII
IWater Pollution Monitoring and Remediation Initiatives Research Group, School of Chemical and Minerals Engineering, North West University, Potchefstroom, South Africa. N. van Wyk: https://orchid.org/0000-0001-7600-7696; E. Fosso-Kankeu: https://orchid.org/0000-0002-7710-4401; D. Moyakhe: https://orchid.org/0000-0003-1833-3359
IICoal Beneficiation Research Group, School of Chemical and Minerals Engineering, North West University, Potchefstroom-South Africa. F.B. Waanders: https://orchid.org/0000-0002-4266-1566; Q.P. Campbell: https://orchid.org/0000-0003-0510-6018
SYNOPSIS
The aim of this study was to determine the acid-generating potential of coal mine tailings located in the Middelburg area, South Africa, using conventional assessment techniques. Four coal-tailing samples were collected from different layers of a coal-tailing pile. The acid-base accounting (ABA), acid-buffering characteristic curve (ABCC), and net acid generation (NAG) methods were used in conjunction with a mineralogical investigation to assess the potential of acid mine drainage (AMD) formation from the tailings.
The results showed that the top layer of the pile, which was exposed to the atmosphere, was most likely to form AMD, exhibiting the lowest paste pH (2.5) and ABA of zero kg H2SO4 per ton. The ABA results were compared to ABCC results and mineralogical calculations to confirm the findings. The results from the ABCC test and calculations based on mineralogy indicated that the ABA method overestimates the effective or readily available acid neutralization capacity (ANC) and the true MPA of each sample; only three of the four samples could therefore be classified as acid-forming, but with low acid-generating capacity.
Although the findings show that the top layer of the coal tailings in the Middelburg area is most likely to form AMD, it is important for future studies to further investigate the kinetics of acid formation.
Keywords: acid mine drainage, acid-base accounting, mineralogy, net acid generation, coal mine tailings.
Introduction
South Africa has mined coal commercially since 1857 and is one of the biggest coal producers in the world. Coal is currently the main source of energy for power generation in South Africa and will continue to be so for the foreseeable future (Hancox and Götz, 2014; Fosso-Kankeu, 2019).
The mined coal is subjected to a beneficiation process whereby the less valuable fraction, which cannot be processed economically, is separated. This leftover material is commonly deposited in large piles (tailings). Tailing piles can reach up to a hundred metres high and stretch for kilometres. These tailings generally contain materials with low coal grade but still contain a high concentration of sulphide minerals (Dolt, 2010; Fosso-Kankeu et al., 2011; Koch et al., 2017).
Acid is generated when sulphide minerals are oxidized by oxygen in the presence of water. The rate and extent of oxidation are limited by water, oxygen availability, and microbial activity (Dolt, 2010; Blowes et al., 2013; Fosso-Kankeu et al., 2016, Fosso-Kankeu, 2016, Fosso-Kankeu, Manyatshe, and Waanders, 2017; Koch et al., 2017). Acid mine drainage (AMD) is a result of acid that is generated by oxidation of sulphide minerals. Pyrite (FeS2) and pyrrhotite (FexS) are the sulphide minerals most commonly found in mine tailings and are considered to contribute the most to acid generation (Sobek et al., 1978; Smart et al., 2002; Dolt, 2010; Li et al., 2018). The acid generated during the oxidation of sulphide minerals reacts with acid-neutralizing minerals within the tailings deposits. Carbonate and silicate minerals contribute the most to acid neutralization (Blowes et al., 2013; Karlsson et al., 2018).
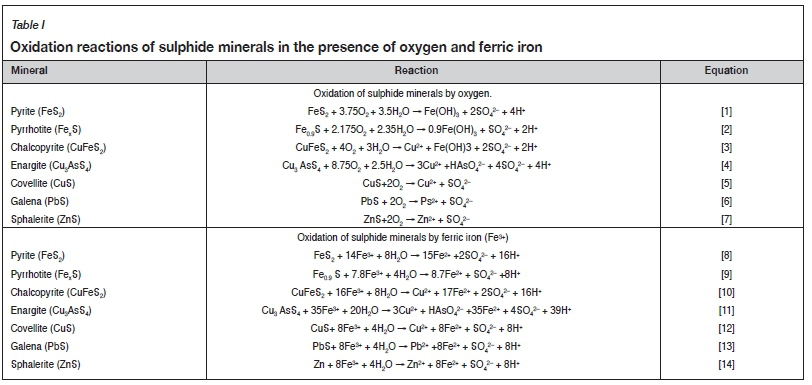
The AMD effluent is usually very acidic and contains high concentrations of sulphates (SO42-) and dissolved metal ions such as arsenic, cadmium, lead, manganese, mercury, zinc, chromium, and copper. The acid that is generated enables the dissolution of metals, giving rise to a wide range of environmental problems (Simate and Ndlovu, 2014; Li et al., 2018). When coal mine tailings are exposed to oxygen and a water-rich environment, oxidation of sulphur-bearing minerals will most likely occur, resulting in acid generation. Sulphur-bearing minerals that can contribute to acid generation include sulphide and sulphate minerals. Sulphide minerals contribute the most to acid generation (Sobek et al., 1978; Smart et al., 2002; Dold, 2010; Li et al., 2018). Table I summarizes the oxidation reactions of the most relevant sulphide minerals (Dold, 2017).
Different sulphide minerals generate different quantities of acid when oxidized, as illustrated in Table I. Pyrite is the most common acid-generating mineral, and produces 4 mol of protons when oxidized by oxygen (Table I Equation [1]). Sulphide minerals such as covellite, galena, and sphalerite do not generate acid when oxidized by oxygen (Equations [5]-[7]). If the pH in the tailing drops below a value of 4.5, then ferric iron becomes the primary oxidant. Ferric iron is the more aggressive oxidizer, generating up to four times the amount of acid compared to oxidation via oxygen, as seen by comparing Equation [1] with Equation [8], and Equation [2] with Equation [9], at a rate up to hundred times faster. Non-acid generating minerals such as covellite, galena, and sphalerite become acid generating when oxidized by ferric iron (compare Equations [5] and [12], [6] and [13], and [7] and [14]) (Usher et al., 2003; Dold, 2017). It is thus very important to prevent mine tailing from becoming acidic (pH below 4.5) to prevent the oxidation of sulphide minerals by ferric iron, therefore limiting the rate and quantity of acid generated.
In this study the acid-generating potential of four coal tailing samples (designated S1, S2, S3, and S4) were evaluated to predict the occurrence of AMD. Most common evaluation methods are either kinetic or static, depending on the procedure of the experiment. A static test only predicts the acid-forming potential but does not provide an indication of the rate or duration of acid generation (Oh et al., 2017). Kinetic tests attempt to mimic the natural oxidation reactions and conditions that occur in the environment (Oh et al., 2017). Kinetic test results are credible and provide information on parameters related to the rate of acid generation, sulphide reactivity, metal solubility. and oxidation kinetics. However, kinetic tests such as the leach column tests are extremely time-consuming and expensive. Static tests are relatively inexpensive and conducted relatively quickly (Smart et al., 2002; Oh et al, 2017).
Acid-base accounting (ABA) is a relatively dependable and inexpensive analytical procedure used to assess the chemical and physical properties of tailings (Skousen, 2017). ABA tests evaluate the balance between acid-neutralizing processes (dissolution of carbonates and weathering of silicates) and acid-generating processes (oxidation of sulphide minerals) (Smart et al., 2002). The ABA test procedure was first published by Sobek et al. (1978) and has become the method of choice to assess the acid-generating capabilities of waste rock or mine tailings (Bouzahzah et al., 2015).
ABA, as described by Sobek et al. (1978), consists of three measurements: (1) paste pH, (2) maximum potential acidity (MPA), and (3) acid neutralization capacity (ANC). These parameters are used to calculate the net acid production potential (NAPP) and ANC/MPA ratio. NAPP and ANC/MPA ratio are used to classify samples as potential acid-forming (PAF), non-acid forming (NAF), or uncertain (UC) (Usher et al., 2003).
The correlation between AMD and sulphide oxidation, as well as the precipitation and dissolution of minerals and metals, have been studied extensively over the past 70 years (Moses et al., 1987; Jambor, 1994; Wang, Dowd, and Xu, 2019). Less research has been done on the mineralogy and geochemical interactions that take place within tailings. However, it is of the utmost importance that we understand the parameters that control AMD formation in order to formulate an effective remediation strategy (Kalin, Fyson, and Meinrath, 2006; Dold, 2010). In this study, the ABA, NAG, and ABCC tests were used in combination with a mineralogical investigation to ascertain the acid-generating potential of different layers of coal tailings at a tailings storage facility in the Middelburg area, South Africa. As mining in this area will cease in the near future, it is important to better understand the environmental risks related to the storage of these tailings so that suitable prevention strategies for effective tailings management can be designed.
Experimental
Sample collection
Four samples were obtained from an undisclosed coal washing plant in the Middelburg. These samples originated from the same washing plant and are referred to as S1, S2, S3, and S4. Sample S1 is a fresh coal tailing sample that was recently processed and had not been exposed to the environment for longer than a week. Sample S2, S3, and S4 are weathered coal tailing samples obtained from a tailings pile that had been exposed to the environment and weathering conditions for about a year. Samples S2, S3, and S4 were collected at different depths within the tailings pile. Sample S2 was collected from the top of the tailings pile, and S3 and S4 were collected at depths of 1.5 and 4 m below S2 respectively.
Paste pH test
A paste-like slurry was prepared by mixing a 25 g sample with 50 mL of deionized water. The pH was measured after 2 hours and is referred to as the paste pH in accordance with the procedure utilized by Smart et al., (2002).
Modified acid-neutralizing capacity (ANC) test method
The modified ANC test involves adding a predetermined quantity and molarity of hydrochloric acid (20 mL of 0.5 M HCl) to 2 g of dry coal sample with a particle size smaller than 75 urn in a 250 mL flask (Smart et al., 2002; Weber et al., 2004). 20 mL of deionized water was then added to the sample solution. The flask was covered with a watch-glass and heated to 80-90°C for a period of 2 hours. The solution was then allowed to cool to room temperature. Deionized water was then added to the solution to obtain a final solution volume of 125 mL in accordance with the procedure utilized by Smart et al., (2002).
According to Stewart, Miller, and Smart (2006) and Smart et al., (2002), the pH of the sample solution should be between 0.8 and 1.5 to ensure complete digestion of acid-neutralizing components. The pH values for S1, S2, S3, and S4 were 1.2, 1.0, 1.1, and 1.1 respectively.
The solution was then back-titrated to pH 5 using a predetermined molarity of sodium hydroxide (0.5 M NaOH). Two drops of 30 vol. % H2O2 were added at a pH of 5 to encourage the oxidation of ferrous iron and the precipitation of ferric hydroxide (Fe(OH)3) (Stewart, Miller, and Smart, 2006). Further back-titration was carried out to a pH of 7. The volume of NaOH used during the titration was recorded. Blanks were prepared using the procedure described above. Equation [15] was then used to determine the ANC (Smart et al., 2002).
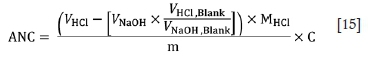
VHCl = Volume HCl acid used (mL)
VHCLBLANK = Volume of acid added to the blank (mL)
VNaOHBLANK = Volume of NaOH used (mL)
VNaOHBlank = Volume of NaOH added to the blank (mL)
MHCl = Molarity of HCl acid used (M)
m = Sample weight (g)
C = Conversion factor with a value of 49 to obtain the ANC in kg H2SO4 per ton.
Maximum potential acidity (MPA)
The total sulphide content was used to calculate the MPA (kg H2SO4 per ton) using Equation [16] to limit the overestimation of the MPA (Smart et al., 2002).

The total sulphur and sulphide weight percentages were determined using an ELTRA CS 2000 sulphur/carbon analyser, which consists of a weighing scale, a computer with the required programs, and an ELTRA induction and resistance furnace.
Net acid generation (NAG) test
The single-addition NAG test was conducted by adding 250 mL of 15 vol. % H2O2 with a pH of 4.5 to a 2.5 g (< 75 μm) coal sample. The H2O2 allows rapid oxidation of sulphide minerals. Unstabilized hydrogen peroxide with a pH of 4.5 was used instead of stabilized hydrogen peroxide with a pH of 3.5 to prevent misclassification (Stewart, Miller, and Smart, 2006; Weber et al., 2005). The hydrogen peroxide was allowed to react overnight, after which the solution was gently heated to encourage the oxidation of sulphide minerals that had not already oxidized. The solution was then heated for a period of 30 minutes at a temperature of 50°C to decompose the remaining hydrogen peroxide. The pH of the NAG solution was measured and is referred to as the NAGpH. The NAG solution was then titrated with a 0.1 M sodium hydroxide solution to a pH of 4.5 in accordance with the procedure utilized by Stewart, Miller, and Smart, (2006), Weber et al., (2005), and Smart et al., (2002). The volume of sodium hydroxide used (VNaOH), molarity of the sodium hydroxide solution (MNaOH), and sample weight (w) were used in Equation [17] to determine the NAG value.

A single-addition NAG test is appropriate for samples with a total pyritic-sulphur content of less than 1 wt % (Smart et al., 2002).
Kinetic NAG test
The kinetic NAG test involves adding 250 mL of 15 vol. % unstabilized hydrogen peroxide with a pH of 4.5 to a 2.5 g coal sample and recording the solution pH over time. The pH of the solution was measured until pH 4 was reached (this took approximately 3 hours). The time required for the solution to reach pH 4 is referred to as the kinetic NAG lag time (Smart et al., 2002).
Acid buffering characteristic curve (ABCC) test
The ABCC method involves adding 100 mL of deionized water to 2 g of < 75 μm coal sample in a 250 mL flask. The solution was incrementally titrated with a predetermined quantity and molarity of hydrochloric acid (Smart et al., 2002) while stirring continuously. After each addition of HCl, the solution was left for 17 minutes to allow the acid to react and the pH to equilibrate before recording the pH (Smart et al., 2002).
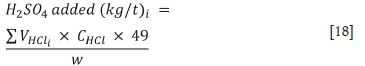
The concentration (CHCl) and volume (VHCl) of HCl used during incremental additions were then converted to the kg H2SO4 per ton equivalent using Equation [18] (Smart et al., 2002). The measured pH was plotted against the quantity of acid added to obtain the acid buffering characteristic curve.
Mineralogical characterization of the coal tailings
X-ray diffraction (XRD) and X-ray fluorescence (XRF) analyses were conducted at the XRD and XRF laboratory at the Centre of Water Science and Management, North-West University (NWU), Potchefstroom Campus.
The different crystalline phases present in the samples were identified and quantified using XRD, which is a nondestructive analytical technique. The samples were prepared using a back-loading method. The samples were then analysed using a PANalytical X'Pert Pro multipurpose diffractometer with X'Celerator detector and fixed slits, with Fe-filtered Co-Ka radiation.
A PANalytical Highscore+ program, ICDD PDF 4+ and PAN ICSD database were used to identify the crystalline mineral phases present in the samples. The Rietveld method was used to determine the relative phase amounts or quantities (wt %).
The concentrations of elements present in the coal sample were determined using XRF, which is a non-destructive analytical technique. The samples were prepared by drying them at a temperature of 105°C for 3 hours. The loss on ignition was determined using initiating high-temperature ashing by placing the samples in an oven at 1000°C until completely ashed. This was followed by a fifteen-minute borate fusion (0.3 g sample plus 6 g flux) using Claisse® 66:33 LiT:LiM (lithium tetraborate: lithium metaborate) flux with a Lil (lithium iodide) releasing agent in a platinum crucible.
The samples were analysed using a PANalytical (Axios Max) WD-XRF spectrometer equipped with a 50 kV Rh-anode X-ray tube, P10 gas purge facility, six filters, and a high-resolution silicon drift detector calibrated using national and international certified reference materials (CRMs). The XRF data was quantified using the intensities of the elements in the samples, which were calculated from the measured intensities.
Acid-neutralizing capacity based on mineralogy (ANCmin)
The total acid-neutralizing capacities of S1, S2, S3, and S4 based on mineralogy (ANCmin) were calculated using Equation [19], where ANCmin,c is the ANC based on carbonate minerals and ANCminnc is the ANC based on non-carbonate minerals (Karlsson et al., 2018).

The acid-neutralizing capacities of S1, S2, S3, and S4 based on the carbonate minerals (ANCminc) were calculated using Equation [20] (Karlsson et al, 2018).

ANCmin,c is the ANC contribution of carbonate minerals to the total ANCmin.
MWcand MWcminare the molar masses of carbon and carbonate mineral respectively (g/mol).
wt%c,min is the weight percentage of carbonate mineral in the sample.
CF is a conversion factor with a value of 0.98 to convert the unit of ANCmin from kg CaCO3 per ton to kg H2SO4 per ton.
Mineralogy MPA (MPAmin)
The mineralogical maximum potential acidity (MPAmin) was calculated by multiplying the weight percentage of acid-generating mineral in the sample with the weight percentage of sulphur in the mineral and a conversion factor, as in Equation [21] (Karlsson etal. 2018).
where wt%AGmin is the weight percentage of acid-generating mineral and wt%s,min is the weight percentage of sulphur in the acid-generating mineral.
Pyrrhotite was the only acid-generating mineral identified in all of the samples. A conversion factor of 30.6 was thus used to calculate the MPAmin of S1 as it has a pH of 7. A constant value of 15.3 was used to determine the MPAmin of S2, S3, and S4 as their paste pH values were below 7 (Karlsson et al., 2018).

Results and discussion
Paste pH
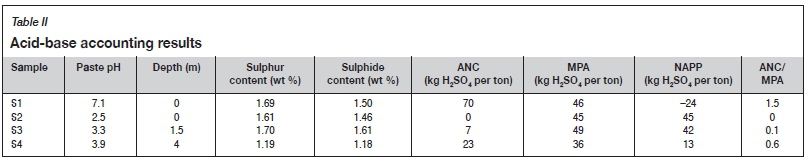
The high paste pH of the fresh tailings sample (S1), as seen in Table II, indicates that the fresh tailings possess acid-neutralizing capabilities. A considerable lag time can be expected before the onset of acid conditions if the acid-neutralizing capacity is overwhelmed by the acid-generating capabilities.
The low paste pH of samples S2, S3, and S4 shows that the tailings have become acidic and strongly suggests that the weathered tailings are potential acid-forming (PAF) and therefore likely to contain large quantities of stored acidity from prior acid generation. S2, S3, and S4 were collected at the surface of the tailings and at depths of 1.5 m and 4 m respectively.
As seen in Table II, the paste pH increases with the depth at which the samples were collected. The same trend of increase in paste pH with depth was observed by Nieva, Borgnino, and Garcia (2018). The increase in pH indicates that the rate and extent of oxidation decrease with depth, as a result of the limited availability of oxygen and water. It can thus be concluded that the tailings dump as a whole has not reached its maximum potential acid-generating capabilities and will continue to generate acid as water and oxygen penetrates deeper into the tailings.
Maximum potential acidity (MPA)
The MPA was determined using the total sulphide content instead of the total sulphur content so as to limit the overestimation of the MPA. The MPAs of S1, S2, S3, and S4 were obtained by multiplying the sulphide content with a factor of 30.6. The MPAs of S1, S2s and S3 do not differ much as their sulphide contents are similar. The sulphide content of S4 is lower than that of S1, S2, and S3, resulting in a lower MPA, illustrating how the mineralogy can differ within tailing deposits.
The sulphate minerals form as a result of the oxidation of sulphide minerals. The total sulphur content stays relatively constant as sulphides oxidize. However, the sulphide content decreases as sulphates form. Thus, the difference between the sulphur and sulphide contents provides an indication of the rate of oxidation and the extent of oxidation that has taken place. The difference between sulphur and sulphide content decreases with depth, indicating that the rate and extent of oxidation decreases with depth, confirming that the tailings have not reached their maximum acid-generating capabilities. In other words, the sulphide minerals in S2 have undergone oxidation to a greater extent than those in S3 and S4, as water and oxygen are more readily available at the surface of the tailings. The large difference between the sulphur and sulphide contents in S1 may be ascribed to the nature of the initial coal feed.
Acid neutralization capacity (ANC)
As seen in Table II, S1 has an ANC which is substantially higher than those of S2, S3, and S4, most likely due to the fact that S1 has not been exposed to the environment for such a prolonged period as the other samples. S2 has an ANC value of 0 kg H2SO4 per ton based on the ABA results, suggesting that most of the readily available acid-neutralizing components have been consumed to depletion. Consequently, any acid generated by the top layer of the tailings (S1) will proceed to leach deeper (depending of the permeability) into the tailings, promoting acid-generating conditions.
Net acid production potential (NAPP) and MPA/ANC ratio
As seen in Table II, S1 has a NAPP of -24 kg H2SO4 per ton and can thus be classified as non-acid forming (NAF) or as uncertain (UC) as it has an ANC/MPA ratio of 1.5 according to the ABA classification criteria stipulated in Sobek et al. (1978) and Usher et al. (2003). S2 and S3 have NAPP values that are substantially larger than 20 kg H2SO4 per ton and extremely low ANC/MPA ratios, providing a strong indication that they will be potential acid-forming (PAF) samples. The NAPP of 13 kg H2SO4 per ton of S4 creates a small uncertainty with respect to its acid-generating capabilities. S4 can be classified as uncertain based on the NAPP results, or as PAF as it has an ANC/MPA smaller than unity (Sobek et al., 1978; Usher et al., 2003).
Acid buffering characteristic curve (ABCC)
Figure 1 is a plot of the ABCC curve of S1. As seen, S1 effectively neutralizes acid, with the pH initially decreasing gradually and then sharply dropping after the equivalent of about 15 kg H2SO4 per ton has been neutralized. The pH of S1 drops below 4 after approximately 23 kg H2SO4 per ton has been neutralized. S1 continues to neutralize an additional 12 kg H2SO4 per ton before the pH reaches 2.5.
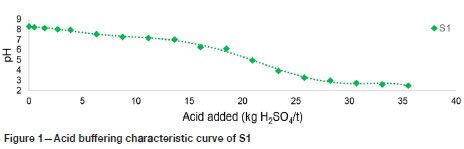
The rate of acid generation increases exponentially as the pH drops below 4, owing to the oxidation of sulphide minerals by ferric iron. For this reason, the readily available or effective ANC obtained from the ABCC curve is determined at a pH of 4. Thus, the readily available ANC of S1 can be assumed to be 23 kg H2SO4 per ton, indicating that only 33% of the ANC determined using the ABA method is readily available to neutralize acid.
The ABCC curves of S2, S3, and S4 can be seen in Figure 2. S2 has a pH value below 4 before any acid has been neutralized. The ABCC of S2 suggests that S2 has no effective acid-neutralizing capabilities, confirming the ANC of 0 kg H2SO4 per ton determined by ABA. S2 has the ability to neutralize about 4 kg H2SO4 per ton before the pH drops below 2.5, but this is considered to be negligible owing to the fact that acid generation increases dramatically when the pH drops below 4. This could result from the oxidation of sulphide minerals by ferric iron as discussed previously.
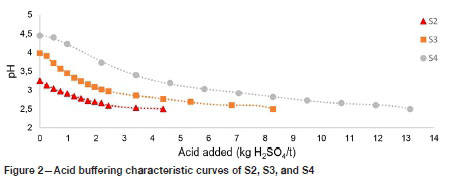
The ABCC of S3 starts at a pH just above 4 and effectively neutralizes about 8 kg H2SO4 per ton before the pH drops below a value of 2.5, confirming the ANC of 7 kg H2SO4 per ton obtained by ABA. However, the pH of ABCC of S3 drops below 4 after a small amount of acid has been neutralized, suggesting that S3 has a small and insignificant readily available ANC. It is thus assumed that S3 has an effective or readily available ANC of 0 kg H2SO4 per ton based on the ABCC estimation.
S4 neutralizes about 13 kg H2SO4 per ton before the pH of the ABCC curve drops below 2.5, as seen in Figure 2. However, the pH of S4 drops below a value of 4 after the equivalent of 2 kg H2SO4 per ton has been neutralized. This suggests that only about 10% of the ANC obtained from ABA will be readily available to neutralize acid. The effective ANC of S4 is thus assumed to be 2 kg H2SO4 per ton based on the ABCC curve results.
The ANC results determined using the ABA and ABCC methods are summarized in Table III. As seen, the effective ANCs of S1, S3, and S4 are overestimated when comparing the ANC obtained by the ABA method to the effective ANC obtained from the ABCC at a pH of 4. The ABCC results point out that only 33%, 0%, and 10% of the ANCs of S1, S3, and S4 respectively, determined using the ABA method, are readily available to neutralize acid and maintain the pH above 4. S2 and S3 both have an effective ANC of 0 kg H2SO4 per ton, because they do not possess adequate ANC to maintain a pH above 4. S1 and S4 have effective ANCs of 23 kg H2SO4 per ton and 2 kg H2SO4 per ton respectively.
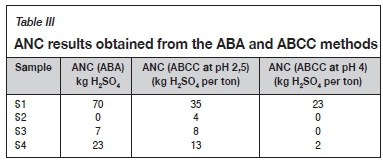
The ABA method of determining the ANC of a sample involves digesting the sample in highly concentrated acid and heating it at high temperature to encourage the acid-neutralizing components to react. The conditions under which the ANC was determined using the ABA method enable minerals to contribute to the ANC that would not contribute to acid neutralization under normal environmental conditions, resulting in the overestimation of the ANC using the ABA method (Bouzahzah et al., 2015; Stewart et al., 2006).
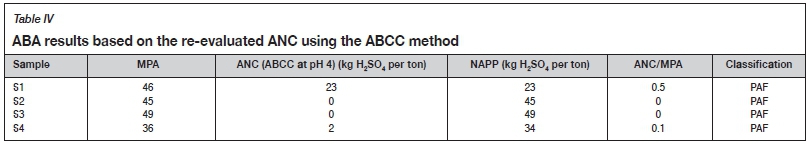
As seen in Table III, S1, S2, S3, and S4 possess the ability to neutralize acid in a pH range of 2.5-4. The ANC contribution in this pH range can be regarded as negligible due to the oxidation of sulphide minerals by ferric iron as previously discussed (Dold, 2017). The re-evaluated ABA results based on the ANC determined from the ABCC at a pH of 4 are summarized in Table IV.
As seen in Table IV, S1, S2, S3, and S4 are classified as PAF as they have NAPP > 20 kg H2SO4 per ton and ANC/MPA < 1 (Sobek et al., 1978; Usher et al., 2003). The samples were classified as PAF using the re-evaluated ABA results and ABA classification criteria.
Using the effective ANC obtained from the ABCC at a pH of 4 resulted in the reclassification of S1 and S4 acid-generating capabilities from uncertain to PAF, as seen in Table IV.
Using the ANCs of S2 and S3 obtained from the ABCC did not influence the classification of these samples as they were classified as PAF before the ANC was evaluated using the ABCC method, as seen in Table II.
Net acid generation (NAG) test results
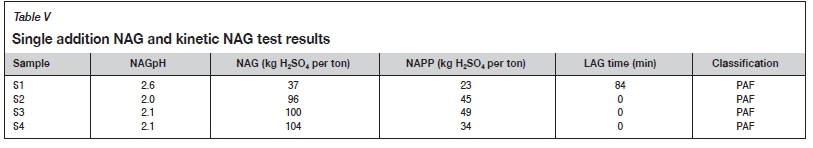
The single-addition NAG and kinetic NAG test results are summarized in Table V.
As seen in Table V, the NAG results are extremely high compared to the NAPP results. The NAG overestimates the actual acid-generating capabilities of the samples, most likely due to the organic acid effect (Pope et al., 2010). Thus, the NAPP provides a more accurate estimation of the acid-generating capabilities of the samples. All the samples have a NAGpH below 4.5, indicating that all the samples are PAF (Smart et al., 2002). S1, S2, S3, and S4 have NAGpH values < 4.5, suggesting that they are PAF.
Figure 3 is a plot of the kinetic NAG results of S1, S2, S3, and S4. As seen, the NAG solution pH of S1 drops below 4 after 84 minutes. A lag time of 84 minutes corresponds to a lag time between 6 and 12 months in a leach column (Stewart, Miller, and Smart, 2006). The NAG values of S2, S3, and S4 drop below pH 4 instantaneously, as seen in Figure 3, suggesting that there will be no lag time before the onset of acidic conditions.
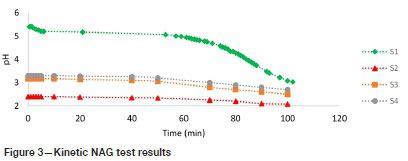
The paste pH results of S2, S3 and S4 are below 4, as seen in Table II, confirming that acidic conditions have prevailed with no lag time and thus confirming the kinetic NAG results.
As seen in Table V, S1, S2, S3, and S4 have positive NAPP and NAGpH values below 4.5 and are subsequently classified as PAF according to the criteria stipulated by oh et al. (2017) and Smart et al. (2002. The relatively high NAPP values suggest that a large quantity of acid will be generated.
Neutralization and acidity potential based on the mineralogy of the coal tailings
The mineralogy of each sample is summarized in Table VI. The acid-neutralizing minerals identified are calcite, kaolinite, muscovite, and quartz. Kaolinite, muscovite, and quartz are extremely inactive and will make an insignificant contribution to the ANC under normal conditions owing to their low reactivity (Karlsson et al., 2018). Calcite is the most important acid-neutralizing mineral, and as seen in Table VI will contribute the most to the ANC owing to the absence of other neutralizing minerals such as magnesite, dolomite, brucite, aragonite, and olivine.
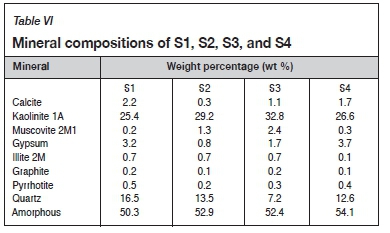
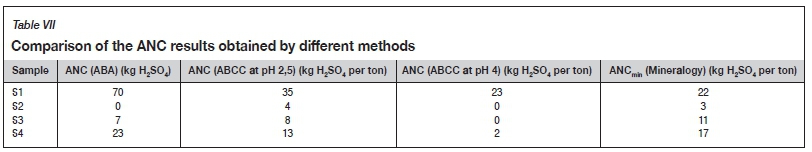
The calcite content was used to calculate the mineralogical ANC (ANCmin) and is summarized in Table VII, together with the ANC values determined using ABA and from the ABCC at pH 4 and 2.5.
It can be seen that ABA dramatically overestimates the ANC of S1. The ANC of S1 obtained from the ABCC curve at pH 4 (Figure 1) is similar to the ANCmin. The ANC obtained from the ABCC at pH 4 and ANCmin will thus be a more accurate representation of the actual acid-neutralization potential of S1.
The ANCmin values for S2, S3, and S4 are similar to the ANC obtained from the ABCC at a pH of 2.5 and somewhat similar to the ANC determined by ABA. ANCmin confirms that S2, S3, and S4 do possess the ability to neutralize acid. The calcite contents of S2 and S3 are relatively low and do not contribute to acid neutralization to the extent that the pH of the tailings will be maintained above 4. Only 11% of the ANCmin of S4 contributes to acid neutralization, maintaining the pH above 4. The ANCmin provided a reasonably accurate estimation of the ANC of S1, S2, S3, and S4. However, the ANCmin overestimates the effective ANC. The actual or effective ANC determined from the ABCC at pH 4 for S2, S3 and S4 is 0, 0, and 2 kg H2SO4 per ton for S2, S3, and S4 respectively.
Pyrrhotite is the only acid-generating sulphide mineral present in S1, S2, S3, and S4 as seen in Table VI. The MPA values calculated based on the pyrrhotite content are summarized in Table VIII.
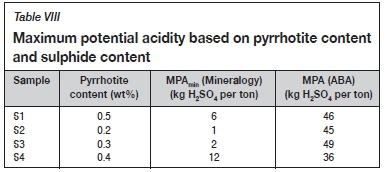
A comparison of the MPA determined by the ABA method based on total sulphide content and the MPAmin calculated using the pyrrhotite content (Table VIII) shows that the ABA method overestimates the true MPA drastically.
The ABA method for determining the MPA is based on the assumption that the total sulphide content occurs as pyrite. There is, however, no pyrite in the samples and most of the sulphur occurs as gypsum (Table VI), which is a non-acid-forming sulphate mineral. The MPAmin will thus be a more accurate estimation of the true MPA of the samples. Assuming that the total sulphur or sulphide content occurs only in the form of pyrite thus leads to a drastic overestimation of the true MPA of the samples.
The MPAmin method for determining the MPA of a sample assumes that pyrrhotite is oxidized by oxygen. Oxygen will be the primary oxidant of pyrrhotite in S1 owing to the neutral paste pH of S1. Ferric iron will be the primary oxidant in the case of S2, S3, and S4 as their paste pH values are below 4. The MPAmin of S2, S3, and S4 can be up to four time larger if ferric iron is assumed to be the primary oxidant.
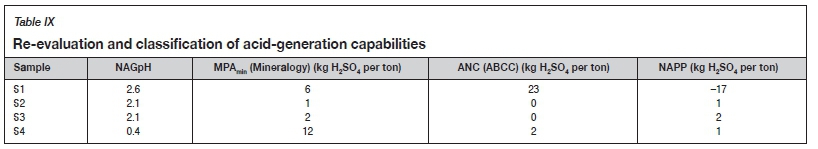
The effective ANC values obtained from the ABCC at a pH of 4 and MPA based on the pyrrhotite content (MPAmin) were used to recalculate the NAPP values of S1, S2, S3, and S4 (Table IX). The recalculated NAPP and NAGpH were used to re-evaluate the acid-generation capabilities of S1, S2, S3, and S4 in order to reclassify the acid-generating capabilities according to the ABA and NAGpH criteria used by Oh et al. (2017) and Smart et al. (2002).
The acid-generating capabilities of S1 are classified as uncertain due to the disparity between the NAPP and the NAGpH results (NAPP < 0, NAGpH < 4.5). S2, S3, and S4 are all classified as PAF as their NAPP values are positive and their NAGpH values are below 4.5. The MPAmin values of S2, S3, and S4 are relatively low and these samples will thus have a low acid-generating capacity.
ABA, NAG, ABCC, and mineralogy are suitable for preliminary AMD screening. However, more detailed investigations should be conducted to assess and predict the possible occurrence of metal-rich neutral mine drainage with respect to S1 (Dold, 2017).
Conclusion and recommendations
ABA and mineralogical investigations were used to determine the AMD formation potential of four coal tailing samples (S1, S2, S3, and S4). It was found that the ABA method could not yield conclusive results, as the ANC and MPA of the samples were dramatically overestimated using this method. However, the ABCC test and calculations based on the mineralogy of the samples provided a more accurate estimation of the true or effective ANC of the samples, while the MPAmin gave a more accurate estimation of the actual MPA. The results obtain with these considerations allowed us to classify the samples as potentially acid-forming. From the paste pH values, S2 was the sample that could most readily form acid; this is probably due to the fact that it originated from the tailing layer that was the most exposed to weathering conditions. Using a single test to classify the acid-generating capabilities may have resulted in a misclassification of the samples acid-generating capabilities.
Further tests such as the leach column test should be conducted to determine the true acid-generating capability of S1. Effective measures should be taken to prevent the fresh coal tailings from becoming acidic and generating AMD if S1 is found to be potentially acid-forming.
Acknowledgements
The authors acknowledge and appreciate the sponsorship from North-West University.
References
Blowes, D.W., Ptacek, C., Jambor, J., Weisener, C., Paktünc, D., Gould, W., and Johnson, D. 2013. The geochemistry of acid mine drainage. Treatise on Geochemistry. 2nd edn. Turekian, K. and Holland, H. (eds). Elsevier Science, Reston, VA. pp. 131-190. [ Links ]
Bouzahzah, H., Benzaazoua, M., Plante, B., and Bussiere, B. 2015. A quantitative approach for the estimation of the 'fizz rating' parameter in the acid-base accounting tests: A new adaptation of the Sobek test. Journal of Geochemical Exploration, vol. 153. pp. 53-65. [ Links ]
Dold, B. 2010. 2010. Basic concepts in environmental geochemistry of sulphide mine waste management. Waste Management. Kumar, E.S. (ed.). InTech, Rijeka, Croatia. 173-198. [ Links ]
Dold, B. 2017. Acid mine drainage prediction: A critical review. Geochemical Exploration, vol. 172. pp. 120-132. [ Links ]
Fosso-Kankeu, E. 2019. Coal tar production processes and potential of PAHs release into the environment. Editors: Elvis Fosso-Kankeu, Frans Waansders, Hemant Kumar Bulsara. Proceedings of the 17th Johannesburg International Conference on Science, Engineering, Technology and Waste Management (SETWM-19), Johannesburg, South Africa. 18-19 November 2019. Vol. II. IEEE Computer Society, New York. pp. 247-251. [ Links ]
Fosso-Kankeu, E., Manyatshe, A., Munyai, A., and waanders, F. 2016. AMD formation and dispersion of inorganic pollutants along the main stream in a mining area. Proceedings of IMWA 2016: Mining Meets Water - Conflicts and Solutions, TU Bergakademie Freiberg. Drebenstedt, C. and Paul, M. (eds). International Mine Water Association, Wendelstein, Germany. pp. 391-397. [ Links ]
Fosso-Kankeu, E. 2016. Investigation of the oxidation rate of sediments from AMD using humidity cell test. International Conference on Advances in Science, Engineering, Technology and Natural Resources (ICASETNR-16) Nov. 24-25, 2016, Parys - South Africa. ISBN: 978-93-84468-79-8. pp. 88-92. [ Links ]
Fosso-Kankeu, E., Manyatshe, A., and waanders, F. 2017. Mobility potential of metals in acid mine drainage occurring in the Highveld area of Mpumalanga Province in South Africa: Implication of sediments and efflorescent crusts. International Biodeterioration and Biodegradation, vol. 119. pp. 661-670. [ Links ]
Fosso-Kankeu, E., Mulaba-Bafubiandi, A., Mamba, B.B., and Barnard, T.G. 2011. Assessing the effectiveness of a biological recovery of nickel from tailings dumps. Minerals Engineering, vol. 24, no. 5. pp. 470-472. [ Links ]
Hancox, P. and Götz, A. 2014. South Africa's coalfields - A 2014 perspective. International Journal of Coal Geology, vol. 132. pp. 170-254. [ Links ]
Jambor, J.L. 1994. Mineralogy of sulfide-rich tailings and their oxidation products The Environmental Geochemistry of Sulfide Mine Wastes. Blowes, D.W. and Jambor, J.L. (eds). Mineralogical Association of Canada, Waterloo, Ontario. pp. 59-102. [ Links ]
Kalin, M., Fyson, A. and Meinrath, G. 2006. Natural iron hydroxide precipitates: Their acid generation potential in ground water associated with tailings. Proceedings of the 7th International Conference on Acid Rock Drainage (ICARD). American Society of Mining and Reclamation (ASMR), Lexington. pp. 885-901. [ Links ]
Karlsson, T., Ràisànen, M., Lehtonen, M., and Alakangas, L. 2018. Comparison of static and mineralogical ARD prediction methods in the Nordic environment. Environmental Monitoring and Assessment, vol. 190, no. 12. pp. 1-29. [ Links ]
Koch, J., Chakraborty, s., Lí, B., Kucera, J., Van Deventer, P., Daniell, A., Faul, C., Man, T., Pearson, D., Duda, B., Weindorf, C., and Weindorf, D. 2017. Proximal sensor analysis of mine tailings in South Africa: An exploratory study. Journal of Geochemical Exploration, vol. 181. pp. 45-57. [ Links ]
Lí, Y., Lí, W., Xiao, Q., song, s., Liu, Y., and Naidu, R. 2018. Acid mine drainage remediation strategies: A review on migration and source controls. Minerals & Metallurgical Processing, vol. 35, no. 3. pp. 148-158. [ Links ]
Moses, C., Kirk Nordstrom, D., Herman, J., and Mills, A. 1987. Aqueous pyrite oxidation by dissolved oxygen and by ferric iron. Geochimica et Cosmochimica Acta, vol. 51, no. 6. pp. 1561-1571. [ Links ]
Nieva, N., Borgnino, L., and Garcîa, M. 2018. Long term metal release and acid generation in abandoned mine wastes containing metal-sulphides. Environmental Pollution, vol. 242. pp. 264-276. [ Links ]
oh, C., Ji, s., Chon, C., Yim, G., and Cheong, Y. 2017. Reliability improvement for predicting acid-forming potential of rock samples using static tests. Environmental Monitoring and Assessment, vol. 189, no. 5. pp. 1-13. [ Links ]
Pope, J., Weber, P., Mackenzie, A., Newman, N., and Rait, R. 2010. Correlation of acid base accounting characteristics with the geology of commonly mined coal measures, West Coast and Southland, New Zealand. New Zealand Journal of Geology and Geophysics, vol. 53, no. 2-3. pp. 153-160. [ Links ]
simate, G. and Ndlovu, s. 2014. Acid mine drainage: Challenges and opportunities. Journal of Environmental Chemical Engineering, vol. 2, no. 3. pp. 1785-1803. [ Links ]
skousen, J. 2017. A methodology for geologic testing for land disturbance: Acid-base accounting for surface mines. Geoderma, vol. 308. pp. 302-311. [ Links ]
smart, R., skinner, B., Levay, G., Gerson, A., Thomas, J., schumann, H., Weisener, C., and Weber, P. 2002. ARD Test Handbook. 1st edn. AMIRA International, Melbourne, VIC.: pp. 1-42. [ Links ]
sobek, A., shuller, W., Freeman, J., and smith, R. 1978. Field and Laboratory Methods Applicable to Overburdens and Mine Soils. 1st edn. Industrial Environmental Research Laboratory, Office of Research and Development, US Environmental Protection Agency, Washington, DC. 204 pp. [ Links ]
stewart, W., Miller, s., and smart, R. 2006. Advances in acid rock drainage (ARD) characterisation of mine wastes. Proceedings of the 7th International Conference on Acid Rock Drainage (ICARD). America Society of Mining and Reclamation (ASMR). pp. 2098-2119. [ Links ]
Usher, B., Cruywangen, L., De Necker, E., anD Hodgson, F. 2003. On-site and laboratory investigations of spoil in opencast collieries and the development of acid-base accounting procedures. Institute for Groundwater Studies, University of the Free State, Bloemfontein, South Africa. 347 pp. [ Links ]
Wang, H., Dowd, P., and Xu, C. 2019. A reaction rate model for pyrite oxidation considering the influence of water content and temperature. Minerals Engineering, vol. 134. pp. 345-355. [ Links ]
Weber, P., Thomas, J., skinner, W., and smart, R. 2005. Calculated acid base balance for H2O2 oxidation of carbonate-poor pyritic mine-rock. Canadian Mineralogist, vol. 43, no. 4. pp. 1193-1203. [ Links ]
 Correspondence:
E. Fosso-Kankeu
Email: Elvis.FossoKankeu@nwu.ac.za; elvisfosso.ef@gmail.com
Received: 30 Apr. 2020
Revised: 24 Sep. 2020
Accepted: 22 Oct. 2020
Published: November 2020

