


Services on Demand
Article
 English (pdf)
 Article in xml format
 Article references
Indicators

Related links
-
 Cited by Google
 -
 Similars in Google
Share

 Permalink
Journal of the Southern African Institute of Mining and Metallurgy
On-line version ISSN 2411-9717
Print version ISSN 2225-6253
J. S. Afr. Inst. Min. Metall. vol.120 n.10 Johannesburg Oct. 2020
http://dx.doi.org/10.17159/2411-9717/1256/2020
PAPERS OF GENERAL INTEREST
The impact of equipment productivity and pushback width on the mine planning process
A.S. ArayaI; M. NehringII; E.T. VegaIII; N.S. MirandaIV
IDepartment of Metallurgical and Mining Engineering, Universidad Católica del Norte, Antofagasta, Chile
IISchool of Mechanical and Mining Engineering, The University of Queensland, St Lucia, QLD, Australia. https://orchid.org/0000-0002-0404-5332
IIIDepartment of Metallurgical and Mining Engineering, Universidad Católica del Norte, Antofagasta, Chile
IVDepartment of Metallurgical and Mining Engineering, Universidad Católica del Norte, Antofagasta, Chile
SYNOPSIS
Conventional mine planning processes result in the selection of pushback widths that maximize equipment productivity. This paper challenges the current notion that pushback width should be set at the distance that assures maximum equipment productivity. A hypothetical case study is presented, which shows that the value of a project may increase beyond that determined by traditional planning practices. It was found that it may be better to deploy more aggressive mining strategies, which are likely to result in greater operational complexity and thus reduced equipment productivity. A higher equipment productivity, which often corresponds to wider (and therefore a lower number of) pushbacks, will also often result in later ore extraction and require higher capital costs.
Keywords: open pit mining, pushback width, mine planning, schemes of exploitation, mining rate, equipment utilization.
Introduction
The value that is generated during the mining planning process should take into account multiple variables that interact with each other in a very complex system. One of the complexities of this task involves investigating the impact of different strategies on the economic value of the project, and finally identifying the optimum strategy while evaluating multiple trade-offs to increase the value of the mining business.
The open pit optimization process is generally completed in three sequential steps. Firstly, the final pit is defined. Secondly, the pushbacks that provide the exploitation sequence are defined. Finally, the production schedule is generated. Computer software and other tools are available to aid the decision-making process across these steps; however, the experience and aversion to risk of the planning team will determine the final mine plan.
This paper indirectly focuses on the second step of the process described. It addresses the impact of equipment productivity and associated mining rate, which in turn results from an alteration in pushback width. It is commonly accepted that the minimum width that maximizes equipment productivity and thus the mining rate should be used in pushback design. This is the geometrical width at which equipment is able to transit and operate without major difficulties. This width generally results in high equipment productivities and mining rates, which leads to reduced operating costs.
The increase in the size of equipment and therefore the need for additional working space has resulted in an increase in the width of pushbacks over time. During this investigation, mine planners from Chile's mining industry were contacted, who asserted that after considering geomechanical variables and targeted ore feed to a process plant, the minimum width of each pushback was usually never less than 80 m, as operation of the equipment for high productivity was assured at this width.
This paper challenges the current notion that pushback width should be set at the distance that assures high equipment productivity. This project considered the evaluation of pushback width that is not reliant solely on optimal equipment performance, but driven more by the time related to accessing cash flows. This evaluation includes schemes that may be considered more aggressive in that they maintain a higher sinking rate in the operation.
Background
Mine planning is one of the tasks where it is possible to add considerable value to a mining business.
The work has to associate all the different processes in the mining value chain (Figure 1). For this, there are different techniques available depending on the company's objectives and strategy, e.g. maximizing the NPV, extending the life of the mine, and minimizing risks, among others. However, regardless of the objectives to be attained, the working sequence for long-term mine planning (LMP) is similar in any company. Figure 2 shows a simplified diagram of the LMP process for the case of an open pit mine, not considering the cyclicality of the process.
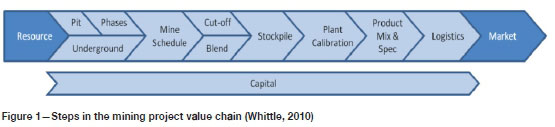
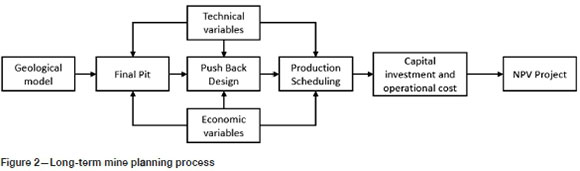
Figure 2 shows that after the processes that define the geological model and final pit, the next step is to design the pushbacks, or phases, and their proper scheduling and extraction sequencing. Finally, the necessary investments and mining operational costs are determined, with which the project must be re-evaluated to give the project's NPV. The multiple variables that must be considered for the determination of the project, in addition to the cyclicality of the process, generate difficulties in the actual evaluation of the impact of these variables on the project's NPV and its optimization.
According to Castillo (2009), the problem of open pit mining optimization can be approached from at least two perspectives in mine planning. The first is a traditional approach, and the one most used by the industry. It starts with the definition of the final pit, then divides the pit into phases or pushbacks, and finally determines the extraction sequence. A variation of this first approach establishes the sequencing after the definition of the final pit, and this information is then used to define the project's pushbacks. A second approach is 'integral block sequencing'. This new approach aims to determine the ideal block extraction sequence at the same time that the final pit limits are defined, but this approach is still being developed.
Final pit
After defining the mining resources, the future economic variables must be defined, and with them the ore reserves that will establish the economic feasibility of the project are generated. It is possible to define the final pit as the resulting shape, projected from the extraction of the ore and waste from an ore deposit, that maximizes the NPV of an open pit project.
Two algorithms are normally used to determine the final pit, and both work with the block model that contains the geological information. Both algorithms positively or negatively evaluate the blocks to be mined. The first, based on graph theory, is the Lerchs-Grossmann algorithm (Lerchs and Grossmann, 1964). The algorithm considers the spatial position of the block and its content (grade), and evaluates the extraction of a block considering all the blocks immediately above that need to be extracted to extract that block. Finally, the Lerchs-Grossmann algorithm indicates the envelope and final shape of the extraction that would maximize the project's economic value. Another algorithm commonly accepted in the mining industry is the Kovorov algorithm, usually known as the floating cone algorithm. This algorithm works by positioning an inverted cone around the blocks with a positive economic value, and then calculates the result of extracting a block, considering all the blocks that are inside the cone that must be removed. Some authors have discussed this algorithm and presented modifications for improving it in the last few years.
Pushbacks
Phases or pushbacks can be defined as each of the divisions that can be generated between the surface and the final pit in a mining project; as whole, they are also called nested pits. The generation of pushbacks is one of the first tasks in the mine planning process, and it divides the final pit into more manageable units for the various mine planning stages and evaluations (Couzens and Pincock, Allen & Holt, 1970; Hustrulid, Kuchta, and Martin, 2013; Meagher, Dimitrakopoulos, and Avis, 2014). In addition, using pushbacks can lead to an increased NPV while minimizing the stripping ratio for the project, depending on the characteristics of the mineralization and dimensions of the final pit (Sabanov and Bearre, 2015).
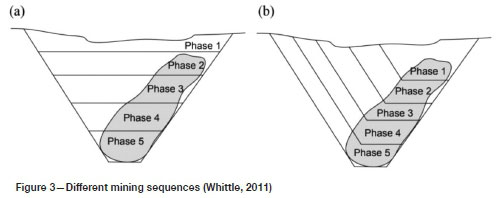
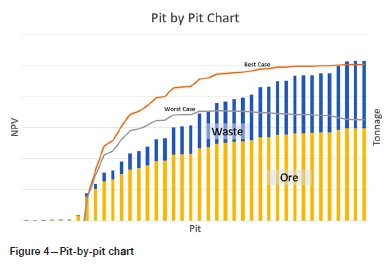
The definition of pushback contains the 'worst case' and 'best case' concepts, which are explained by David Whittle (2011). Both terms refer to the order of exploitation of an ore deposit. The 'worst case' (Figure 3a) is when an ore deposit is removed sequentially bench by bench, that is, the upper bench is completely extracted and once this is completed extraction of the bench immediately beneath follows. This extraction strategy gives the lowest NPV for the project because the ore cannot be accessed until a large amount of waste is removed (upper benches). In the 'best case' (Figure 3b) the ore deposit is mined sequentially pit by pit (nested pits, phases, or pushbacks), which generates the best NPV for the project because access to the ore is achieved quickly. The difference in the NPVs generated by the 'worst case' and the 'best case' determines the feasibility of, or opportunity for, applying a pushback. If the NPV is similar for both cases, the implementation of a pushback will not add value to the project. However, if there is a difference between the cases, the implementation of a pushback should be studied. The analysis is done by means of a pit-by-pit chart (Figure 4).
Mathieson (1982, cited by Hustralid, 2013), indicates that three aspects should be considered before starting to define a project's pushback: (1) The geomechanical variables; for example, final pit angles, inter-ramp angles, and bench face angles; (2) the maximum extraction rate required of the pushback (ore and waste); and (3) the size and type of operating equipment, which determines the minimum width requirements of the operational benches. If the geomechanical conditions are favourable for any design and the rate of extraction required is achieved by the fleet of equipment available, the final design of the pushback is restricted to the minimum space required to operate the equipment.
According to Crawford (2001, cited by Songolo, 2010), some factors can affect pushback width, and the minimum possible design width depends on them:
> The flexible operation of equipment. If the operation is flexible, the mine can have more faces and this provides a greater selection of ores with different properties, in addition to simplifying balancing of the waste and ore feeds. If there are more faces, a problem at one face will not stop production; instead, the other faces can be exploited.
> The ease with which scheduling can be achieved. Multiple faces could cause problems for the mine planners, who have to be certain that the upper level worked on does not overtake the lower levels.
> The mine operating costs. Productivity in large spaces is higher than in small ones, therefore the cost is lower. Mine planners often design using this approach for the evaluation of the initial plan.
> Slope stability. Typically, narrower pushbacks generate shallower overall pit slopes than wider pushbacks. Wider pushbacks are often used at the ultimate slope design limits, where failures can occur, and can be used early in the life of the mine to test the ultimate slopes.
> Deposit geometry and stripping ratio. The costs of different pushbacks can be similar or vary, depending on the orebody shape. Two pushbacks may contain different amounts of ore and waste.
> Cost of capital at the corporate level. Companies have to be aware of the cost of using narrower pushbacks, especially when making decisions about this indicator. This approach can have higher operating costs than wider pushbacks, but a strategic mix using both in line with the fluctuation of the commodity price could be considered.
> Spatial continuity of ore zones. A well-defined disseminated deposit involves a lower risk than an erratic deposit. Therefore, a narrower pushback increases the risk if the deposit is erratic due to the possibility of not finding the ore, or it not being completely exposed for stripping.
> Management preferences. The decision regarding which approach to use depends on the complexity of the company. The concern of small businesses is commonly their daily operation. In larger companies with more specialized engineering capabilities, the approach involves sophisticated simulations of different strategies
There are several proposals for generating pushbacks. In his thesis project, Ramazan (1996) reviewed the different algorithms proposed for that period and proposed a new one. His project finally tested them in two study cases. All the algorithms studied gave different results for both cases and none of them considered pushback width as an important variable. Meagher, Dimitrakopoulos, and Avis (2014) reviewed open pit mining design, pushbacks, and the gap problem. This last term is used to describe the size inconsistencies that occur between two successive pushbacks. This research concluded that it is important to develop algorithms that project or use a determined size for the phases to eliminate the gap problem and obtain the optimal NPV.
Currently, to resolve the problem of defining pushbacks, mining engineers divide the problem into two parts. The first, and one of the most widely used methods, is the variation of economic conditions such as commodity prices, costs, or cutting grades. This method consists of first assigning low values and then gradually increasing them. If it is decided to vary the price of the commodity, for example from a low value to a high value (a technique often used by software packages), a number of pits can be generated, increasing the size each time and reducing the average value of the ore constituents of interest contained in the pit (Dagdelen, 2001). The second step is to select the appropriate pushback for the project, but this decision is the responsibility of the supervising engineer and is done by trial and error, considering the project's needs and objectives.
According to Meagher, Dimitrakopoulos, and Avis (2014), the current pushback design methods present at least four problems, leading to a suboptimal production schedule:
> The grade and ore quality requirements are not considered in the design
> The uncertainty of the in-situ grade is ignored
> There are large variations in the size of the pushbacks
> They do not consider the discounted value during optimization and assume that a 'greedy' approach will maximize the discounted value.
Finally, it is possible to identify the practical steps for pushback design. The process consists of first determining whether a pushback should be implemented (from the difference between the best and worst cases), followed by the evaluation, using a computer tool, of the pushback section for the project. At the same time, the project's requirements and restrictions (technical and economic) must be defined, and finally, after cross-validation and several tests, the pushback that can improve the value of the project can be selected or modified.
Equipment operation and requirements
Industry trends show a progressive increase in the capacity and dimensions of mining equipment. This directly affects the operational design of a mine and its extraction schedule, both tasks that are the purview of mine planning. Currently, there are mining industry trucks with capacities of over 267 m3 and electric shovels with bucket capacities of up to 67 m3. The dimensions in area units exceed 140 m2 for trucks and 225 m2 for loading equipment. This is the result of economies of scale that affect the system (Bozorgebrahimi, Hall, and Morin, 2005; Rojas Seguel, Castillo, E., and Cantallopts, 2015) and their impact on the reduction of operating costs is of considerable interest to mining companies, especially in times of low commodity prices (Bozorgebrahimi, Hall, and Blackwell, 2003).
The growing trend in the work capacity of mining equipment has undoubtedly had a considerable impact on mining and operations design as the dimensions of the equipment must be considered in the mine planning process for effective performance.
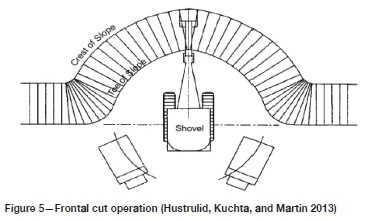
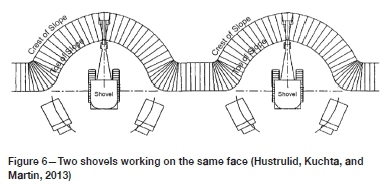
Hustrulid (2013) explains the strategies for the expansion process that are directly related to pushback width design. Figures 5 and 6 show the frontal cut approach, which comprises a frontal cut to the face of the bench. This option is usually used to start a new mine level. This strategy can be used in large spaces where it is necessary to expand exploitation over large, horizontal directions. When the space is sufficient, more than one item of equipment (shovel) is usually used in the sectors where this is feasible (Figure 6).
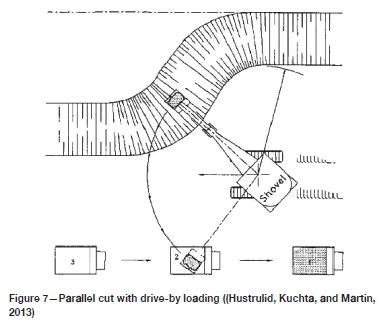
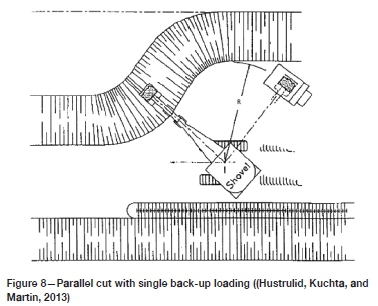
For mine expansions in which work must be done in limited spaces, the strategy that is used comprises parallel advance to the face of the bench. This strategy entails variants in the transit of trucks. Figure 7 shows a shovel advancing parallel to the bench with truck traffic in parallel. Figure 8 shows a shovel advancing parallel to the bench, but this time with the transit from or to the shovel; once the truck is loaded with the material it must return along the route it used to enter the sector.
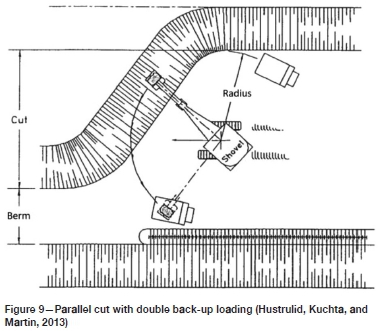
The operating costs for loading and haulage are directly related to the speed with which the material is loaded and transported from the extraction point to its final destination. When considering the strategy to be used in the operation, loading from both sides of the power shovel, which increases productivity by reducing waiting times for truck positioning, should be considered. However, it also increases the space requirements for the operation (Figure 9).
Production scheduling
To calculate the value of a mining project, an extraction sequence must first be decided on, and then the pit must be extracted conceptually, accumulating income and costs as it progresses. If the time value of money is to be included, that is, the fact that one dollar today is more valuable than one dollar next year, then revenues and costs must be discounted by a factor that increases over time ( Whittle, 1990).
The objective of production scheduling of a mining project is to maximize the present value and return on investment that could be derived from the extraction, concentration, and sale of a commodity from an ore deposit (Bohnet, 1990). To achieve this, the block removal sequence must be determined, considering the year in which it has to be removed (Mousavi Nogholi, 2015).
Typically, once the final pit and pushback have been defined, the extraction schedule is defined. This process depends on the information provided by the pushback design. Some proposals have been published and discussed, but this topic is currently being developed.
Case study
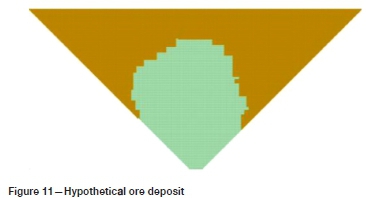
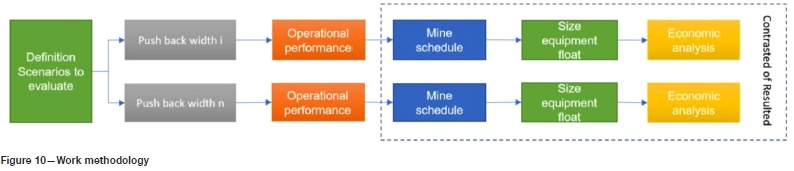
The evaluation methodology for this work considers a common hypothetical ore deposit (with the same block model and final pit) for testing different scenarios. The equipment to be used in the different pushback designs also remain the same, however, its performance will vary with the bench width it is operating on. After defining and designing all the pushbacks, the next step is to determine the production plan for each case. The production plan is used to calculate the mining equipment required for each scenario. Finally, the NPV for each design is calculated and the results are compared (Figure 10).
The block size for the hypothetical deposit is 5x5x5 m. The model is 1555 m long, 1500 m wide, and 750 m deep. The density of the rock is considered to be fixed at 2.6 t/m3.
The same mineralization and basic design parameters are considered for all cases. The deposit contains a total of 879 Mt of oxide ore, with a grade of 1.1% copper for each block. A total of 2369 Mt of material is extracted. Mine production is 118.4 Mt/a, and a maximum of 54.7 Mt of ore is fed to the plant for all cases. The metallurgical recovery from the ore is 85%. The final product is electro-refined cathodes. The mine design considers a bench 15 m high for each of the exploitation designs with different pushbacks. The final level (at the base of the pit) has a width of 65 m, and the final pit has a slope angle of 44 degrees.
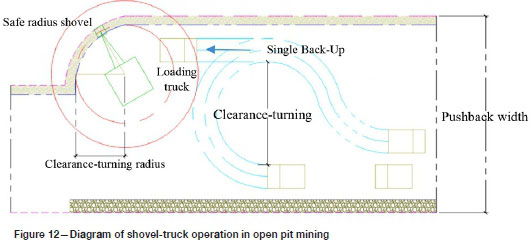
This work considers the same fleet of shovels and trucks. The selected loader is a Komatsu P&H 4100XPC power shovel. The truck model selected is a CAT 797F. Typically, the minimum width needed for the equipment selected is 80 m, taking into consideration the size of the machinery and its clearance and turning diameter (Figure 12) in optimal circumstances.
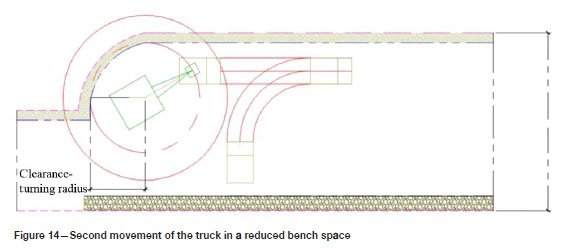
The estimation of minimum space is completed using the equipment's technical manual and considering a minimum space possible in the operation. This reduced space means that the truck has to manoeuvre more than usual. In the first movements, the truck must position in front of the bench and then reverse (Figure 13).
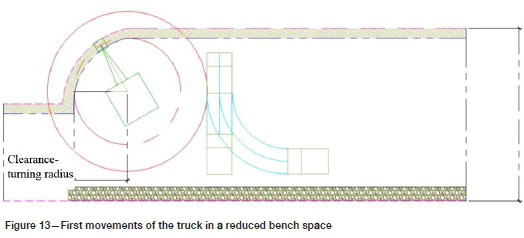
After that, the truck must move forward and then turn again, stopping and reversing, to finally be in the correct position for loading by shovel (Figure 14). The truck can then proceed to the road without any further problems.
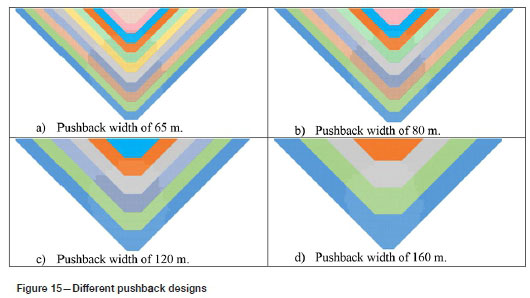
Finally, the pushback widths for four different cases were defined, each with their own predetermined productivity parameters given the available space. In the first case, the pushback width is only the minimum space of 65 m needed for the equipment. In this case, the truck must manoeuvre more; in fact, the truck must carry out two steps (prior manoeuvres) before reaching its final loading position. In this strategy, loading is done only on one side of the shovel. In the second case, the truck must manoeuvre, but it only needs one step to reach the final position. The strategy in this case is also single back-up loading, but this strategy requires lower driver skills. The third and fourth designs correspond to widths of 120 and 160 m; in these the space is sufficient for the truck to reach the final loading position without any problems. In the pushback with a width of 120 m, the strategy is single back-up loading. For the pushback with a width of 160 m, the strategy is double back-up loading.
The four different mining planning scenarios are generated considering pushback widths of 65, 80, 120, and 160 m (Figure 15). To show more clearly the real impact of the pushback width on the project's NPV, the scenarios use fixed widths for each case.
The cost and performance of the equipment are adjusted according to the pushback width for each particular economic evaluation. For the above, the operating performance characteristics of a fleet of real mine equipment will be considered. The base cost to consider (Table I) corresponds to the pushback width of 80 m (base). For the other pushbacks, these costs are increased or decreased according to the performance of the fleet in each design.
The different pushback design strategies affect the times required for operating equipment in a single pass (80 m). For the 65 m pushback width, a 50% longer truck manoeuvring time and a 50% longer waiting time for equipment positioning are required. For the 120 m width scenario, both the truck manoeuvring time and the waiting time for equipment positioning are 20% shorter. Finally, for the 160 m pushback width, a reduction of 20% in manoeuvring and final positioning times is possible. The variations in the operating times of the fleet are applied to the variables indicated in Table II.
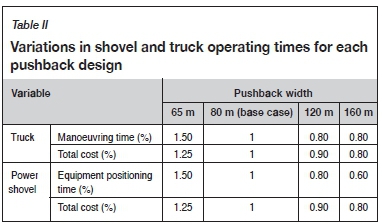
Similar considerations were taken for the costs of loading and hauling. For the 65 m pushback width scenario, the hauling cost is 25% higher and the loading cost 20% higher. For the 120 m width scenario, hauling and loading costs are 10% lower. Finally, for the 160 m pushback width, a reduction of 20% in hauling and loading costs is possible. The variations in costs of the fleet are applied to the variables indicated in Table II.
After the necessary adjustments to the operating performance of the mine equipment are made, the corresponding extraction sequence can be generated for each scenario, maintaining the plant feed restrictions and the mine production.
In this work, the extraction sequence is in the order of the pushbacks designed. First, the shorter pushback (pit) is extracted, and after that, the following one. Extraction is independent of the specific period as mine planning will always complete the extraction scheduled for the mine. As a general rule, prior to extracting ore the extraction of at least 50% of the waste in the first pits and at least 25% in the final pits is necessary in each pushback, which provides certainty that ore will always be exposed.
The extraction of ore is not fixed. Mine planning attempts to extract the ore necessary for the plant, but if this is not possible the plant will just process the ore actually extracted. With this approach, we will know the impact on ore extraction of each pushback design. The mine plan for economic evaluation is generated using this information.
The next step is to calculate the equipment required to maintain the production goal previously established in each scenario. Finally, the economic evaluation of each scenario is carried out considering the difference in operating costs, as well as the difference in equipment necessary for exploitation (investment).
Implementation
The implementation of this work was completed in MS Excel®. To evaluate the different designs, a worksheet was created with each cell corresponding to one block, with the dimensions indicated (5x5x5 m), and then using a colour code the different pushbacks were defined for the four final pits, all with the same dimensions.
The differentiation between ore and waste is done numerically, using positive numbers for ore and negative numbers for waste. The ore and waste for each pushback are then calculated and the extraction scheduling is begun, always following the guidelines established previously. When the extraction schedule is finished for each period, the corresponding calculation of gross revenue is carried out.
The cost of haulage is considered to increase over time. For all designs, a 2% increase in the cost of haulage is considered for each period. The other mine costs are taken to be fixed in time, because in the future mining companies may generate new business strategies or integrate new technologies that help to decrease or maintain costs.
The fleet required for loading and haulage is determined by the capacity of each item of equipment. In addition, different operating times are considered for each pushback design to evaluate the number of shovels and trucks needed. More time is needed for the 65 m pushback width, and the time is decreased for each design as the space for operation increases (pushback widths of 80, 120, and 160 m).
Finally, the cash flow for each design is calculated. The evaluation considers the same investment plan and the same costs for shovels and trucks for all the designs, but in accordance with the equipment required for each pushback design. In this work, the replacement of equipment is not taken into account, because this only increases the investment necessary in the evaluation of all the designs, and the impact of this item on the value of the project is not important in establishing the value of each design.
Results and discussion
The ore production with the different pushback designs shows large differences in the first years in the cases evaluated (Figure 16). All the designs extracted only waste in the first year and started ore production in the second year, with the exception of the 160 m width pushback, which extracted only 3.5 Mt of ore in the second year. Therefore, the first two years are considered to be the pre-stripping period in the 160 m pushback design. For the 65 m pushback width, there is quick access to the ore, but in this approach the maximum planned production is reached only after eight years. In contrast, the 160 m pushback width enables more stable ore and waste extraction, providing the processing plant with a continuous feed of ore that is less variable over time.
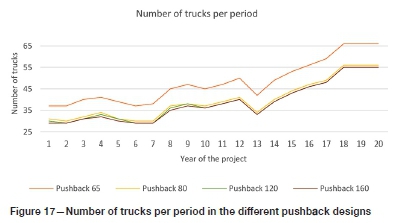
There are no great differences in the fleet of equipment necessary for the different designs. Only for the 65 m pushback width does the number of trucks increase over time, because the haulage profile used (mean distance) was the same for each pushback design and only the production performance was considered to be different in each evaluation. For the pushback widths of 80, 120, and 160 m, the number of trucks is similar, although different performance was considered in each case, reducing the time for manoeuvring and waiting for correct truck positioning.
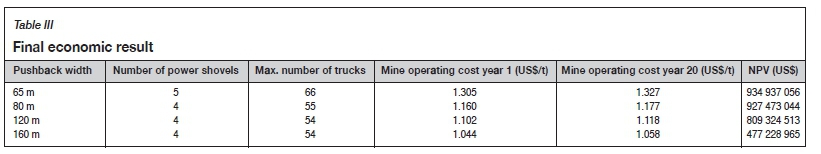
The economic results obtained for each design (Table III) show a reduction in value with smaller pushback widths. In cases in which ore extraction is late, the cost of the project increases in the first period, because the equipment moves only waste, and gross revenue is generated late, which decreases the value of the project.
Conclusion
This paper challenges the current notion that pushback width should be set at the distance that assures high equipment productivity. The results of the case study show that the value of the project increases with a greater number of pushbacks (or smaller pushback widths), although this requires equipment to operate at suboptimal productivity. When pushbacks that offer minimal space for equipment transit are used, this leads to poorer productivity and subsequently high operating costs. However, as this study has shown, higher values than in situations with fewer pushbacks may still result. This is due to the time value of money - by delaying expenditure associated with pre-stripping while bringing forward access to ore as a result of a faster sinking rate. Table II contains the assumed productivity adjustment factors applied to equipment operating under the various pushback widths considered in this study.
The traditional belief that generating 'optimal' exploitation models requires planners to seek lower operating costs is thus not always valid. Planners should seek out value increases rather than cost reductions.
References
BoHNET, E.L. 1990. Optimun production scheduling. Surface Mining. Kennedy, B.A. (ed.). 2nd edn. Society for Mining, Metallurgy & Exploration, Littleton, CO. [ Links ]
BozoRGEBRAHiMi, A., Hall, R., and Morin, M. 2005. Equipment size effects on open pit mining performance. International Journal of Surface Mining, Reclamation and Environment, vol. 19, no. 1. pp. 41-56. https://doi.org/10.1080/13895260412331326821 [ Links ]
BozoRGEBRAHiMi, E., Hall, R.A., and Biackwell, G.H. 2003. Sizing equipment for open pit mining - a review of critical parameters. https://doi.org/10.1179/0371784032250035 [ Links ]
Castillo, L. 2009. Modelos de optimización para la planificacion de mineria a cielo abierto. Undergraduate thesis, Universidad de Chile. [ Links ]
CouzENS, T. and Pincock, Allen & Holt. 1970. Aspects of production planning: operating layout and phase plans. Open Pit Mine Planning and Design.1st edn. Crawford, J. and Hustrulid, W. (eds), Society of Mining Engineers of the American Institute of Mining, Metallurgical, and Petroleum Engineers, New York. pp. 217-231. [ Links ]
Dagdelen, K. 2001. Open pit optimization - Strategies for improving economics of mining projects through mine planning. Proceedings of the 17* International Mining Congress and Exhibition of Turkey. pp. 117-122. http://www.maden.org.tr/resimler/ekler/1259a0cb2431834_ek.pdf [ Links ]
Hustrulid, W.A., Kuchta, M., and Martin, R.K. 2013. Open Pit Mine Planning & Design. CRC Press, Boca Raton, FL. https://www.mendeley.com/research-papers/open-pit-mine-planning-design-two-volume-set-cdrom-pack/ [ Links ]
Lerchs, H. and Grossmann, i. 1964. Optimum design of open-pit mines. CIM Transactions, vol. 68. pp. 17-24. [ Links ]
Mathieson, G.A. 1982. Open pit sequencing and scheduling. Proceedings of the the First International SME-AIME Fall Meeting, Honolulu. Society of Mining Engineers of the American Institute of Mining, Metallurgical, and Petroleum Engineers, New York. [ Links ]
Meagher, C., Dimitrakopoulos, R., and Avis, D. 2014. Optimized open pit mine design, pushbacks and the gap problem-a review. Journal of Mining Science, vol. 50, no. 3. pp. 508-526. https://doi.org/10.1134/S1062739114030132 [ Links ]
Mousavi Nogholi, A.A. 2015. Optimisation of open pit mine block sequencing. PhD thesis, Queensland University of Technology. http://eprints.qut.edu.au/86697/ [ Links ]
Ramazan, S. 1996. A new push back design algorithm in open pit mining. MS thesis, Colorado School of Mines. [ Links ]
Rojas Seguel, D., Castillo, E., and Cantallopts, J. 2015. Caracterización de los costos de la gran minería del cobre. https://www.cochilco.cl/ListadoTemtico/062016SeguimientoCostos.pdf [ Links ]
Sabanov, S. and Bearre, M. 2015. Open pit scheduling features to improve project economy. Proceedings of the 23rd International Symposium on Mine Planning and Equipment Selection (MPES 2015), vol. 1. Southern African Institute of Mining and Metallurgy, Johannesburg. pp. 1033-1040. [ Links ]
Songolo, M. 2010. Pushback design using genetic algorithms. MEng thesis, Curtin University. https://doi.org/10.13140/2.1.4065.6169 [ Links ]
Whittle, D. 2011. Open-pit planning and design. SME Mining Engineering Handbook. Society for Mining, Metallurgy & Exploration, Littleton, CO. pp. 877-901. [ Links ]
Whittle, G. 2010. Enterprise optimisation. Proceedings of Mine Planning and Equipment Selection (MPES), Fremantle, WA, 1-3 December 2010. Australasian Institute of Mining and Metallurgy, Melbourne. pp. 105-117. http://www.whittleconsulting.com.au/documents/articles/Enterprise%20Optimisation.pdf [ Links ]
Whittle, J. 1990. Open pit optimization. Surface Mining. 2nd edn.Kennedy, B.A. (ed.). Society for Mining, Metallurgy & Exploration. Littleton,CO. pp. 470-475. [ Links ]
 Correspondence:
M. Nehring
Email: m.nehring@uq.edu.au
Received: 17 Jun. 2020
Revised: 9 Sep. 2020
Accepted: 11 Sep. 2020
Published: October 2020

