


Services on Demand
Article
 English (pdf)
 Article in xml format
 Article references
Indicators

Related links
-
 Cited by Google
 -
 Similars in Google
Share

 Permalink
Journal of the Southern African Institute of Mining and Metallurgy
On-line version ISSN 2411-9717
Print version ISSN 2225-6253
J. S. Afr. Inst. Min. Metall. vol.120 n.10 Johannesburg Oct. 2020
http://dx.doi.org/10.17159/2411-9717/1252/2020
PAPERS OF GENERAL INTEREST
Next-generation, affordable SO2 abatement for coal-fired power generation - A comparison of limestone-based wet flue gas desulphurization and Sulfacid® technologies for Medupi power station
A. StrickrothI; M. SchumacherI; G.W. HasseII; I. KgomoII
ICarbon Process & Plant Engineering S.A., Grand Duchy of Luxembourg, Europe
IIEPCM Global Engineering (Pty) Ltd, Centurion, 0157, South Africa. G.W. Hasse https://orchid.org/0000-0003-4912--0305
SYNOPSIS
Coal is used to generate more than three-quarters of South Africa's electricity, while numerous coal-fired boilers are employed for steam generation in industrial processes. However, coal-fired power generation is responsible for the release of the largest quantities of SO2 emissions to the atmosphere and leads to detrimental health and welfare effects in communities in the proximity of coal-fired plants. The classical industrial SO2 abatement solution for the coal-fired power generation industry is wet flue gas desulphurization, which uses a limestone adsorbent and produces a gypsum by-product (WFGD L/G). In South Africa, due to the poor quality of the limestone the gypsum product is unsaleable and is co-disposed with coal ash. In comparison, the Sulfacid® process technology converts SO2 contained in industrial flue gas into saleable sulphuric acid using a catalytic process requiring only water and air. This process does not require limestone. The scale of the latest commercial applications of the Sulfacid® SO2 abatement technology in the chemical, fertilizer, and copper mining industries demonstrates the potential and readiness of this technology to be employed in the coal-fired electricity and steam production sectors. This paper provides a first-order direct comparison between the techno-economic aspects of the WFGD (L/G) and Sulfacid® technologies using the requirements specified for the 6 x 800 MWe Eskom coal-fired Medupi power station. The results indicate that affordable flue gas desulphurization technology exists that could be adopted by the South African industry to reduce SO2 emissions to legislative limits and beyond.
Keywords: SO2 abatement, coal-fired power, and heat generation, sulphuric acid, wet fluidized gas desulphurization, Sulfacid®, waste-to-chemicals.
Introduction
Coal-fired power generation in South Africa remains indispensable for maintaining economic activity now and into the foreseeable future, even with the introduction of renewable energy. During the period April 2018 to March 2019, approximately 77% of all electricity in South Africa was generated by 15 coal-fired power plants which, in addition to gas, hydro-, and nuclear power, formed part of a total of 92% Eskom-generated electricity supplied to the national grid (Stats SA, 2018a, 2018b, 2019; Eskom, 2019). Flue gas from coal-fired power plants contains sulphur dioxide (SO2) that originates from the sulphur in the coal, and which has detrimental health and welfare effects on communities living in the proximity to the plants.
Sulphur is contained in coal predominantly as organic sulphur (S) and pyritic sulphur (Calkins, 1994), with typical total sulphur contents of 0.54% (by mass) for thermal export coal, > 1% for Sasol syngas production coal, < 2% for Eskom thermal power generation coal, and 2% (range 0.4-3.0%) for discard coal (Hall, Eslait, and den Hoed, 2011; Steyn and Minnitt, 2010; Makgato and Chirwa, 2017). During pulverized coal combustion, the organic and pyritic sulphur is converted mostly into SO2, and in small quantities into sulphur trioxide (SO3) (Müller, Schnell, and Scheffknecht, 2013), with only approximately 10% of the sulphur captured in the coal ash (Harrison, 2006). The SO2 flue gas concentration for Eskom power plants typically ranges from 1 623 mg/Nm3 (dry, 10% O2) for 0.7% S (air-dried basis) at Kriel power station to a maximum of 3 934 mg/Nm3 for 1.8% S at Medupi power station (Harris, 2014; Girmay and Chikobvu, 2017; Kolker, Senior, and Alphen, 2016). Likewise, the SO2 emissions for the Eskom coal-fired power plant fleet (single point sources) range from 26 Mt/a for Komati power station to 429 Mt/a for Matimba power station (van Geuns, 2018; Mathebula, 2017). Most of the Eskom coal-fired power stations are located in, and impact the air quality in, the Highveld and Waterberg Priority Areas (South Africa, 2007, 2012a, 2012b, 2015).
The atmospheric dispersion, transportation, and conversion of concentrated SO2 (Harrison, 2006) from these power plant stacks result in diluted SO2 concentrations ranging from 20 pg/m3 to more than 500 pg/m3 at ground level (WHO, 2005; South Africa, 2009) in the form of dry (gas and particulates) and wet depositions (droplets) to which humans, nature, and infrastructure are exposed (Hazi, Heikkinen, and Cohen, 2003; Pretorius, Piketh, and Burger, 2017). Human inhalation of SO2 is associated with both short- and long-term adverse health problems, affecting the nose, upper respiratory tract, and lung function (WHO, 2005). In fact, integrated research reviews by the US Environmental Protection Agency (EPA) found a causal relationship between respiratory morbidity (illnesses), particularly in individuals with asthma, and short-term exposure to SO2 (EPA, 2017). The EPA also found that cardiovascular effects and mortality are caused by short- and long-term human exposure to particulate matter (PM) with a nominal aerodynamic diameter < 2.5 pm (PM25) that is composed primarily of sulphate (SO42-) and nitrogen oxides (NOx) (EPA, 2009). Based on these types of studies, human mortality and morbidity rates for communities living in the proximity of Eskom coal-fired power stations could be estimated (Langerman and Pauw, 2018).
Despite South African legislation to limit the coal-fired power plant stack and ground-level ambient SO2 concentrations, multiple exceedances of atmospheric emission licence (AEL) limits are reported by environmental groups (Sahu, 2019) and by the Department of Environment, Forestry and Fisheries (DEFF) (Gwase, 2019). Government's failure to implement the Highveld Priority Area air quality management plan, in view of the constitutional right of citizens to an environment that is supportive of their health and wellbeing (South Africa, 2016), has led to pending litigation by the Centre for Environmental Rights (CER) against the President of South Africa, the Minister of Environmental Affairs, and Chief Air Quality Officer (CER, 2019). Furthermore, in an apparent attempt by government to help the industry with legislative compliance, the SO2 limit of 500 mg/Nm3 for existing coal-fired plants that was set in 2010 was relaxed to 1 000 mg/Nm3 in 2020 (South Africa, 2010, 2020).
Eskom is in the process of implementing wet flue gas desulphurization (WFGD) technology on its 6 x 800 MWe Kusile coal-fired power station that is under construction in the Mpumalanga region and is planning to retrofit the same SO2 abatement technology to its operational 6 x 800 MWe Medupi power station in the Waterberg region (Bagus, van Wyk, and Chang, 2018; Harris, 2014). Besides water, power and steam, the WFGD (L/G) abatement process requires limestone as an adsorbent, generates additional taxable CO2 during the SO2 abatement process, and produces unsaleable gypsum as a byproduct (Bagus, van Wyk, and Chang, 2018). Owing to the lack of a market for the gypsum by-product, additional volumes of waste (in addition to coal ash) need to be handled, increasing the life-cycle cost for waste disposal (Gruenewaldt, 2013; Campbell, 2015; Vosloo, 2018; Koralegedara et al, 2019). From an economic viewpoint, this means that WFGD (L/G) incurs a capex (capital expenditure at the start of its life-cycle and sustains a net negative opex (operational expenditure during its life, resulting in a net negative cost of ownership at the end of its life-cycle. Furthermore, the scarcity, quality, and transportation cost of limestone in South Africa poses a threat to the further implementation of WFGD (L/G) for SO2 abatement by Eskom (Stephen et al, 2014). In fact, Steyn and Kornelius (2018) argued in a recent paper that the implementation of the WFGD technology in the Highveld Priority Area will not provide a net benefit over a 30-year period from 2020 to 2050, mainly because of the continued ne negative opex.
The challenge is, therefore, that while South Africa is dependent on coal-fired power and heat generation that generates harmful SO2 emissions, the WFGD (L/G) technology currently being implement at Kusile power station is not economically viable for further roll-out to the Eskom coal-fired power plant fleet.
Fortunately, next-generation SO2 emission abatement technology is becoming available that seems to provide a net positive opex, resulting in a break-even and net profit during lifetime deployment. The back-end (before the stack) Sulfacid® process technology, developed by Lurgi AG and improved and patented by Luxembourg company Carbon Process & Plant Engineering S.A. (CPPE) directly converts SO2 and SO3 contained in any industrial flue gas, using only water and air, into saleable sulphuric acid (H2SO4) of various grades using a fixed bed of activated carbon, without requiring any limestone or producing CO2 or gypsum (Strickroth, 2017a, 2017b).
The purpose of this paper is to conduct a first-order techno-economic comparison between the WFGD (L/G) and Sulfacid® SO2 abatement technologies as applied to Eskom's 6 x 800 MWe Medupi coal-fired power plant, using publicly available data, to determine whether affordable SO2 abatement could be implemented on coal-fired power plants in South Africa. The Medupi power plant has been chosen for this comparative study because Eskom's financial loan conditions require the implementation of an SO2 abatement technology (World Bank, 2015), the sulphur content of the coal and resulting SO2 concentrations are the highest in the Eskom fleet, and because this new station has a remaining life of 60 years (Cheng, van Wyk, and Bagus, 2018).
The following sections of this paper provide a historical literature review of the WFGD (L/G) and Sulfacid® technologies, followed by a description of the method of high-level first-order comparison that was used. The results from the techno-economic comparison are presented and discussed. The results indicate the possibility of affordable next-generation SO2 abatement for coal-fired power generation. The limitations of this study are highlighted, and conclusions drawn suggesting that further comparative analysis be conducted by academia, industry, and government.
Literature survey
Flue gas desulphurization technologies
Flue gas desulphurization (FGD) technologies remove oxides of sulphur (SOx) from flue gases, generally by reaction or absorption with alkaline absorbents, and can be categorized by the nature of the process flow (thermal or chemical regeneration of absorbent or non-regenerative one pass through), water usage (wet, semi-dry, and dry) and by-product production (commercially marketable commodity or landfill waste) (Lisnic and Jinga, 2018). Different absorbents are used for the wet (limestone, lime, caustic soda, ammonia, and seawater), semi-dry (limestone and lime), and dry process variants (limestone and dolomite) of the FGD technologies (Lisnic and Jinga, 2018). Therefore, WFGD (L/G) could be categorized as a wet, limestone-based absorbent, non-regenerative one pass through technology producing a gypsum by-product. Sulfacid® could be described according to this classification as a wet, water-based absorbent, regenerative one pass through technology producing a sulphuric acid by-product.
Evolution of the WFGD (LIG) technology
The first WFGD installation was in 1931 at the Battersea coal-fired power station in London (UK) with the spraying of water on counterflow flue gases to convert some of the SO2 into an acidic sulphite solution (Biondo and Marten, 1977). In 1935 a modified WFGD system was installed at the Swansea coal-fired power station, where a lime slurry was mixed with water and sprayed onto counterflow flue gases. Further upgrades of the FGD process and the installation at the Fullham coal-fired power station in 1938 led to the extraction and disposal of gypsum as a by-product (Biondo and Marten, 1977). Many WFGD installations were completed worldwide for SO2 abatement of coal-fired flue gases, with the limestone forced oxidation (LSFO) or limestone - gypsum (L/G) process variant being chosen by most of the utilities, primarily due to the abundance and low price of limestone (Lisnic and Jinga, 2018). In 2012 a WFGD (L/G) installation at the Rovinari coal-fired power plant in Romania was able to reduce the SO2 flue gas concentration to 250 mg/ Nm3 (Lisnic and Jinga, 2018), and this technology is continually undergoing further developed (Dragomir et al., 2017).
The WFGD (L/G) installation at Eskom's Kusile power plant achieved an SO2 removal efficiency of only 93% during performance testing (Ezeh, 2018). Nevertheless, the required WFGD efficiency of > 98%, water consumption of < 0.21 l/kWh, and worldwide installed capacity of > 80% as in 2012 (Carpenter, 2010) played a major role in Eskom's decision to implement WFGD (L/G) at Medupi (Cheng, van Wyk, and Bagus, 2018). The major drawback of applying this technology in South Africa is the requirement for large volumes of scarce and costly high-quality limestone (Stephen et al., 2014; Haripersad and Swart, 2015), production and co-disposal of unsaleable gypsum with coal ash (Gruenewaldt, 2013; Vosloo, 2018; Koralegedara et al., 2019), as well as the production of additional (taxable) CO2 that results in a net negative opex and a net negative cost of ownership during the installation's life-cycle.
Description of the WFGD (LIG) technology employed for Medupi power station
WFGD (L/G) process description
The WFGD (L/G) SO2 emission abatement system consists predominantly of an absorber, as shown in Figure 1.
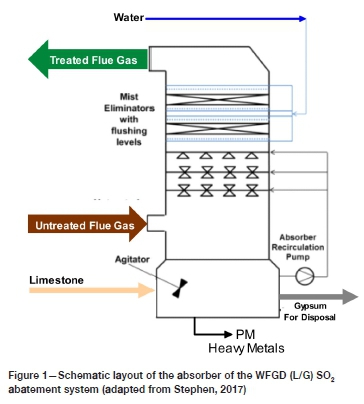
It is anticipated that the limestone-forced-oxidation (LSFO) version of the WFGD technology will be implemented on Medupi power station (Stephen, 2017). In this technology, limestone is pulverized and slurried with process water. The slurry is sprayed onto the untreated flue gas, reacting with SO2 to form a gypsum slurry (Figure 1). Excess oxygen is provided during this process to ensure 'the oxidation of sulphite species to form sulphates' (Stephen, 2017, p. 35) and gypsum is formed as a by-product. In this manner, the sulphur dioxide from the untreated flue gas is absorbed by the limestone slurry and the desulphurized gas exits the absorber to the stack. The gypsum slurry by-product is then removed from the absorber and dewatered before it is added to the boiler ash stream for disposal on the ash dump. The liquid stream from the gypsum dewatering plant is fed to the liquid waste treatment plant where usable water is separated for recycle and the final liquid waste sent for disposal. The WFGD (L/G) technology and solution is therefore a three-step process: (a) limestone slurry preparation, (b) SO2 absorption, and (c) gypsum dewatering (Stephen, 2017).
WFGD (L/G) process chemistry and quantities
The overall balanced chemical reaction for the WFGD (L/G) technology solution is given by Pimenta (2010, p. 6) for absorber operational conditions at 60°C and pH 5, as shown in Equation [1]. SO2 reacts with calcium carbonate/limestone (CaCO3), oxygen (o2), and water (H2O) to form a gypsum slurry/calcium sulphate dihydrate (CaSO4 • 2H2O) and carbon dioxide (CO2).
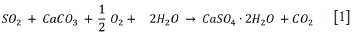
According to Equation [1], one ton of SO2 reacts with 1.56 t of limestone (reagent), 0.25 t of oxygen, and 0.56 t of water to form 2.13 t of gypsum, 0.56 t of slurry water, and 0.69 t of CO2. The SO2 in the untreated flue gas is removed to allow the treated flue gas to exit the chemical process.
The commercial WFGD (L/G) process parameters and quantities calculated for the abatement of sulphur dioxide using 85% pure limestone for Medupi power station are given by Cheng, van Wyk, and Bagus (2018).
Evolution of the Sulfacid® FGD technology
The CPPE Sulfacid® FGD technology differs from classical FGD technologies as categorized by Lisnic and Jinga (2018) as it does not require an alkaline absorbent such as limestone but converts sulphur oxides into sulphuric acid by adsorption in a cold wet catalytic process on a fixed bed of activated carbon, requiring only water and air. Particulate matter and heavy metals are removed in a water-based quench step to condition the SOx-containing flue gas before it is release across the activated carbon bed. Intermittent spraying of water on the bed washes out the formed sulphuric acid and thereby regenerates the bed. The stationary activated carbon bed is guaranteed for 10 years of optimal operation during steady-state and fluctuating volume flows (start-up and shutdown transients) as well as fluctuating SOx flue gas concentrations.
The first commercial Sulfacid® plant was built in 1966 in Germany and operated for flue gas desulphurization at a detergent manufacturing facility (Scheidel, 1968; Grüpner, 1970). This was followed by Sulfacid® plants capable of treating increased flue gas volume flows for an oil-fired generator in 1967 and sulphur-burning and titanium dioxide plants in 1968 (ibid.). Since then, Sulfacid® plants have been installed in more than 20 countries for SOx abatement in the chemical, pigment, smelting, medical catalyst recovery, and fertilizer manufacturing industries. Interestingly, in 1972 a pilot Sulfacid® plant was installed and operated successfully at the 4 x 110 MWe Prunerov coal-fired power plant in the Czech Republic (Svejcar, 1976).
Scheidel (1968) cites the much higher volume flow, unfamiliarity of chemical processes, and a lack of on-site use of sulphuric acid as reasons why coal-fired utilities have chosen WFGD with limestone as the preferred SO2 abatement technology until now. This situation is about to change, due to:
> The size and scale of the latest commercial applications of the Sulfacid® SO2 abatement technology in the chemical, fertilizer, and copper mining industries (up to 1 000 000 Nm3/h), which demonstrate its potential and readiness to be employed for coal-fired plants
> The economic pressure to install SO2 abatement systems that are financially viable, environmental pressures that require lower scrubbing limits of flue gases, and the requirement for systems that form part of integrated multi-pollutant abatement (NOx and Hg) and CO2 carbon capture and utilization solutions.
For example, in Morocco, one of the recently completed Sulfacid® plants achieved approximately 98% SO2 flue gas reduction from > 600 ppmv (1254 mg/Nm3, 10% O2) to < 15 ppmv (31 mg/Nm3, 10% O2), against a legislative emission limit of 157 ppm (328 mg/Nm3, 10% O2), while also producing marketable sulphuric acid, using only water and air (Africa Outlook Magazine, 2019). In fact, it has been demonstrated that the Sulfacid® technology is able to remove and convert SO2 into sulphuric acid for SO2 levels in flue gases from 3 000 ppmv (6 272 mg/Nm3, 10% O2) down to < 9 ppmv (19 mg/Nm3, 10% O2) (Strickroth, 2017a, 2017b). This indicates that the Sulfacid® technology has the potential to remove SO2 contained in the flue gases of coal-fired power plants to meet current and future legislative requirements.
Description of the Sulfacid® technology as could be applied to Medupi power station
The Sulfacid® SO2 emission abatement system consists of a packed bed type venturi quench and a fixed bed activated carbon Sulfacid® reactor, as shown in Figure 2.
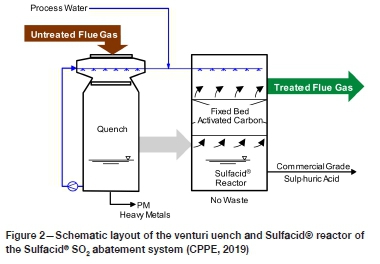
Untreated flue gas from the baghouse enters the venturi quench where the temperature of the flue gas is reduced, the gas stream is saturated through evaporation, water-soluble heavy metals are removed, and the flue gas de-dusted (PM removal) to provide optimal process conditions for the downstream Sulfacid® reactor. Adequate removal of PM from the flue gas prior to entry into the Sulfacid® reactor protects the activated carbon bed from blockage and increased pressure drop. The venturi quench solution that contains PM and heavy metals is drawn off regularly for liquid/solid separation. The dewatered solids could be disposed or potentially utilized in construction materials (Rastogi and Kumar Paul, 2020). The separated liquid is further treated in a liquid waste treatment process, after which most of the liquid is returned to the venturi quench while a small stream is disposed.
The cooled, dedusted flue gas then enters the Sulfacid® reactor, where a special activated carbon-based catalyst bed converts SO2 and SO3 into H2SO4. The activated carbon bed is continuously sprayed at the top with process water for countercurrent regeneration of the catalyst. Dilute sulphuric acid (15 wt.%) is continuously produced by the process, and the gas phase SO2 is reduced to the specified concentration (the design can be adapted to meet current or future concentrations for SO2 < 50 mg/Nm3).
Activated carbon in the Sulfacid® reactor provides a buffering capacity to maintain reactor performance for normal variations in SO2 concentration and flow rate that may be expected during the operation of a power generation unit. The treated flue gas then exits the reactor to the stack. The concentration of the sulphuric acid from the Sulfacid® reactor could be increased from 15 wt.% to 50 wt.% and more using a mechanical vapour compression process that requires steam and electrical power. The recovered water is re-used as process water in the Sulfacid® system.
Sulfacid® process chemistry and quantities
The conversion of SO2 into sulphuric acid on the activated carbon catalyst takes place according to the balanced chemical reaction as shown in Equation [2].
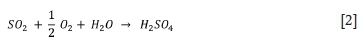
According to Equation [2], one ton of SO2 reacts with 0.25 t of O2 and 0.28 t of water to form 1.53 t of H2SO4 with a 100 wt.% concentration.
The process parameters and quantities for the commercial Sulfacid® process designed for the Medupi power plant are given by CPPE (2019).
Methodology
Approach for first-order techno-economic comparison of WFGD (LIG) and Sulfacid® technologies for Medupi power station
The Eskom data, as employed for the WFGD (L/G) system for Medupi power station, was used in an unchanged format. A new conceptual design of the Sulfacid® system for Medupi power station was done using the same design parameters. Process flow data and quantities for the WFGD (L/G) SO2 abatement system to retrofit the 6 x 800 MWe Eskom Medupi coal-fired power plant units were obtained from the publicly available FGD retrofit basic design report (Harris, 2014), supplemented by information contained in a published master's thesis for the same design configuration (Stephen, 2017). Similarly, data on capex, quantities, and unit costs that comprise opex was obtained from the publicly available Medupi FGD technology selection study report (Cheng, van Wyk, and Bagus, 2018).
The CPPE Sulfacid® SO2 abatement system conceptual design (process flow, quantities, and 3D configuration) as well as costing (CPPE, 2019) were based on the same input and boundary condition information as for the WFGD (L/G) SO2 abatement system as specified in Harris (2014), Stephen (2017), and Cheng, van Wyk, and Bagus (2018) to ensure common and comparable flue gas input and output conditions.
Assumptions for technical data
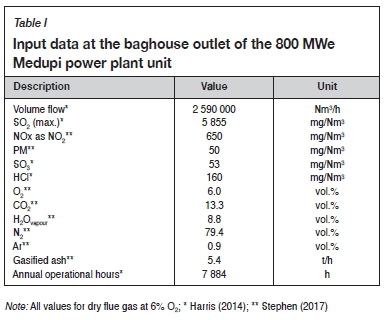
Specified input data for untreated flue gas
Input data for the untreated flue gas exiting the Medupi baghouse for a single 800 MWe unit, as given in Table I, was assumed as the input boundary condition for the WFGD (L/G) and Sulfacid® abatement system designs.
Required output data for treated flue gas
The required SO2 concentration in the Medupi flue gas after abatement is specified as 400 mg/Nm3, dry at 6% O2 (Harris, 2014).
Assumption related to installation position
The installation position for both SO2 abatement systems is after the baghouse ID fans with a tie-in to the existing emission stack ducting.
Assumptions for economic data
Cost estimation accuracy, inclusions, and exclusions
> All cost estimates are based on a 'conceptual-level accuracy of ±30% in 2017 South African Rand' (Cheng, van Wyk, and Bagus, 2018, p. 27).
> 'The cost estimates include allowances for auxiliary electricals, control system upgrades, and other required BOP [balance of plant] system upgrades.' (Cheng, van Wyk, and Bagus, 2018, p. 28).
> Further details on cost assumptions (inclusions and exclusions) are given in Cheng, van Wyk, and Bagus (2018).
Specific assumptions related to capex
> 'The capital cost estimates include direct and indirect costs as an overnight price, but exclude Owner's costs.' (Cheng, van Wyk, and Bagus, 2018, p. 28).
> The same capex of R 17.677 billion for both systems is assumed for the design, construction, and commissioning of six unitized SO2 abatement systems and includes indirect costs, contingency, and escalation (Cheng, van Wyk, and Bagus, 2018).
Specific assumptions related to opex
> 'The operating cost estimates were based on operation at full-load conditions. The annual operating costs also account for increases in auxiliary power requirements, additional labour requirements, water costs, and additional costs for consumables (Cheng, van Wyk, and Bagus, 2018, p. 28).
> The process quantities for the WFGD (L/G) system were used for a 96% pure limestone absorbent as given in Harris (2014, pp. 61-63, Table V).
> The unit costs for process inputs and outputs were used as specified in Cheng, van Wyk, and Bagus (2018, p. 32, Table VII) for both systems.
> The required labour for operating the Sulfacid® system is deemed to be 50% that of a WFGD (L/G) system. This is due to the absence of limestone-related equipment such as offloading, conveying, storage, milling, and water mixing.
> No sale of the gypsum by-product is assumed for the WFGD (L/G) system.
> It is assumed that all the produced sulphuric acid is sold for each financial year. The sales price of sulphuric acid (50 wt.%) was taken as R800 per ton as obtained from a prominent chemicals distributor in South Africa.
> An effective CO2 emission tax rate of R48 per ton was assumed (National Treasury, 2018), although CO2 emissions are taxable at R120 per ton (South Africa, 2019). Emissions tax was calculated only for CO2 generated from the abatement chemistry and not for the required auxiliary electricity consumption or process steam.
Specific assumption for life cycle cost estimation
Cost of ownership (COO) is estimated using the simplified relationship between capex, annual opex, and life cycle as shown in Equation [3].

> A life cycle period of 30 years (2020-2050) was assumed, similar to Steyn and Kornelius (2018) in their economic assessment of the reduction of SO2 on the South African highveld.
Results
The results for the techno-economic comparison are given in Tables II, III, and IV.
Discussion
The techno-economic comparison between the WFGD (L/G) and Sulfacid® technologies and systems applied for the retrofitting of the 6 X 800 MWe Medupi power plant indicate the possibility of affordable SO2 abatement for a modern coal-fired power plant using the Sulfacid® technology. The affordability originates from the process quantities that result from the two different technologies as well as the opex and life cycle costs.
Comparison of process quantities
The major difference between the two technologies and systems becomes apparent when comparing the process quantities in Table II. The Sulfacid® process does not use limestone, does not generate CO2 from the process chemistry, nor a gypsum byproduct, and there is no need to dispose of crystallizer salts. From a by-product point of view, both processes produce similar bulk quantities, i.e. WFGD (L/G) produces 1.8 Mt gypsum while Sulfacid® produces 2.1 Mt sulphuric acid. The Sulfacid® process produces 50% less disposable wastewater because it does not require water to generate a lime slurry stream, and also uses 50% less labour due to the simplicity of the process equipment compared to WFGD (L/G), since no limestone-related equipment is required. Both processes require similar process water quantities but the Sulfacid® process converts the process water into a saleable product. Furthermore, the Sulfacid® process uses 10% more auxiliary power, predominantly to overcome the pressure drop across the fixed bed of activated carbon. For the Sulfacid® process to re-use some of the process water, the sulphuric acid is concentrated from 15 wt.% to 50 wt.% using mechanical vapour compression. This compression process requires auxiliary power and also steam, and therefore the Sulfacid® process requires 468% more steam than the WFGD (L/G) process. Most process quantities for the Sulfacid® process in Table II are less than or similar to the WFGD (L/G) process, except for the steam requirements.
Comparison of operational costs
The differences in the process quantities between the two technologies, systems, and processes multiplied by the process quantity unit cost results in a net negative annual opex for WFGD (L/G) compared to a net positive opex for Sulfacid®, as shown in Table III. The absence of costs for limestone, gypsum disposal, taxable CO2, and disposal of crystallizer salts for the Sulfacid® process results in an annual opex saving of approximately -R579 million compared to the WFGD (L/G) process. These savings, in addition to the production of approximately 50% less wastewater, leads to the total annual opex of the Sulfacid® process being approximately 50% lower than for WFGD (L/G) technology, i.e. -R616 million vs. -R1 266 million. The sale of the sulphuric acid by-product results in a net positive annual opex for the Sulfacid® process (R1 049 million) compared to a net negative annual opex for the WFGD (L/G) process (-R1 266 million).
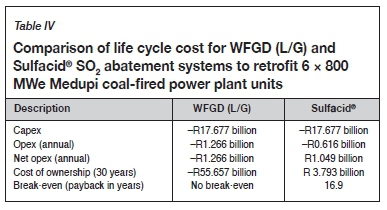
Comparison of life cycle cost
The positive net annual opex of R1 049 million for the Sulfacid® process makes it possible to realize a payback of the assumed capex of R17.677 billion over 16.9 years for a 30-year plant life cycle as shown in Table IV.
Sulphuric acid markets and sales prices
Globally, sulphuric acid is used in the manufacturing for fertilizers (68%), petroleum refining (24%), metal mining (5%), and other industrial applications (3%) (Modiselle, 2013). The global sulphuric acid market is expected to grow by 2.3% (CAGR for 2019-2027) (Business Wire, 2019b) and by 3.8% (CAGR for 2019-2024) in the fertilizer industry (Business Wire, 2019a). The growth in the fertilizer market is fuelled by the increase in the global population and the reduction in the availability of arable land, which requires an increase in crop production per hectare (IFA, 2018).
However, when large quantities of sulphuric acid become available in the South African market for local use and export due to the deployment of the Sulfacid® technology, it could be expected that the sales price of R800 per ton/t, which leads to a break-even of 16.9 years, may drop. To maintain the affordability of the Sulfacid® process with a break-even of 30 years, given the assumptions of this study, the price of sulphuric acid needs to be above R579 per ton.
A future perspective
Expanding the function of a coal-fired power plant beyond electricity generation and stream production towards the on-site manufacturing of chemical commodities from flue gas (waste-to-chemicals) (Deloitte and VCI, 2017) demands a deliberate paradigm shift (Kuhn, 1970) towards a sustainable circular economy (Potting et al., 2017) from utility owners, policymakers, financiers, and governments. Sulphuric acid from converted coal-fired flue gases creates an opportunity not only for security of supply, regional sales, and export, but also for on-site beneficiation to fertilizer and other products and the formation of new, viable, special economic industrial zones and clusters.
Sulphuric acid derived from the Sulfacid® SO2 abatement system circumvents the need to construct new sulphuric acid production plants that burn pyrite (Runkel and Sturm, 2009) thereby avoiding emissions and greenhouse gases associated with additional industrial plants. Furthermore, the ability of the Sulfacid® SO2 abatement system to reduce SO2 flue gas concentrations beyond compliance limits (< 19 mg/Nm3, 10% O2) to produce sulphuric acid demonstrates that coal-fired plants could be operated with negligible environmental impact.
Finally, the Sulfacid® SO2 abatement system forms part of the CPPE suite of modular activated carbon reactors that are able to capture hazardous pollutants such as Hg, Cd, dioxins, and furans and convert NOx and CO2 into ammonium nitrate and ammonium bicarbonate fertilizer products to enable complete coal-fired flue gas abatement and conversion.
Limitations of the comparative study
The first-order techno-economic comparison between the WGFD (L/G) and Sulfacid® SO2 abatement technologies as applied to the 6 x 800 MWe Medupi power station needs to be followed up by a deeper level, comprehensive comparison executed by independent experts in this field to verify the results reported in this paper.
Conclusion
This paper provided a first-order techno-economic comparison between the WFGD (L/G) (wet flue gas desulphurization using limestone and producing a gypsum by-product) and Sulfacid® technologies using the same input parameters and assumptions and applied for SO2 abatement of the 6 x 800 MWe Medupi power station. The Sulfacid® technology converts SO2 into saleable sulphuric acid and uses approximately the same water and power inputs as the WFGD (L/G) technology, but without the need for limestone or the adverse effects of producing unsaleable gypsum or additional CO2. Furthermore, for the same capex, the Sulfacid® technology shows a break-even of 16.9 years and a net positive cost of ownership over its life cycle.
The benefit of the utilization and roll-out of the CPPE Sulfacid® technology for coal-fired power generation in South Africa could have benefits for the environment, the economy, and society. SO2 emissions from coal-fired power stations could be reduced to < 50 mg/Nm3 (current legislation requires 1000 mg/Nm3) while producing saleable sulphuric acid. The drastic reduction in SO2 emissions in the Waterberg, Highveld, and Vaal Priority Areas would improve the working and living environment. The addition of further modular CPPE reactors will convert SO2, NOx, and CO2 into saleable fertilizer salts for the agricultural sector, and create the Chemistry 4.0 circular economy. Saleable products from coal-fired flue gas will avoid stranded assets, promote the formation of economic growth points at power stations, create new asset classes, provide security of commodity supply and promote export opportunities. This in turn, will lead to job retention in the current coal value chain, new job creation, and the sustainable and environmental friendly utilization of South Africa's. vast coal reserves.
Given a 'conceptual-level accuracy of ±30% in 2017 South African rand' (Cheng, van Wyk, and Bagus, 2018, p. 27) and using the assumptions as specified by Eskom for the WFGD (L/G) system and assumptions for the Sulfacid® system for Medupi power station, this comparative study shows that affordable SO2 abatement is possible by employing the CPPE Sulfacid® technology on a modern coal-fired power plant. It is recommended that independent assessments be done by academia, industry and government to verify the findings of this study.
Acknowledgement
Dr Günther Hasse conceptualized the paper and wrote most of the text. Dr Alain Strickroth and Dr Marc Schumacher provided and verified all process data and quantities related to the CPPE Sulfacid® technology. Dr Alain Strickroth, Dr Marc Schumacher, and Itumeleng Kgomo conducted multiple comprehensive reviews of the draft paper. CPPE is the owner of the Sulfacid® technology and EPCM Global Engineering is the Southern African representative of CPPE.
References
Africa Outlook Magazine. 2019. How OCP Group is cutting sulphur dioxide emissions by 98 percent. https://www.africaoutlookmag.com/news/feature-how-ocp-group-is-cutting-sulphur-dioxide-emissions-by-98-percent [accessed 29 January 2019]. [ Links ]
Bagus, m., van Wyk, I., and Chang, D. 2018, Medupi Flue Gas Desulphurisation -Technology Selection Report, Rev. 2. Johannesburg. [ Links ]
Biondo, S.J. and Marten, J.C. 1977. A history of flue gas desulfurization systems since 1850. Journal of the Air Pollution Control Association, vol. 27, no. 10. pp. 948-961. [ Links ]
Business Wire. 2019a. Global fertilizer market growth, trends and forecast (20192024). https://www.businesswire.com/news/home/20190312005708/en/Global-Fertilizer-Market-Growth-Trends-Forecast-2019-2024 [accessed 9 January 2020]. [ Links ]
Business Wire. 2019b. Global sulfuric acid market to surpass 324.1 million tons by 2027. https://www.businesswire.com/news/home/20191122005229/en/Global-Sulfuric-Acid-Market-Surpass-324.1-Million [accessed 9 January 2020]. [ Links ]
Calkins, W.H. 1994. The chemical forms of sulfur in coal - A review. Fuel, vol. 73, no. 4. pp. 475-484. [ Links ]
Campbell, C. 2015. Waste Assessment of Ash and Flue Gas Desulphurisation Wastes for the Medupi Power Station, Rev. 2. Eskom, Midrand. http://www.eskom.co.za/OurCompany/SustainableDevelopment/EnvironmentalImpactAssessments/medupi/DEIR%20Appendicies/Appendix%20G-12_Waste%20Assessment%20Report.pdf [accessed 17 December 2019]. [ Links ]
Carpenter, A.m. 2010. Low water FGD technologies. United States Energy Association, London. https://wiww.usea.org/sites/default/flles/112012_Low%20water%20FGD%20technologies_ccc210.pdf [accessed 21 December 2019]. [ Links ]
CER. 2019. Environmental groups take government to high court over violation of constitutional right to clean air. https://cer.org.za/news/environmental-groups-take-government-to-high-court-over-violation-of-constitutional-right-to-clean-air [accessed 24 October 2019]. [ Links ]
Cheng, d., van Wyk, I., and Bagus, M. 2018. Medupi flue gas desulphurisation -Technology selection study report, Rev. 2.0. Johannesburg. [ Links ]
CPPE. 2019. Unsolicited proposal for cost effective solution for Eskom Sulphur Dioxide emission abatement compliance for the Medupi power station using the CPPE Sulfacid® technology: National Treasury submission by EPCM Global Engineering (Pty) Ltd, Rev. 1. Midrand, South Africa. [ Links ]
Deloitte and Vei. 2017. Chemie 4.0 - Wachstum durch Innovation in einer Welt im Umbruch. Frankfurt/Main. https://www.vci.de/vci-online/services/publikationen/broschueren-faltblaetter/vci-deloitte-study-chemistry-4-dot-0-short-version.jsp [accessed 2 April 2019]. [ Links ]
Dragomir, A.-M., Lisnic, R., Prisecaru, t., Prisecaru, M.M., Vijan, CA., and Nastac, D.C. 2017. Study on synthetic gypsum obtained from wet flue gas desulphurisation in thermal power plants. Romanian Journal of Materials, vol. 47, no. 4. p. 551-556. [ Links ]
EPA. 2009. Integrated science assessment for particulate matter. https://cfpub.epa.gov/ncea/risk/recordisplay.cfm?deid=216546 [accessed 6 December 2019]. [ Links ]
EPA. 2017. Integrated science assessment for sulfur oxides - Health Criteria. https://www.epa.gov/isa/integrated-science-assessment-isa-sulfur-oxides-health-criteria [accessed 6 December 2019]. [ Links ]
Eskom. 2019. Eskom integrated report. http://www.eskom.co.za/IR2019/Documents/Eskom_2019_integrated_report.pdf [accessed 2 November 2019]. [ Links ]
Ezeh, A. 2018. Eskom's Kusile wet flue gas desulphurization plant achieves 93% removal efficiency rate upon completion and performance test. https://www.genewsroom.com/press-releases/eskoms-kusile-wet-flue-gas-desulphurization-plant-achieves-93-removal-efficiency [accessed 14 December 2018]. [ Links ]
Girmay, M.E. and Chikobvu, D. 2017. Quantifying South Africa's sulphur dioxide emission efficiency in coal-powered electricity generation by fitting the three-parameter log-logistic distribution. Journal of Energy in Southern Africa, vol. 28, no. 1. p. 91. [ Links ]
Gruenewaldt, R.G. 2013. The co-disposal of gypsum with ash at Kusile Power Station: Air quality assessment, Rev. 0. http://www.eskom.co.za/OurCompany/SustainableDevelopment/EnvironmentalImpactAssessments/Kusile60Yr/Documents/H-Kusile10yrAshDisposalAQA.pdf [accessed 17 December 2019]. [ Links ]
Grüpner, O. 1970. Sulfacid Anlagen zur SO2 Abscheidung., VDI Berichte, vol. 149. pp. 127-133. [ Links ]
Gwase, p. 2019. Parliamentary briefing by the Department of Environmental Affair on the status of air quality in South Africa, Parliamentary Monitoring Group -Environment, Forestry and Fisheries, Cape Town. [ Links ]
Hall, I., Eslait, J., and den Hoed, P. 2011. Khanyisa IPP - a 450 MWe FBC project: Practical challenges. Proceedings of Industrial Fluidization South Africa. Southern African Institute of Mining and Metallurgy, Johannesburg. pp. 47-55. [ Links ]
Haripersad, N. and Swart, P. (eds). 2015, RSA sorbent status and application to electricity power generation, Fossil Fuel Foundation, Johannesburg. [ Links ]
Harris, D. 2014. Medupi FGD retrofit basic design report, 0th edn. http://www.zitholele.co.za/environmental/ [accessed 15 January 2018]. [ Links ]
Harrison, R.M. (ed.) 2006. An Introduction to Pollution Science. RSC Publishing, Cambridge. [ Links ]
Hazi, y., Heikkinen, M.S.A., and Cohen, B.S. 2003. Size distribution of acidic sulfate ions in fine ambient particulate matter and assessment of source region effect. Atmospheric Environment, vol. 37, no. 38. pp. 5403-5413. [ Links ]
IFA. 2018. IFA scenarios - Digging deeper, thinking harder, planning further. Paris. https://www.fertilizer.org/Public/About_IFA/IFA_2030/IFA2030.aspx [accessed 9 January 2020]. [ Links ]
Kolker, a., Senior, Cl., Sr., and Alphen, c. 2016. Collaborative studies for mercury characterization in coal and coal combustion products, Republic of South Africa, Ver. 2.0. https://pubs.usgs.gov/of/2014/1153/pdf/ofr20141153.pdf [accessed 6 November 2019]. [ Links ]
Koralegedara, N.H., Pinto, P.X., Dionysiou, D.D., and Al-Abed, S.R. 2019. Recent advances in flue gas desulfurization gypsum processes and applications - A review. Journal of Environmental Management, vol. 251. p. 109572. [ Links ]
Kuhn, T.S. 1970. The Structure of Scientific Revolutions, Foundations of the Unity of Science, 2nd edn. University of Chicago Press, London & Chicago. [ Links ]
Langerman, K.E. and Pauw, C.J. 2018. A critical review of health risk assessments of exposure to emissions from coal-fired power stations in South Africa. Clean Air Journal, vol. 28, no. 2. http://dx.doi.org/10.17159/2410-972x/2018/v28n2a19 [ Links ]
Lisnic, r. and Jinga, S.I. 2018. Study on current state and future trends of flue gas desulphurization technologies - A review. Romanian Journal of Materials, vol. 48, no. 1. pp. 83-90. [ Links ]
Makgato, S. and Chirwa, E.M.N. 2017. Characteristics of thermal coal used by power plants in Waterberg region of South Africa. Chemical Engineering Transactions, vol. 57. pp. 511-516. [ Links ]
Mathebula, T. 2017. Matimba Power Station's annual emissions report. https://lifeaftercoal.org.za/wp-content/uploads/2017/06/Matimba-Power-Station.pdf [accessed 3 November 2019]. [ Links ]
Modiselle, M. 2013. Review of the sulphur industry in the Republic of South Africa, 2012. Department of Mineral Resources, Pretoria. https://www.dmr.gov.za/LinkClick.aspx?fileticket=VfoHOZKNa5o%3D&portalid=0 [accessed 9 January 2020]. [ Links ]
Müller, M., Schnell, U., and Scheffknecht, G. 2013. Modelling the fate of sulphur during pulverized coal combustion under conventional and oxy-fuel conditions. Energy Procedia, vol. 37. pp. 1377-1388. [ Links ]
National Treasury. 2018. Republic of South Africa - Explanatory memorandum on the Carbon Tax Bill, 2018. Pretoria. http://www.treasury.gov.za/public%20comments/CarbonTaxBill2019/Explanatory%20Memorandum%20to%20the%202018%20Carbon%20Tax%20Bill%20-%2020%20Nov%202018.pdf [accessed 18 December 2019]. [ Links ]
Pimenta, M.F. 2010. Flue gas desulphurization through wet limestone process - Adding acids and bases to the limestone suspension. Master's thesis, Department of Chemical Engineering, University of Porto, Porto. [ Links ]
Potting, J., Hekkert, m., worrell, E., and Hanemaaijer, A. 2017. Circular Economy -Measuring innovation in the product chain: Policy Report. The Hague. https://www.researchgate.net/publication/319314335_Circular_Economy_Measuring_innovation_in_the_product_chain [accessed 21 December 2019]. [ Links ]
Pretorius, I., Piketh, s., and Burger, R. 2017. Emissions management and health exposure: Should all power stations be treated equal? Air Quality, Atmosphere & Health, vol. 10, no. 4. pp. 509-520. [ Links ]
Rastogi, A. and Kumar Paul, v. 2020. A critical review of the potential for fly ash utilisation in construction-specific applications in India. Environmental Research, Engineering and Management, vol. 76, no. 2. pp. 65-75. [ Links ]
Runkel, M. and Sturm, P. 2009. Pyrite roasting, an alternative to sulphur burning. Journal of the Southern African Institute of Mining and Metallurgy, vol. 109, no. 8. pp. 491-496. [ Links ]
Sahu, R. 2019. Eskom power station exceedances of applicable atmospheric emission license (AEL) limit values for PM, SO2 & NOx during April 2016 to December 2017: Updated March 22, 2019. https://cer.org.za/wp-content/uploads/2019/04/Ron-Sahu-Eskom-Exceedances-Report-updated-March-22-2019.pdf [accessed 5 November 2019]. [ Links ]
Scheidel, C. (ed.). 1968., Sulphur dioxide removal from tail gas by the sulfacid process. Sulfuric Acid and the Future. Proceedings of the Symposium on Sulfur, Part II. AIChE, New York. [ Links ]
South Africa. 2007. National Environmental Management - Air Quality Act, 2004 (Act No. 39 of 2004) - Declaration of the Highveld as Priority Area in Terms of Section 18(1) of the National Environmental Management - Air Quality Act: https://cisp.cachefly.net/assets/articles/attachments/10071_notice1123.pdf [ Links ]
South Africa. 2009. National Environmental Management: Air Quality Act: National Ambient Air Quality Standards. Pretoria. https://wwww.gov.za/sites/default/files/gcis_document/201409/328161210.pdf [ Links ]
South Africa. 2010. National Environmental Management: Air Quality Act 39 of 2004: List of Activities which Result in Atmospheric Emissions which have or may have Significant Detrimental Effect on Environment, Including Health, Social Conditions, Economic Conditions, Ecological Conditions or Cultural Heritage. No. 33064; Notice 248. Pretoria. https://www.environment.gov.za/sites/default/files/gazetted_notices/nemaqa_listofactivities_g33064gon248_0.pdf [ Links ]
South Africa. 2012a. National Environmental Management - Air Quality Act, 2004 (Act No. 39 of 2004) - Declaration of the Waterberg National Priority Area: Waterberg National Priority Area. Government Notice 495. Government Gazette 35435, 15 June 2012. [ Links ]
South Africa. 2012b. National Environmental Management: Air Quality Act, 2004 (Act No. 39 of 2004) - Highveld Priority Area Air Quality Management Plan. Government Gazette, vol. 144. Pretoria. [ Links ]
South Africa. 2015. National Environmental Management: Air Quality Act, 2004 Waterberg Bojanala Priority Area Air Quality Management Plan. Government Gazette, vol. 1027. Pretoria. [ Links ]
South Africa. 2016. The Constitution of the Republic of South Africa, 1996. Latest Amendment: Constitution Seventeenth Amendment Act of 2012", Department of Justice and Constitutional Development. http://www.justice.gov.za/legislation/constitution/pdf.html [accessed 30 October 2019]. [ Links ]
South Africa. 2019. Carbon Tax Act No. 15 of 2019, Government Notice 800. Government Gazette, vol. 647, no. 42483. Pretoria. [ Links ]
South Africa. 2020. National Environmental Management - Air Quality Act, 2004 (Act No. 39 of 2004): Amendment of the listed activities and associated minimum emission standards identified in terms of section 21 of the National Environmental Management: Air Quality Act. Government Gazette, vol. 421. Pretoria. [ Links ]
Stats SA. 2018a. Electricity generated and available for distribution - August 2018. Pretoria. http://www.statssa.gov.za/publications/P4141/P4141August2018.pdf [ Links ]
Stats SA. 2018b. Electricity generated and available for distribution - December 2018. Pretoria. http://www.statssa.gov.za/publications/P4141/P4141December2018.pdf [accessed 9 December 2019]. [ Links ]
Stats SA. 2019. Electricity generated and available for distribution - April 2019. Pretoria. http://www.statssa.gov.za/publications/P4141/P4141April2019.pdf [accessed 9 Deceber 2019]. [ Links ]
Stephen, CL. 2017. Reduction of wet flue gas desulphurisation water consumption through heat recovery. MEng thesis, North-West University, Potchefstroom, South Africa. [ Links ]
Stephen, CL., Godana, P.R., Moganelwa, A., van Heerden, CS., Bore, J., Singh, y., Patel, e., and Binkowski, S. (Eds.) 2014. Implementation of de-SOx technologies in an Eskom context & the Medupi FGD retrofit project. Johannesburg. [ Links ]
Steyn, M. and Kornelius, G. 2018. An economic assessment of SO2 reduction from industrial sources on the highveld of South Africa. Clean Air Journal, vol. 28, no. 1. pp. 23-33. [ Links ]
Steyn, M. and Minnitt, R.C.A. 2010. Thermal coal products in South Africa. Journal of the Southern African Institute of Mining and Metallurgy, Vol. 110, No. 10. pp. 593-599. [ Links ]
Strickroth, A. 2017a, Sulfur dioxide removal from waste gas: Patent Application No. WO 2017/174472 A1. https://patentscope.wipo.int/search/en/detail.jsf?docId=WO2017174472 [accessed 17 December 2019]. [ Links ]
Strickroth, A. 2017b. Sulfur dioxide removal from waste gas: Patent Application No. US 2019 / 0126200 A1. https://patentimages.storage.googleapis.com/91/75/aa/bdd5bf754c0938/US20190126200A1.pdf [accessed 17 December 2019]. [ Links ]
Svejcar, J. 1976. Experience with the Sulfacid desulfurization process. International Chemical Engineering, vol. 16, no. 3. [ Links ]
van Geuns, A. 2018. Komati Power Station's annual emission report for 2017/18. http://www.naledzi.co.za/assets/documents/1675cf9b59c561a65ea5e1a06b2a5195.pdf [accessed 25 November 2019]. [ Links ]
vosloo, M. 2018. Application for variations to the existing Waste Management License (12/9/11/L50/5/R1) for the Medupi Power Station ash disposal facility, Limpopo Province Application for variation of the exiting Waste Management License (WML) for the Medupi Power Station ash disposal facility. Eskom, Midrand. http://www.eskom.co.za/OurCompany/SustainableDevelopment/EnvironmentalImpactAssessments/MedupiADF_WML/Documents/12949-46-Rep-001-WML%20Variation%20Tech%20Report-Rev1.pdf [accessed 17 December 2019]. [ Links ]
WHO. 2005. Air quality guidelines: Global Update 2005, particulate matter, ozone, nitrogen dioxide and sulfur dioxide. Copenhagen. http://www.euro.who.int/__data/assets/pdf_file/0005/78638/E90038.pdf?ua=1 [accessed 16 November 2019]. [ Links ]
World Bank. 2015. South Africa - Eskom Investment Support Project: Environmental safeguards. Washington DC. http://documents.worldbank.org/curated/en/724831468179947715/South-Africa-Eskom-Investment-Support-Project-environmental-safeguards [accessed 23 April 2020]. [ Links ]
 Correspondence:
G.W. Hasse
Email: gunther@epcm.co.za
Received: 14 Jun. 2020
Revised: 14 Sep. 2020
Accepted: 15 Sep. 2020
Published: October 2020

