


Services on Demand
Article
 English (pdf)
 Article in xml format
 Article references
Indicators

Related links
-
 Cited by Google
 -
 Similars in Google
Share

 Permalink
Journal of the Southern African Institute of Mining and Metallurgy
On-line version ISSN 2411-9717
Print version ISSN 2225-6253
J. S. Afr. Inst. Min. Metall. vol.120 n.10 Johannesburg Oct. 2020
http://dx.doi.org/10.17159/2411-9717/1222/2020
DIAMONDS PAPERS
Satellite applications in diamond exploration and mine monitoring
N.C. Steenkamp; S.L. Goosen; P.J. Bouwer
Pinkmatter Solutions, Pretoria, South Africa. N.C. Steenkamp https://orchid.org/0000-0002-9912-6038
SYNOPSIS
Satellite-based applications for the monitoring of diamond exploration, operational mines, and post-closure mine sites is gaining traction. A variety of imagery is used to detect both kimberlite and alluvial deposits. Hyperspectral data is utilized mainly for primary deposits, and elevation models for secondary deposits. The data is used to constrain the exploration and ground truthing efforts, resulting in savings on both cost and time. Operational mines benefit from near-real-time monitoring of mining and related activities, including include environmental and security aspects. Satellite imagery can also be used to detect illegal and artisanal diamond diggings, with particular value for ethical sourcing validation in the supply chain. Post-closure monitoring of dumps and rehabilitation reduces the on-site presence of staff. The limitations of satellite applications are related mainly to the cost of obtaining images and the resolution or number of bands available on a detection platform.
Keywords: remote sensing, satellite, monitoring, diamond, exploration, kimberlite, alluvial.
Introduction
Satellite applications in the diamond industry range from the exploration phase, through production to post-closure monitoring. The type of deposit, primary (kimberlite, lamproite) or secondary (alluvial), will determine the most appropriate exploration or monitoring method. Remote sensing platforms include thematic mapping, hyperspectral and multispectral imaging, and high-resolution panchromatic imaging. Primary kimberlite deposits require an integrated GIS targeting database that would typically include Landsat, Sentinel, SPOT, Radarsat, ASTER, and Hyperion satellite data to name a few. This would be supplemented with geophysical methods such as aeromagnetic and gravity survey data, digital elevation maps, and mineralogical/geochemical sampling results. This allows for thematic mapping of kimberlite indicator minerals (KIM), e.g. garnet and ilmenite, and soil index pathfinder analyses. The Sentinel 2 satellites are the highest resolution, public domain near-infrared and shortwave-infrared (VNIR/SWIR) platform, and offer multispectral imagery with a high spatial resolution of between 10 m and 60 m. ASTER has garnered notable interest as an exploration tool as it integrates reflected and emitted long-wave infrared (LWIR) signals that are diagnostic of mantle minerals spectra and can be used in large-scale geochemical surveys. Cognisance should be taken of the various spectral signatures of the various species of KIM to constrain, but not exclude, potential indicators. This sensor array also allows exploration under shallow cover and vegetation.
There tends to be an association between the richness of an alluvial deposit and its geomorphology, making high-resolution digital elevation models (DEMs) a critical data-set. The DEM is used to distinguish between paleochannels, alluvial flats, and terraces. High-resolution optical data, e.g. Pleiades, with 0.5 m per pixel, is required to construct DEMs, for surface change monitoring of objects, operational expansions, and calculation of the volume of rock dumps and tailing storage facilities. The size and distribution of artisanal workings can also be detected and plotted to delineate the extent of an alluvial deposit.
Once mining operations have commenced, satellite-based change and environmental monitoring and volume estimation is done from high-resolution stereo images. The size and volume of excavations and areas of activity can be delineated and calculated for a reporting period. Additional data layers may include: surface water, vegetation, and settlement encroachment on the mining right area. Post-closure of the mining operations, satellite imagery is used to monitor and report on rehabilitation. Synthetic aperture radar (SAR) is utilized to monitor subsidence at underground operations and slope stability in opencast operations. The same technology is also used to monitor illegal and artisanal mining activities, and the information utilized in ethical sourcing reporting and the Kimberley Process.
There are, however, some limitations in the use of satellite-based platforms for exploration and monitoring, mainly related to the spatial resolution and spectral range. Cost considerations will influence the frequency of use. Free hyperspectral or multispectral data sources offer a cost-effective tool as only processing and interpretation is required, but generally have very low resolution. High-resolution optical imagery data, which is required for elevation models, change monitoring, and specifically volume calculation, tends to be expensive.
Satellite data types
There are a wide range of satellite operators, including military, research, Earth observation, communication, weather, and several other task-specific systems. Satellite constellations were previously the domain of government agencies, but since the early 2000s commercial and private operators have launched their own satellites. In the last decade, the small satellites or 'CubeSats' have gained a lot of interest.
Satellite sensors are used to collect data from the atmosphere, oceans, and land. The positions of vessels on the oceans are tracked by automatic identification system (AIS) and SAR sensors. Sea temperatures are recorded by microwave scanning radiometry, and precipitation radar. Sea surface winds are monitored by microwave scatterometers, and surface heights by microwave altimeters. Sea ice is tracked and monitored using microwave scanning radiometry and synthetic aperture radar (SAR) sensors.
The positions of aircraft are established using Automatic Dependent Surveillance-Broadcast (ADS-B) platforms. Precipitation is monitored by microwave scanning radiometer and precipitation radar. Light Detection and Ranging (LiDAR) is used to track dust particles and measure wind velocity.
Land monitoring entails the use of optical sensors to obtain a visual record of conditions on the Earth's surface, whereas SAR is used to determine changes on the Earth's surface. Thermal infrared sensors are used to measure temperature variations on the surface. The most used satellite types in the exploration and monitoring fields are electro-optical and SAR, which are described in the next section.
Electro-optical imagery
Electro-optical platforms collect visual data from the surface of the Earth and can obtain imagery in a variety of bands, ranging from visible to hyperspectral, each with a task-specific application. The limitation to these platforms is that imagery is obtained only during the day for the visible and near-visible spectra, and is affected by cloud cover. The resolution of imagery has a significant impact on the success of the method, and for many applications high-resolution imagery is needed. The processing of image data into products such as digital elevation models (stereo images) or for change monitoring (mono images) is referred to as photogrammetry. High-resolution images are required to generate these products. High-resolution optical data, e.g. Pleiades, with 0.5 m per pixel, is required for construction of digital elevation models (DEMs), for surface change monitoring of objects, operational expansion, and calculation of rock dump and tailing storage facility volumes.
Synthetic aperture radar
Synthetic aperture radar (SAR) utilizes the motion of the radar antenna of the satellite over an area of interest to provide finer spatial resolution than conventional beam-scanning radar. The output can be used to construct two- or three-dimensional models of the land surfaces or objects (Iannacone et. al., 2018). Interferometry SAR (InSAR) uses the phase difference between two or more SAR images acquired at different times to derive surface deformation (Iannacone et. al., 2018) and is applied to surface movement monitoring (SMM). The method requires that the surface conditions do not change throughout the period analysed and that the same reflectors appear in each image (Iannacone et. al., 2018). SAR can collect data both day and night and is not affected by cloud cover, making it ideal for use in areas with persistent cover, such as the tropical belt. This method is also able to detect surface elevations changes as small as 3 mm.
Databases
Satellite data cannot be used in isolation; it is a value-add product within the larger database. A typical diamond mining data-set would contain maps, aerial photos and satellite images, and results from ground truthing and geochemical surveys. Remote sensing platforms include thematic mapping, hyperspectral and multispectral imaging, and high-resolution panchromatic imaging. Exploration targets require an integrated geographic information system (GIS) targeting database, that would typically include, for example, Landsat, Sentinel, SPOT, Radarsat, ASTER, and Hyperion satellite data.
Ground truthing data would include the results from geophysical methods such as aeromagnetic and gravity surveys, surveyed maps, and mineralogical and geochemical sampling results. This allows for thematic mapping of kimberlite indicator minerals (KIM) e.g. garnet and ilmenite and soil index pathfinder analyses.
Exploration
Kimberlite exploration
Hyperspectral satellite data has been extensively used to delineate features and trends, combining these with geomorphology, drainage patterns, and structural zones that are considered favourable for hosting kimberlite intrusions. Extensive work has been done using satellite imagery in India, e.g. in the Mahabubunagar area (Nandhagopal et al., 2015) and Chhatarpur district (Guha et al., 2018). Ishmukhametov (2016) suggested that LANDSAT-7 ETM+ satellite images could be used in conjunction with geological, geophysical, and mineralogical data to delineate diamondiferous kimberlite pipes in the poorly explored areas of Siberia.
A combination of airborne magnetics, Advanced Spaceborne Thermal Emission and Reflection Radiometer (ASTER), and Landsat Thematic Mapper images was used to identify potential kimberlite targets in South Africa's Northern Cape and Free State provinces (Tessema, Nefale, and Sebake, 2012). The nature of each kimberlite target was evaluated and ranked based on a comparison of the strength of the magnetic anomaly and the size and geometry of the magnetic signature. The spectral angle mapping (SAM) method was applied to the most promising targets, with the first nine ASTER bands, to distinguish kimberlite indicator minerals (KIM): ilmenite, serpentine, olivine, and phlogopite (Tessema, Nefale, and Sebake, 2012). The ilmenite and phlogopite distributions form linear patterns, which coincide with palaeochannels.
Pendock (2018) suggested that kimberlite weathering products and some of the main KIM can be mapped using ASTER long-wave infra-red (LWIR) imagery. This is used as a proxy for large-scale geochemical mapping. The relatively low resolution of 90 x 90 m per pixel makes it viable only as an guide to large areas of interest, whereas a kimberlite intrusion would measure in the order of a couple of hundred metres in diameter or manifest as extensive dyke development (Pendock, 2018). Pendock (2019) also suggested that thermal data from MODIS, supplemented with ASTER hyperspectral data, can be used as a high-level proxy for gravity surveys.
Alluvial deposit exploration
There tends to be an association between the richness of an alluvial deposit and its geomorphology (de Wit and Thorose, 2015), making high-resolution DEMs a critical data-set. The DEM is used to distinguish between paleochannels, alluvial flats, and terraces. The grades in alluvial flats and floodplains tend to be higher than in terraces. Figure 1 shows an example of a digital surface model (DSM) generated on the FarEarth Change Monitor platform. The heat map indicates elevation differences, with cool colours demarcating the higher elevations and warm colours the lower elevations. The hill shading option provides a textured appearance to aid in the visual evaluation of the model.
High-resolution optical images are used to identify potential trap sites, such as depressions or potholes or other geomorphological structures that can act as natural traps. The size and distribution of artisanal workings can also be detected and plotted to delineate the potential extent of an alluvial deposit, utilizing temporal satellite imagery. Fresh excavations tend to have lighter coloured spoil heaped on the edges, cleared vegetation, and are not filled with water. Artisanal workings will tend to follow the trend of recovery of the largest stones, which could be used to infer the setting of the paleochannel, and this can also be used to project potential deposit areas upstream or downstream.
Pendock (2019) suggests that paleo-gravel deposits could be identified by estimating the resistivities from SAR imagery as a proxy for ground penetrating radar (GPR). It is further suggested that L-band radar with 23.5 cm wavelength from a high-resolution sensor (e.g. 2.5 m) could also be used to identify gravel deposits (Pendock, 2019), owing to a high correlation with electromagnetic (EM) data from the Orange River alluvial deposits.
Life-of-mine
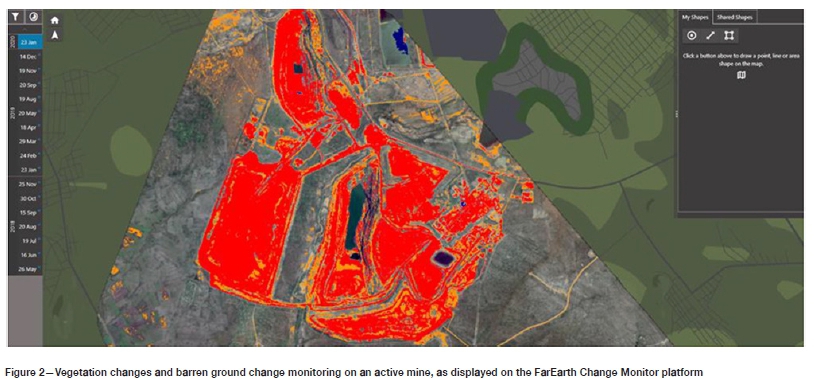
Monitoring of operations during the life-of-mine ranges from change detection to estimation or calculation of volumes. Change detection is most often used to keep track of changes on the surface, from infrastructure to vegetation and surface water, with purpose-built platforms such as FarEarth Change Monitor. High-resolution optical satellite images are incorporated into the platform. In the case study, barren ground is indicated in orange and development on the mining area in red, with water in blue (Figure 2).
Once a reference DEM has been generated, photogrammetry can be applied to calculate volume gains and losses. Volume calculations can be done 'on the fly' by cloud-hosted platforms like Stack Insight. As a first pass, volume gains or losses are indicated by cool or hot colours respectively. Volume changes can be calculated between two acquisitions over an area of interest, defined by a polygon. In the example in Figure 2, the volume increases of the dumps and volume decreases in the open pits are shown along with the relative changes in volume over the selected area.
Comparative results between high-resolution Pleiades imagery DEM products and LiDAR-derived products have indicated a volume difference of less than 2% at Sishen mine (Airbus, 2017) as part of a validation study. Volumetic accuracy was measured over areas ranging from 30 000 m2 to 180 000 m2, with volumes ranging between 200 000 m3 and 3 million m3 (Airbus, 2017) and it was found that as the volume increases, the error decreases. An elevation accuracy study was conducted over areas ranging from flat horizontal plains to areas being actively mined. The size of the areas ranged from 700 000 m2 to 2 million m2 (Airbus, 2017). A statistical comparison found the difference measured between the mean elevation of the LiDAR- and Stack Insight elevation model to be between 22 cm and 56 cm, which can be attributed to different reference planes used (absolute error). The standard deviation of the difference in elevation is an indication of the accuracy of and noise in the data (Airbus, 2017). Other factors that may influence accuracy include: quality of the ground truthing, or homogeneous areas with few recognizable features (Airbus, 2017), e.g. due to thick snow or vegetation cover that obscures the surface
Stability monitoring of dumps that have reached their design capacity is done by InSAR. InSAR measures the difference in coherence over a temporal period, with an accuracy down to several millimetres. Mining-induced subsidence can also be monitored with InSAR. In both cases, subsidence is indicated as heat maps on platforms such as FarEarth Change Monitor and included as part of the risk assessment and remediation process where the mining-induced subsidence may pose a risk to surface infrastructure or to communities close to the active or closed operation.
Post-closure
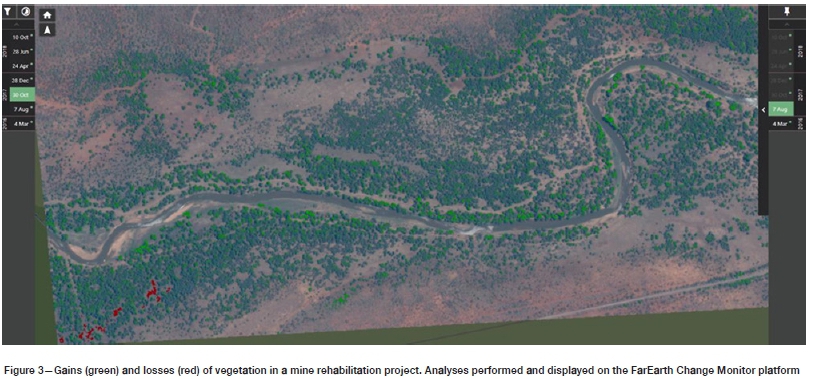
Most countries require a post-closure monitoring and rehabilitation programme for the mine. Optical satellite imagery obtained at regular intervals can be used to monitor any surface changes, such as erosion or illegal mining of dump material or illegal entry into the mining area, or to evaluate the success of re-vegetation. In the example in Figure 3, the gain of vegetation on part of the rehabilitation project is indicated in green, and the area where a loss of vegetation occurred over the same period is indicated in red. A platform like FarEarth Change Monitor will use a series of temporal images to indicate notable surface changes between acquisitions, which the monitoring team can respond to. The basis of the change monitoring is the difference in the Normalized Difference Vegetation Index (NDVI) between acquisitions. Vegetation indices employ a difference formula to quantify the density of plant growth (Equation [1]). Calculations of NDVI for a given pixel always result in a number that ranges from -1 to +1; however, an absence of green leaves gives a value close to zero (NASA, 2000).

where NIR is near-infrared radiation and VIS is visible radiation.
In the case study (Figure 3) a gain between acquisitions is indicated in green and areas of vegetation loss in red. It is also possible to display gains and losses as a time series and phenology curves.
Ethical sourcing
Awareness of the issue of conflict diamonds led to the creation of the Kimberley Process (KP), with the aim of preventing conflict diamonds from entering the market (Kimberley Process, 2020). Optical satellite imagery is employed to detect and monitor artisanal diggings in proximity to mining operations and known conflict areas. Artisanal diggings can be identified by clearing of vegetation, increases in bare ground areas, and ponding of surface water for gravel washing. Artificial intelligence (AI) systems such as FarEarth Change Monitor, where propriety algorithms have been developed, can be trained to detect clusters of these features over large monitoring areas and alert authorities to new or resumed activities.
The detection and the monitoring of artisanal diggings is done by comparison of element differences between two acquisitions. As most artisanal diggings are in virgin territory, the most notable effect is loss of vegetation, which can be detected through changes in the NDVI, textural changes, or surface colour changes. This type of data is obtained from high-resolution optical imagery, such as Pleiades with 0.5 m resolution and four bands (red, blue, green, and near-infrared). Pagot et. al. (2008) proposed that a bi-temporal data-set allows information on the evolution of the activity to be derived from an object-oriented classification of sets of satellite imagery. Mapping of these diggings to produce DSMs would, however, require metadata to be incorporated from unmanned aerial vehicle (UAV) imagery.
Chirico and DeWitt (2017) used DSMs derived from high-resolution ortho-images from wide-angle and narrow field of view camera systems to map artisanal pits.
The case study (Figure 4) demonstrates the detection of new diggings in an abandoned alluvial diamond mine located in the North-West province of South Africa. A series of temporal optical satellite images indicates the locations of disturbed surface features.
Other applications would potentially include monitoring the extent and increase of illegal or artisanal activity in proximity to diamond operations in risk areas. By comparing the volume of material processed by the legal operation and the reported carats per 100 m3 and the logged purchases from registered small-scale operators supplying the mine, it is possible to do a reconciliation of the volumes of the parcels offered for auction. If there is a notable discrepancy, the operation might be placed under scrutiny. There is, however, the risk that this method would not account for any potential variation in grade, specifically when the operators move from a high-grade area to a low-grade area. It is therefore critical that diamond recovery by the operator is diligently recorded, and that mineral and geological reports are kept up to date, audited, and ready for submission.
The introduction of the blockchain led to the development of several proof-of-concept systems. The 'Tracr' blockchain (www.tracr.com) is being developed by De Beers with the aim of of tracking individual diamonds from source to sale. Satellite imagery could potentially be used as part of the provenance body of evidence.
Limitations
The limitations to satellite applications range from physical to economic constraints. Optical images offer the most value in conditions of little or no cloud, fog cover, or smog. Dense vegetation cover also affects the quality of the product, specifically if the aim is for change detection or generation of value-add products like digital elevation modelling. Tasking of satellites to obtain current imagery is costly and this will influence the frequency with which images are collected.
Synthetic aperture radar for subsidence or movement monitoring is viable only if the surface changes are minimal and the temporal InSAR series attains a high degree of coherence. The implication is that active areas cannot be easily monitored for subsidence or movement.
Satellite-based exploration, monitoring. and detection need to be confirmed with ground truthing. The imagery and value-add products aid in reducing costs and time by constraining an area of either high potential or risk. They also reduces risk by largely eliminating the need for staff to enter potentially dangerous areas. Human intervention is still required, however, to investigate, remediate, or resolve the identified issue. The last limiting factor is the relatively high cost associated with obtaining tasked, specifically high-resolution imagery, and processing.
Airborne systems
Airborne systems are used as a supporting method to obtain higher spatial resolution data once the main areas of interest have been identified. Airborne systems offer higher resolution imagery, but also entail a relatively high cost to fly the survey and produce the higher levels of processed data. Airborne data acquisition is done from light aircraft at altitude and can cover approximately 800 km2 to 1800 km2, depending primarily on the pixel size required, and can have a resolution of between 3 m and 12 m. The imagery is then processed to various levels and a mineral map produced that could indicate mineral species, abundances, and geochemistry. This data is then merged with supporting ground truth and GIS data in a similar manner as the satellite imagery. De Beers pioneered airborne hyperspectral SWIR systems for diamond exploration. Similar systems have been developed by mining companies such as Anglo American (Köstlin, 2000) and commercial companies for mineral exploration, mineral mapping, and remote sensing.
Conclusions
Satellite-based methods can be applied to the entire life of a diamond project, from exploration, throughout the life-of-mine, and beyond closure. The type of imagery and the pairing with other data are determined by the type of deposit, either primary kimberlite or secondary alluvial. Mine planning and reconciliation, along with survey, can be supplemented with satellite imagery and value-add products. Secondary applications range from environmental monitoring and safety to demonstrating compliance with ethical sourcing requirements.
Post-closure activities are supported through satellite-based change monitoring. Satellite data helps to focus efforts, resulting in cost and time savings along with increasing safety. The main limitations relate to the ability to acquire imagery and the associated cost.
Acknowledgement
The contributions of an anonymous reviewer to the first draft of this paper are acknowledged with gratitude.
References
Airbus. 2016. Remote monitoring of iron ore mining pits with stack insight. https://www.intelligence-airbusds.com/en/6988-case-study-gallery-details?item=43473#.Xa70f-gzaUk [accessed 1 October 2019]. [ Links ]
Chirico, P.G. and DeWitt, J.D. 2017. Mapping informal small-scale mining features in a data-sparse tropical environment with a small UAS. Journal of Unmanned Vehicle Systems, vol. 5. pp. 69-91. [ Links ]
De Wit, M. and Thorose, E. 2015. Diamond-bearing gravel along the Lower Kwango River DRC. Geology and Resources of the Congo Basin, De Wit, M.J., Guillocheau, F., and de Wit, M.C.J. Springer-Verlag, Berlin-Heidelberg. pp. 341-360. [ Links ]
Guha, A., Rani, K., Bhusan Varma, C., Sarwate, N., Sharma, N., Mukherjee., Vinod Kumar, k., Pal, s., Saw, A., and Jha, S. 2018. Identification of potential zones for kimberlite exploration - an Earth observation approach. International Archives of the Photogrammetry, Remote Sensing and Spatial Information Sciences, vol. XLII-5. p. 201. Proceedings of the ISPRS TC V Mid-term Symposium 'Geospatial Technology - Pixel to People', Dehradun, India, 20-23 November 2018. pp. 239-250. [ Links ]
Iannacone, J.P., Lato, M., Troncoso, J., and Perissin, D. 2018. InSAR monitoring of active, inactive and abandoned tailing facilities. Tailings 2018. Proceedings of the 5th International Seminar on Tailings Management. Santiago, Chile, 11-13 July 2018. Gecamin, Santiago. Abstract volume. 7 pp. [ Links ]
Ishmukhametov, V.T. 2016. Predicting kimberlite diamond deposits in the north of the Siberian Platform on the basis of interpretation of satellite imagery. Moscow University Geology Bulletin, no. 71. pp. 368-371. [ Links ]
Köstlin, E.O. 2000. Technological advances in mineral exploration and exploitation: Staying ahead in the mining industry with geophysics. Proceedings of the 2000 SEG Annual Meeting, Calgary, Alberta, 6-11 August. Abstracts Volume. 2 pp. [ Links ]
NASA. Not dated. Measuring vegetation. https://earthobservatory.nasa.gov/features/MeasuringVegetation/measuring_vegetation_2.php [accessed 22 October 2019]. [ Links ]
Nandhagopal, n., Kumar, R.S., Kannadasan, T., and Bawanhun Mawthoh, M. 2015. Inferences from satellite images for locating kimberlite: Mahabubnagar area, Telangana, South India. Elixir Earth Science, vol. 84. pp. 33547-33553. [ Links ]
Pagot, e., Pesaresi, M., Buda, d., and Ehrlich, D. 2008. Development of an object-oriented classification model using very high resolution satellite imagery for monitoring diamond mining activity. International Journal of Remote Sensing, vol. 29. pp. 499-512. [ Links ]
Pendock, N. 2018. Regional diamond exploration under cover. Proceedings of Diamonds - Source to Use 2018, Johannesburg, South Africa, 11-13 June 2018. Southern African Institute of Mining and Metallurgy, Johannesburg. pp. 103-112. [ Links ]
Pendock, N. 2019. Unpublished Linkedin post. https://www.linkedin.com/in/neil-pendock-41854a58/detail/recent-activity/shares/ [accessed 22 October 2019]. [ Links ]
Tessema, a., Nefale, n., and Sebake, D. 2012. The use of high-resolution airborne magnetic, ASTER and Landsat 7 ETM+ images for identification of kimberlite pipes in the northwestern Free State Province, South Africa. International Journal of Remote Sensing, vol. 33. pp. 4356-4373. [ Links ]
The Kimberley Process. 2020. https://www.kimberleyprocess.com/ [ Links ]
Tracr. https://www.tracr.com/ [accessed: 22 October 2019]. [ Links ]
 Correspondence:
N. Steenkamp
Email: nicolaas@pinkmatter.com
Received: 21 May 2020
Revised: 1 Oct. 2020
Accepted: 2 Oct. 2020
Published: October 2020

