


Services on Demand
Article
 English (pdf)
 Article in xml format
 Article references
Indicators

Related links
-
 Cited by Google
 -
 Similars in Google
Share

 Permalink
Journal of the Southern African Institute of Mining and Metallurgy
On-line version ISSN 2411-9717
Print version ISSN 2225-6253
J. S. Afr. Inst. Min. Metall. vol.120 n.9 Johannesburg Sep. 2020
http://dx.doi.org/10.17159/2411-9717/1146/2020
PAPERS OF GENERAL INTEREST
Assessment of whole-body vibration exposure of mining truck drivers
B. ErdemI; T.DoganII; Z. DuranIII
IMining Engineering Department, Sivas Cumhuriyet University, Turkey. https://orchid.org/0000-0002-1226-9248
IIIndustrial Engineering Department, Sivas Cumhuriyet University, Turkey. https://orchid.org/00000-0002-2628-4238
IIISivas Vocational School, Sivas Cumhuriyet University, Turkey. https://orchid.org/0000-0002-9327-8567
SYNOPSIS
Whole-body vibration (WBV) exposure measurements taken from 105 truck drivers employed in 19 mines and other workplaces were evaluated with the criteria prescribed in EU 2002/44/EC directive, BS 6841 (1987), ISO 2631-1 (1997). and ISO 2631-5 (2004) standards. The highest vibration acceleration was measured on the vertical Z-axis. The highest WBV exposure occurred in the RETURN, HAUL, and SPOT phases while the lowest exposure took place in the LOAD and WAIT phases. Crest factors on all axes were generally greater than nine, yet strong correlation coefficients were achieved in VDV-eVDV analyses. Driver seats generally dampened the vibration along the Z-axis but exacerbated it along X and Y axes. The dominant frequency for the X and Y-axes rose up to 40 Hz while it ranged between 1 Hz and 2.5 Hz along the Z-axis. While the probability of an adverse health effect was higher with BS 6841 (1987) and ISO 2631-1 (1997) standards, it was low according to EU 2002/44/EC and ISO 2631-5 (2004). The 91 t, 100 t, and 170 t capacity trucks produced lower vibration magnitudes. Drivers were exposed to approximately equivalent levels of WBV acceleration and dose in contractor-type trucks and mining trucks. Rear-dump trucks exposed their drivers to a slightly higher level of vibration than bottom-dump trucks. Underground trucks exposed their drivers to a significantly higher level of vibration than mining trucks. Both driver age and driver experience were inversely proportional to vibration acceleration and dose. Conversely, there was a positive relationship between the truck service years and the WBV acceleration and dose to which drivers were exposed to. Loads of blocky material exposed drivers to higher vibration acceleration and dose levels than non-blocky material.
Keywords: whole-body vibration, mining truck, A(8), BS 6841, EU 2002/EC/44, ISO 2631-1, ISO 2631-5, VDV(8).
Introduction
Operators of trucks, buses, locomotives, helicopters, heavy machinery, and farm equipment as well as workers using vibrating machines are exposed to occupational whole-body vibration (WBV). Continuous exposure to mechanical vibration can cause irreversible physical damage, depending on the intensity and frequency of the vibration. The International Labour Organization (ILO, 1977) described vibration as a professional hazard, emphasising that 'measures should be taken to protect workers from vibration' and that the responsible authorities should establish criteria to determine the hazard.
There is consensus among researchers about the vibration exposure of machinery operators and the long-term adverse health effects of WBV (Miyashita et al., 1992; Mandal and Srivastava, 2010; Aye and Heyns, 2011). Risk factors include muscle fatigue, decreased stability, vestibular dysfunction, and impairement to the female reproductive system (Seidel and Heide, 1986; Bongers et al., 1988; Griffin, 1998). Frequencies between 1 Hz and 20 Hz can cause damage to the body in the form of back pain, spinal degeneration, stomach problems, headache, and sleep problems (Thalheimer, 1996; Okunribido, Magnusson, and Pope. 2006; Eger et al. 2008).
Factors affecting WBV exposure such as operating conditions, tonnages, service lives of machinery, and properties of the material handled were evaluated individually or collectively. Mandal et al. (2006) stated that 18% of the workers in the Indian mining industry were subjected to occupational vibration. Noorloos et al. (2008) reported that the vibration magnitude caused by a vehicle depends on many factors such as conditions of the site, maintenance status, operator's driving style and speed, type of propelling mechanism, type of seat, characteristics of material handled, and operator experience. In contrast, Darby, Heaton, and Mole (2010) stated that the exact cause of back pain is unclear, but back pain is more common in those working over long distances or on bad ground conditions. They also commented that shocks and sudden jolts during driving would increase pain. Working for prolonged durations in an incorrectly adjusted seat position, sitting for a long time without changing the posture, and exposure to shocks and sudden jolts during operation are among the causes of back pain, the most reported effect of WBV exposure. Waters et al. (2008) emphasized the possibility of a causal relationship between working as a heavy equipment operator and lower back pain. However, according to Burgess-Limerick (2012) it is difficult to clearly demonstrate the link between WBV and back pain, as there are many possible causes of back pain.
In a survey conducted by Palmer et al. (2000) it was found that the BS 6841 (1987) limit of 15 m-s-1.75 for the vibration dose value (VDV) during daily operations was exceeded for truck drivers, farmers, agricultural workers, and forklift drivers in Great Britain. Cann, Salmoni, and Eger (2004) studied the effects of driver experience, truck service years, road conditions, truck type, truck mileage, and seat type on WBV exposure. They concluded that the drivers were not subjected to negative health effects caused by daily exposure in accordance with the ISO 2631-1 (1997) standard. In an evaluation of dumper operators' WBV exposure in India, Mandal and Srivastava (2010) found that the RMS acceleration values along the dominant Z-axis ranged from 0.644 m/s-2 to 1.820 m/s-2. When evaluated together with an average daily exposure of 5 hours, it was found out that all dumpers caused high health risks according to the ISO 2631-1 (1997) standard.
Previous studies indicate that vehicles of different models affect WBV exposure. Village, Morrison, and Leong (1989) studied mining trucks and reported that vehicle size plays an important role in WBV exposure. Maeda and Morioka (1998) found that heavy road conditions caused an increase in WBV exposure of garbage truck drivers. In contrast, Noorloos et al. (2008) conducted surveys of 467 participants using various types of vehicles, including automobiles, minibuses, trucks, wheel loaders, dumpers, excavators, bulldozers, steamrollers, mobile cranes, and asphalt machines. There was no significant relationship between WBV exposure and low back pain, which was attributed to the small number of samples. Lundström and Holmlund (1998) reported that the WBV acceleration recorded in the Z direction was much more detrimental than vibration in the X and Y directions, supporting other studies and the ISO 2631-1 (1997) standard.
Nishiyama, Taoda, and Kitahara (1998) conducted a study on a small number of samples in order to evaluate drivers' back pain and determined that old model trucks caused higher WBV exposure. Kumar (2001) recorded the vibration measurements to which dumper operators in open-pit mines were subjected along three orthogonal axes. Vibration-induced effects were detected in operators' third lumbar and seventh neck vertebrae. The data obtained from new and old trucks of different makes and carrying capacities revealed that the exposure threshold of ISO 2631-1 (1997) has been exceeded. In another study, Kumar (2004) commented that the driver's gender and truck capacity have no significant impact on vibration; however, the body mass of the driver, the vehicle segment, and the measurement region showed significant differences in vibration. He concluded that heavy mining trucks pose a significant health hazard to operators in extreme mining conditions and generate WBV accelerations that often exceed ISO standards. Smets, Eger, and Grenier (2010) evaluated the vibration exposure of heavy truck drivers against the ISO 2631-1 (1997) and ISO 2631-5 (2004) standards. According to the ISO 2631-1 (1997) criteria, drivers were exposed to vibration levels above the daily exposure limit, but there was a low probability of adverse health effects in accordance with ISO 2631-5 (2004). The authors emphasized the discrepancy between the two standards.
Mayton, Jobes, and Miller (2008) and Mayton et al. (2018) found that old trucks gave higher vibration values, with the vibration acceleration in the Z-axis being dominant. An evaluation of the WBV and GPS position data revealed that most of the shocks occurred during loading and unloading, and from the potholes in the road. In another study by Mayton, Jobes, and Gallagher (2014) if was found that roughly half of the dominant vibration was either in the Z-axis or Y-axis. Frimpong, Galecki, and Chang (2011) stated that significant improvements in production and economy have been achieved with the use of trucks of larger than 360 t capacity and electric excavators of >90 t per cycle. However, in terms of operator health, significant negative side effects of continuous work and long working hours were also revealed.
In this study, WBV exposure measurements taken from the driver's seat in 105 trucks of different types, brands, and models, which were deployed in several open pits and one underground mining operation in Turkey, were analysed. The assessment of truck drivers' WBV exposure was based on four criteria; BS 6841 (1987), ISO 2631-1 (1997), European Directive 2002/44/ EC (2002), and ISO 2631-5 (2004). The potential health risk categories described in each criterion are given in Table I.
Materials and method
Data acquisition
The seat accelerometer, which was mounted in a polyurethane housing, was placed and secured on the seat pan to accommodate the driver's ischial tuberosities. A floor-type accelerometer was used to determine the seat effective amplitude transmissibility (SEAT) factor. It was placed on the floor in an appropriate position, very close to where the seat foot joins the floor. In order to prevent any shock-induced damage caused by the operator to the highly sensitive accelerometer, a steel container was built and attached to the floor with strong magnets.
A SV106 model six-channel vibration analyser (serial no. 34613) manufactured by Svantek Ltd (2013) was used to record and process data from the accelerometer's 1/3-octave (with the centre frequencies from 2.50 kHz down to 0.40 Hz) digital passband filters in real time. The sampling rate was 6000 Hz with 16-bit resolution. Measurement results were stored on a micro-SD flash card and downloaded to a PC using a USB interface, and processed on the environmental monitoring module of the SvanPC++ software (Svantek, 2015).
A SV38V triaxial seat-type disk accelerometer (serial no. 32980) was used to determine drivers' WBV exposure at the seat pan. This required a supply voltage of 5.2 V DC and had a sensitivity of 50 mV/(m/s2) at 15.915 Hz. Another SV151 triaxial accelerometer (serial no 31359) was used to determine the vibration level on the cabin floor. It required a supply voltage of 3.3 V DC and had a sensitivity of 5.81 mV/(m/s2) at 15.915 Hz. The instrumentation set-up is shown in Figure 1.

Vibration measurement
A haul truck cycle is composed of five consecutive phases: approaching the loader or dumping point at reduced speed (SPOT), being loaded when it is immobile (LOAD), travelling with a full load (HAUL), offloading when it is immobile (DUMP), and travelling with no load (RETURN). Apart from the DUMP and SPOT phases, the truck may come to a complete halt with the engine idling in a specific phase. In this situation, that part in the acceleration-time log is regarded as a separate phase (WAIT). Lastly, the overall WBV exposure of the driver in a typical truck cycle was recorded in (RECORD). It should be noted that although effort was made to monitor at least a complete truck cycle, a few records did not include all phases. For example, a driver moved to park the truck instead of travelling to the loading point after dumping, as he thought the shift had finished.
The WBV exposure was recorded from six channels, three of which were from the seat (SeatX, SeatY, SeatZ) and three from the cabin floor (FloorX, FloorY, FloorZ) in accordance with TS EN 1032+A1 (TSE, 2011), which refers to ISO 2631-1 (1997). The frequency-weighted acceleration (aw), vibration dose (VDV), maximum transient vibration value (MTVV), peak vibration acceleration (PEAK), and peak-to-peak vibration acceleration (P-P) were recorded on both the seat pan and the cabin floor. The recording times varied from 00:04:46 hours to 00:52:37 hours.
A researcher travelled with the driver to observe the hauling operation during the recording process. A precision stopwatch was started simultaneously with the vibration analyser, to mark the start and finish times of the phases of a cycle. For all cases, the first 10 seconds were removed from the RECORD as it was observed that the driver's involuntary movements while he was trying to sit down on or get up from the seat could result in very high vibration accelerations.
Parameters related to WBV in all phases were calculated in accordance with the ISO 2631-1 (1997) and ISO 2631-5 (2004) standards.
BS 6841 (1987) uses the wb frequency weighting filter for the vertical accelerations on the seat cushion, while ISO 2631-1 (1997) utilizes the wk frequency weighting filter. As there are minor differences between the two frequency weighting filters, in this study, data recorded with the wk filter was used while assessing the probability of adverse health risk in accordance with both standards.
Contrary to ISO 2631-1 (1997), the vibration dose for the seated person is calculated using different multiplying factors (unity for all axes) according to the BS 6841 (1987) standard. For this reason, the daily vibration dose values were calculated according to both standards and the driver exposures were evaluated by considering the health risk criteria of the relevant standards given in Table I.
Study domain
Out of 105 trucks 33 were of 30 t nominal load capacity, 48 of 77 t, two of 91 t, three of 100 t, and 19 of 170 t. The 30 t units were typical contractor trucks while the remaining 72 were mining trucks. All contractor trucks and 69 out of the 72 mining trucks were dumpers, while the three trucks of 100 t capacity were bottom-dump machines.
All mines, trucks, and drivers were coded. The test sites included coal, gold, and iron mines; aggregate, marble, gypsum, clay, and limestone quarries, road construction sites, and ore preparation and scrap iron plants. The types of trucks and operations from which WBV exposure measurements were taken are illustrated in Figure 2. Distribution of trucks among workplaces is given in Table II.

Results and discussion
RECORD phase
Evaluation by vibration acceleration
The equivalent vibration acceleration normalized to an 8-hour shift, A(8) on the driver's seat of the trucks for the worst-case axis (WCA) ranged from 0.319 m/s2 to 1.172 m/s2, with mean and standard deviation of 0.707 ± 0.174 m/s2. On the other hand, A(8)xyz for the vector sum (VS), as recommended in BS 6841 (1987), ranged from 0.427 m/s2 to 1.444 m/s2 with mean and standard deviation 0.949 ± 0.198 m/s2.
The WCA with the highest vibration was the Y-axis in 9 trucks, and the Z-axis in 96 trucks. This result is corroborated by previous studies (Özkaya, Goldsheyder, and Willems, 1997; Newell, Mansfield, and Notini, 2006). The vibration acceleration measured by Cann et al (2005) was 0.79-0.83 m/s2 on the X-axis, 0.81-0.97 m/s2 on the Y-axis, and 1.08-1.36 m/s2 on the Z-axis. In a study on 18 trucks, Mandal and Srivastava (2010) recorded the highest vibration on the Z-axis. Measured values ranged from 0.64 m/s2 to 1.82 m/s2 and the average was 1.10 m/s2. Eger et al. (2011) recorded vibration values in the dominant Z-axis between 0.89 m/s2 and 1.18 m/s2. Chaudhary, Bhattacherjee, and Patra (2015) measured the highest vibration value in the Z-axis as 1.61 m/s2. In the study by Burström et al. (2016), which included 95 machines of different models and capacities, the daily average vibration exposure was between 1.9 and 6.7 hours, and the average A(8) value ranged from 0.2 m/s2 to 1.0 m/s2.
Table III shows that according to the EU 2002/44/EC (2002) directive, the vast majority of the trucks are within the health guidance caution zone (HGCZ) when the WCA and VS criteria are taken into consideration. Considering the WCA criterion according to ISO 2631-1 (1997), which is more conservative, the majority of the trucks again remain within the HGCZ, while the greater part of the trucks are above the daily ELV limit as per the VS criterion as the averaged A(8) and A(8)xyz are just below and above the 0.90 m-s-2 limit respectively.
Considering the WCA criterion, the time required to reach the daily exposure action value (EAVTT(RMS)) of truck drivers ranged from 01:27:22 hours to 19:37:45 hours with mean and standard deviation of 04:53:00 ± 2:50:52 hours. The time required to reach the daily exposure limit value (ELVTT(RMS)), however, ranged between 07:42:09 and 103:50:20 hours with mean and standard deviation 25:50:00 ± 15:03:52 hours. In this case, 95 out of 105 trucks exposed their drivers to enough vibration to reach the daily exposure action value (EAV) before the end of the 8-hour shift, while only one truck reached the daily exposure limit (EL) before the end of the shift.
The crest factor shows the sudden load and shocks to which the drivers are exposed. In cases where this is greater than nine, exposure assessment should be done by considering the vibration acceleration and vibration dose values together in accordance with ISO 2631-1 (1997). In the RECORD phase, the crest factor was greater than nine for 51 trucks in the X-axis, 36 trucks in the Y-axis, and 70 trucks in the Z-axis (Table IV). Yet, in another study on nine trucks by Mandal et al. (2006) the crest factor was between 4.4 and 8.2.

The frequency spectrum of WBV acceleration was evaluated with 1/3 - octave band distribution. The dominant frequency ranged between 10 and 40 Hz on the X-axis, 20-40 Hz on the Y-axis, and 1-2.5 Hz on the Z-axis. Village, Morrison, and Leong (1989) found that the dominant frequencies were between 1.6 and 2 Hz in the X- and Y-axes and 3.15 Hz in the Z direction. Sherwin et al. (2004) recorded the highest vibration value on the Z-axis with 3.2 Hz as the dominant frequency. Mansfield, Newell, and Notoni (2009) found that less than 1% of the vibration energy in the Z-axis was below 1 Hz. According to Smets, Eger, and Grenier (2010) the dominant frequencies were in the range of 1 Hz to 1.25 Hz.
The SEAT value, which shows the vibration isolation efficiency of the driver's seat, ranged from 0.494 to 1.702 for the X-axis, from 0.732 to 1.600 for the Y-axis, and from 0.589 to 1.286 for the Z-axis. The vibration was attenuated in 21 trucks in the X-axis, 12 in the Y-axis, and 75 trucks in the Z-axis. Driver seats attenuated vibration in the Z-axis while amplifying it in the other axes.
Evaluation by vibration dose
The equivalent vibration dose normalized to an 8-hour shift, VDV(8), on the driver's seat of trucks ranged from 7.684 m-s-1.75 to 32.914 m-s-1.75 with a mean and standard deviation of 15.479 ± 4.414 m-s-1.75. VDV(8)xyz ranged from 8.366 m-s-1.75 to 33.754 m-s-1.75 with a mean and standard deviation of 16.820 ± 4.130 m-s-1.75. According to the measurements taken by Mandal et al. (2006) on nine trucks, VDV values ranged from 7.71 m-s-1.75 to 13.0 m-s-1.75. Vanerkar et al. (2008) reported that the average vibration dose in 60 dumpers in an open pit iron operation was 10.81 ± 3.44 m-s-1.75, and the average for a bauxite mine was 9.27 ± 3.98 m-s-1.75. In a study on 18 trucks, VDV(8) ranged from 6.05 m-s-1.75 to 25.13 m-s-1.75 (Mandal and Srivastava, 2010). Burström et al. (2016) reported VDV(8) values between 7 m-s-1.75 and 17 m-s-1.75.
A comparison of the VDV(8) and VDV(8)xyz values of all trucks with the HGCZ limits according to BS 6841 (1987), ISO 2631-1 (1997) and EU 2002/44/EC (2002) is presented in Table III. When the exposures are examined with reference to ISO 2631-1 (1997) and EU 2002/44/EC (2002), the majority of trucks fall within the HGCZ when the WCA and VS criteria are taken into consideration.
Similarly, considering the WCA criterion according to BS 6841 (1987) standard the majority of trucks fall below the hazard limit of 15 m-s-1.75. According to the VS criteria, more than half of the trucks remained in the area below the hazard limit. The smooth transition of truck units between criteria could be attributed to the fact that average VDV(8) values fluctuate around the 15 m-s-1.75 limit.
The estimated vibration dose value (eVDV, m-s-1.75) is the cumulative measure of vibration received by a person and is calculated using the frequency-weighted RMS value. As the eVDV is not suitable for shocks, repeated shocks, and intermittent vibration and will give correct results when the crest factor is less than six, it is recommended that the vibration dose value be determined directly from the entire acceleration-time log for vibration recordings where the crest factor is greater than about six (BS 6841, 1987). Of the 105 trucks sampled in the study, the crest factor was greater than six in 105, 101, and 104 trucks in the X-, Y-, and Z axes, respectively. The eVDV - VDV relationship for the trucks is presented in Figure 3. The coefficients of determination of linear regression analyses ranged from 80.57% to 86.90%, indicating a strong correlation although almost all crest factors were greater than six.

In terms of the WCA criterion, the time required to reach the daily exposure action value (EAVTT(VDV)) of truck drivers ranged from 00:02:48 to 15:44:15 hours with a mean and standard deviation of 01:52:01 ± 02:22:29 hours. The time required to reach the daily exposure limit value (ELVTT(VDV)) of truck drivers, however, ranged between 01:19:32 and 446:19:14 hours with mean and standard deviation 52:56:38 ± 67:20:54 hours. 103 out of 105 trucks exposed their drivers to enough vibration to reach the EAV before the end of the shift, while 11 trucks reach the ELV before the end of the shift.
Evaluation by vibration containing multiple shocks
According to ISO 2631-5 (2004), a Sed value less than 0.5 MPa for lifetime exposure indicates a low probability of an adverse health impact caused by vibration, and a value greater than 0.8 MPa a higher probability. Likewise, a daily risk factor (R) below 0.8 for a certain number of working days per year indicates a low probability of an adverse health effect, while values greater than 1.2 pose a high probability of adverse health effects.
Sed values, which were calculated using acceleration values measured at the seat pad (asx, asy, asz) ranged between 0.141 MPa and 1.749 MPa with mean and standard deviation of 0.466 ± 0.240 MPa. The R(IOP) factor ranged between 0.109 and 1.351 with mean and standard deviation 0.401 ± 0.201, and the R(TOP) factor between 0.177 to 2.187, with mean and standard deviation 0.583 ± 0.300.
When the WBV exposure is evaluated with Sed, 70 drivers are exposed to a pressure of less than 0.5 MPa and the probability of adverse health effects due to vibration is low, 23 are exposed to between 0.5 MPa and 0.8 MPa with moderate probability of adverse health effects, and 12 are exposed to greater than 0.8 MPa with high probability of adverse health effects (Table III). Evaluation with the R(IOP) factor reveals that 100 drivers have an R factor less than 0.8 MPa and the probability of an adverse health effect due to vibration is low, four have an R factor between 0.8 and 1.2 with moderate probability of an adverse health effect, and only one has an R factor greater than 1.2 with a high probability of an adverse health effect.
According to the ISO 2631-5 (2004) standard, the majority of drivers fall in the low health risk category. More specifically, according to the Sed criterion, the majority of drivers are unlikely to suffer adverse health effects. According to the R factor, the probability of an adverse health effect for almost all drivers is low. With the ISO 2631-5 (2004) standard, the adverse health risk due to WBV exposure is prominently low compared to the BS 6841 (1987) and ISO 2631-1 (1997) standards and the sEU 2002/44/EC (2002) directive.
Evaluation of truck cycle phases
Evaluation of truck cycle phases by vibration acceleration
Parameters related to the WBV acceleration to which truck drivers were exposed are evaluated separately for the phases of the truck cycle. Assuming that the working shift is composed of a specific phase, averaged A(8), A(8)xyz, EAVTT(RMS), and ELVTT(RMS) values, along with the number of units sampled, are presented in Table V for all phases. For the WCA, the highest WBV exposure occurs during the RETURN phase followed by the HAUL and SPOT phases, while the lowest WBV exposure was recorded in the WAIT phase. The same pattern is observed in the VS criterion.
The health risk severity of the WCA and VS criteria according to the EU 2002/44/EC (2002) directive and ISO 2631-1 (1997) standard in truck cycle phases is presented in Table VI. As far as the WCA criterion is concerned, all drivers were exposed to a vibration level below the HGCZ, indicating a low probability of adverse health risk in the WAIT phase. LOAD is another passive phase, the vibration transmitted to the driver increases only when the loader dumps the bucket into the truck body, while the remaining parts of the phase are quiet in terms of vibration. A similar pattern is observed for the DUMP phase. However, since the VS criterion produces a greater WBV acceleration, more trucks pass into the HGCZ of moderate health risk. In terms of the WCA criterion, the SPOT, HAUL, and RETURN phases are located within the HGCZ. However, according to the more conservative VS criterion, more than half of the trucks are above the HGCZ where an adverse health risk is likely.
Table VII shows the WCA with the highest vibration recorded for all phases. In the RETURN and HAUL phases, where the drivers are subjected to high levels of vibration, and to a lesser degree in the DUMP phase, this is the Z-axis. On the relatively undulating ground characterized by higher rolling resistances than main haul roads, where the truck is manoeuvering to approach the loader or the dump point, the WCA in the SPOT phase was Y, indicating excessive lateral movement. In other words, the WBV delivered to the driver along the vertical Z-axis by the slow-moving trucks in the SPOT phase was less than that along the horizontal Y-axis, where a shaking movement was predominant due to rough ground conditions. A similar pattern is observed in the LOAD phase. The vibrations caused by the material being dumped into the body of the stationary truck jolt it mostly along the sideways (lateral) Y-axis. On the other hand, during the WAIT phase, while the truck was stationary and the engine was running at low speed, the WCA was the Z-axis. In general terms, the WCA was the Z-axis in the phases where the truck was at a higher speed, and the Y-axis in the phases at lower speeds.

Averaged crest factors in all axes in the SPOT, HAUL, DUMP, and RETURN phases are less than the critical threshold of nine. These phases consist of stable sections in terms of vibration, where the driver is less exposed to shocks. In the WAIT phase, where 50 trucks were recorded, the crest factors of 24, 15, and 24 trucks were greater than nine on the X-, Y-, and worst-case Z-axis, respectively. In this phase, where the vehicle is stationary, and therefore the vibration exposure is very low, the crest factor could easily exceed nine, as even small jolts could cause high amplitudes in terms of WBV acceleration. In the LOAD phase, where some 99 trucks were recorded, the crest factor in the driver's seat was greater than nine for 62 trucks on the X-axis, 32 in the Y-axis (the WCA), and 70 trucks on the Z-axis. Shocks on the X and Z axes are greater than the Y-axis, where the highest vibration acceleration values are recorded. This indicates that the driver's seat is subjected to a steadily high acceleration along the Y-axis, and that the shocks on the X and Y axes caused by dumping the bucket are returned to the stationary state more quickly.
Analysis of the SEAT factor in the truck cycle phases revealed that vibration on the cabin floor is attenuated in some of trucks but exacerbated in others in all three axes. Driver seats exacerbated vibration in the X and Y axes in all cycle phases. More clearly, the driver's seat had almost no vibration dampening capability in the Y-axis. Although it exhibited a similar behaviour on the X-axis, the vibration dampening ability here was somewhat better. Yet, the seat dampened the vibration in the Z-axis except for SPOT phase, where the dampening and aggravation numbers were close.
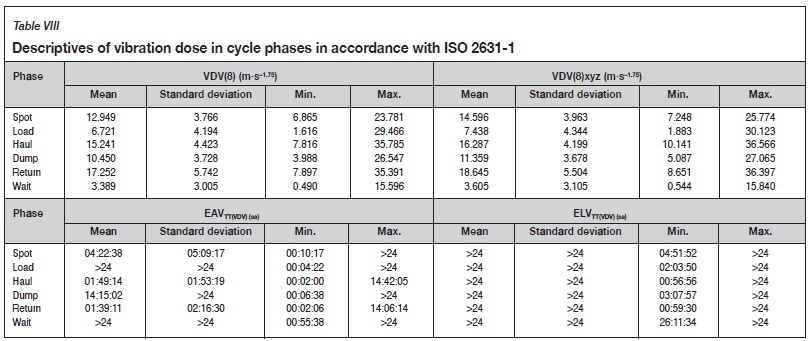
Evaluation of truck cycle phases by vibration dose
Assuming that the working shift is composed of a specific phase, vibration dose values measured in the driver's seat were converted to VDV(8) along the WCA and to VDV(8)xyz for the VS for all phases. The highest level of vibration dose that drivers are exposed to in the seat was in the RETURN phase, followed by the HAUL, SPOT, and DUMP phases. The lowest vibration dose occurs during LOAD and WAIT (Table VIII). Similarly, if the shift only consisted of a certain phase the drivers would, for example, reach the daily exposure action value (EAVTT(VDV)) after 1 hour 39 minutes and 1 hour 49 minutes of work at the RETURN and HAUL phases, respectively. On the contrary, a driver would never reach the daily exposure action value in 24 hours of work if the shift consisted of WAIT or LOAD phases.
The vibration dose values are examined in Table VI for HGCZ limits in accordance with BS 6841 (1987), ISO 2631-1 (1997), and the EU 2002/44/EC directive (2002). In terms of the WCA criterion, most of the trucks fall within the HGCZ in the RETURN, HAUL, SPOT, and DUMP phases. LOAD and WAIT phases are below the HGCZ. When evaluated according to the VS criterion, there are no significant transitions between the HGCZ and the region above the HGCZ according to the ISO 2631-1 (1997) standard and EU 2002/44/EC directive (2002) as the phase averages fall in the HGCZ. Most drivers were exposed to vibration levels below the BS 6841 (1987) hazard limit of 15 m-s-1.75 in phases other than RETURN for both WCA and VS criteria. If the 8-hour shift consisted only of the RETURN phase, most drivers would have been exposed to a vibration dose over the hazard limit before the shift ended, according to both WCA and VS criteria.
Similar to vibration acceleration, the WCA along which drivers were exposed to the highest level of vibration dose is the Z-axis for RETURN, HAUL, DUMP, and WAIT phases (Table IX). Again, the WCA is the Y-axis for the SPOT and LOAD phases in which trucks are stationary or moving very slowly on the undulating ground.

The estimated VDV (eVDV, m-s-1.75) that truck drivers are exposed to was calculated in accordance with the BS 6841 (1987) standard and the eVDV-VDV relationship for all stages is given in Figure 4. Linear regression analyses for all three axes produced coefficients of determination (R2) that varied between 71% and 96%. A strong correlation between the VDV and eVDV relationship is indicated for phases including those with a crest factor greater than six. It should be noted that for the vast majority of trucks, the crest factor is less than six on the X and Z axes only for the SPOT phase. Again, it is less than six on the SPOT, DUMP, and RETURN phases on the Y-axis. In all other cases, it is greater than six.
Evaluation of truck cycle phases by vibration containing multiple shocks
Averaged equivalent static compression dose value (Sed), risk factor for the individual operator R(IOP), and typical operator R(TOP) values of the drivers are presented in Table X for all phases. In general terms, drivers are in the low adverse health risk zone in all phases. If the phases are examined individually, the highest Sed and R factors belong to RETURN and HAUL. The negative health risk assessment of all truck drivers according to the Sed and R factor criteria can be seen in Table VI. In the RETURN phase, 14 drivers are exposed to compression greater than 0.8 MPa, and the potential for adverse health effects due to vibration is high. Twenty-five drivers in the HAUL phase and 17 in the RETURN phase are subjected to a pressure in the range of 0.5 MPa to 0.8 MPa, and the probability of adverse health effects due to vibration is moderate. In other phases, almost all drivers are exposed to a compression level of less than 0.5 MPa and the probability of adverse health effects due to vibration is low. When the drivers are evaluated according to the risk factor (R) criterion, the health risk for almost all drivers is low except for one driver in the RETURN phase.
Statistical analyses
Whole-body vibration data collected in this study was analysed using the SPSS statistics package (George and Mallery, 2010). The effect of differences in truck cycle phases, truck capacity, truck type (contractor truck/mining truck and regular/ underground), unloading mechanism, driver age and experience, truck service life, and material hauled were evaluated by hyphotesis testing. Normality of data was tested prior to analysis by the Shapiro-Wilk test and skewness-kurtosis values. The confidence interval (CI) was chosen as 95%.
The one-way analysis of variance was used to determine whether there are any statistically significant differences between the means of A(8) and VDV(8) levels of truck cycle phases. The difference between the means of phases constituting the truck cycle was examined by the Tamhane test in multiple comparison tables. As far as the vibration acceleration is concerned, there was significant difference between the means of all cycle phases at 95% CI. For the vibration dose, there was no significant difference between the HAUL, RETURN, and SPOT phases, but there was a statistically significant difference between all other phases at the 0.05 level.
In order to analyse the effect of hauling capacity on vibration level, trucks were grouped based on hauling capacity; 30 t (33 trucks), 77 t (48 trucks), 100 t (two 91 t and three 100 t), and 170 t (19 trucks). The difference between group means was examined by the Tamhane test in multiple comparison tables. Both for the vibration acceleration and vibration dose, there was a statistically significant difference between 30 t and 170 t trucks and between 77 t and 170 t trucks at the 0.05 level.
The independent sample test was used to determine whether WBV acceleration and dose levels changed significantly with truck type. There were 33 contractor trucks and 72 mining trucks. There was no significant difference between the group means. Thus, 30 t contractor trucks and >77 t mining trucks expose drivers to equivalent levels of vibration acceleration and dose.
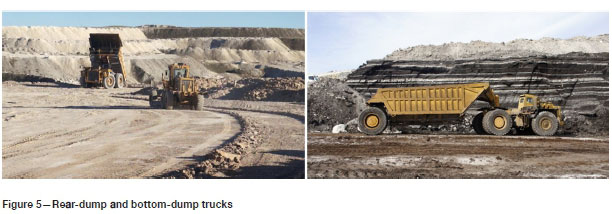
The independent sample test was used to determine whether WBV acceleration and dose levels changed significantly with unloading method. There were three bottom-dump trucks and 102 rear-dump trucks (Figure 5). There was no significant difference between group means, revealing that bottom-dump and rear-dump trucks exposed drivers to equivalent levels of vibration acceleration and dose.
To investigate the effect of driver age on vibration exposure, drivers were grouped based on age; 20-30 years (11 drivers), 31-40 years (46 drivers), 41-50 years (41 drivers), and >51 years (7 drivers). The difference between group means was examined by the Tukey test in multiple comparison tables. Both for the vibration acceleration and vibration dose, there was not a statistically significant difference between age groups at the 0.05 level.
Any likely effect of driver experience on vibration exposure was examined. Drivers were grouped based on experience; 1-5 years (27 drivers), 6-10 years (37 drivers), 11-15 years (20 drivers), 16-20 years (13 drivers), 21-25 years (3 drivers) and >26 years (5 drivers). The difference between group means was examined by the Tukey test in multiple comparison tables. For the vibration dose, there was not a statistically significant difference between age groups at the 0.05 level. For the vibration acceleration, there was a statistically significant difference between 1-5 years experience group and 16-20 years experience group at the 0.05 level.
To study the impact of truck service life on vibration exposure, trucks were grouped: 1-10 years (31 trucks), 11-20 years (22 trucks), 21-30 years (6 trucks) and 31-40 years (46 trucks). The difference between group means was examined by the Tamhane test for vibration acceleration and the Tukey test for vibration dose in multiple comparison tables. Both for the vibration acceleration and vibration dose, there was a statistically significant difference between the 11-20 years of service life group and 31-40 years of service life group at the 0.05 level.
The independent sample test was used to determine whether WBV acceleration and dose levels changed significantly with working environment. There were 103 units allocated to surface operations and two in underground operations. A significant difference between group means showed that surface and underground working environments exposed drivers to different levels of vibration acceleration and dose.
The independent sample test was used to determine whether WBV acceleration and dose levels changed significantly with material hauled. While marble, gypsum, and limestone quarries were characterized by blocky material, the clay quarry, road construction site, mineral processing plant, and scrap iron plant provided representative examples of non-blocky material. Figure 6 depicts typical scenes of handling blocky material in the upper row and non-blocky material in the lower row. Forty-seven trucks hauled blocky material and 58 hauled non-blocky material. There was no significant difference between the group means, indicating that different materials hauled exposed drivers to equivalent levels of vibration acceleration and dose.

The independent sample test was used to determine whether WBV acceleration and dose levels differed significantly with cycle phase. Trucks were grouped based on cycle phases; laden (HAUL, 104 units) and unladen (RETURN, 102 units). A significant difference between group means illustrated that change in cycle phase exposed drivers to different levels of vibration acceleration and dose.
The independent sample test was used to determine whether WBV acceleration and dose levels changed significantly with vehicle speed. HAUL, with 104 units, was accepted as a speedy phase and SPOT, with 89 units, as slow. For the vibration dose, there was no significant difference between HAUL and SPOT, but for the vibration acceleration there was a statistically significant difference at the 0.05 level. Thus, different vehicle speeds exposed drivers to different levels of vibration acceleration.
In a similar effort, trucks were grouped based on cycle phases; speedy (RETURN, 102 units) and slow (SPOT, 89 units). The independent sample test was used to determine whether WBV acceleration and dose levels changed significantly with vehicle speed. For vibration acceleration and vibration dose, there was a significant difference between RETURN and SPOT at the 0.05 level.
Conclusions
Whole-body vibration exposure measurements were taken from 105 trucks of different make, model, and capacity used in open-pit and underground mines. The measurements were evaluated through the work cycle phases of the machines by using a vibration analysis package. Thus, the entire and phase-based vibration exposure of all operators could be determined separately. Operator exposures were evaluated on the worstcase axis and vector sum approaches by taking into account the vibration acceleration and the vibration dose parameters in accordance with the EU 2002/44/EC (2002) directive, ISO 2631-1 (1997), and BS 6841 (1987) standards and by the daily equivalent pressure dose and the risk factor parameters in accordance with the ISO 2631-5 (2004) standard.
When the operator exposures are evaluated with the worstcase axis and vector sum approaches, taking into account the vibration acceleration (A(8)) and the vibration dose (VDV(8)), vibration exposures are within the HGCZ, which indicates a moderate level of adverse health risk. When the evaluation is made in accordance with ISO 2631-1 (1997), trucks fall in the HGCZ, pointing to a moderate level of adverse health risk. Based on the BS 6841 (1987) standard, which recommends evaluation over the vector sum criterion with more conservative limits, vibration exposures are within the region below the prescribed hazard limit. According to the ISO 2631-5 (2004) standard, when the daily equivalent pressure dose (Sed) parameter is examined with the WCA criterion, trucks are placed in the moderate health risk category. When the evaluation is made according to the vector sum criterion, trucks are located in the low health risk zone. When the R factor is examined according to WCA and VS criteria, vibration exposures are within the low health risk zone.
Acknowledgements
This work is supported by the Scientific Research Project Fund of Sivas Cumhuriyet University under project number M-535.
References
Aye, S.A. and Heyns, S. 2011. The evaluation of whole-body vibration in a South African opencast mine. Journal of the Southern African Institute of Mining and Metallurgy, vol. 111, no. 11. pp. 751-757. https://repository.up.ac.za/bitstream/handle/2263/18670/Aye_Evaluation%282011%29.pdf?sequence=1&isAllowed=y [ Links ]
Bongers, P.M., Boshuizen, H.C., Hulshof, T.J., and Koemeester, A.?. 1988. Back disorders in crane operators exposed to whole-body vibration. International Archives of Occupational and Environmental Health, vol. 60, no. 2. pp. 129-137. https://doi.org/10.1007/bf00381494 [ Links ]
British Standards. 1987. Measurement and evaluation of human exposure to whole-body mechanical vibration and repeated shock. BS 6841, British Standards Institution, London. [ Links ]
Burgess-Limerick, R. 2012. How on earth moving equipment can ISO 2631.1 be used to evaluate whole body vibration? EMESRT Design Evaluation Case Study. 12-01, Earth Moving Equipment Safety Round Table. https://emesrt.org/case-study/case-study-1/ [ Links ]
Burström, I., Hyvarinen, v., Johnsen, M., and Pettersson, H. 2016. Exposure to whole-body vibration in open-cast mines in the Barents region. International Journal of Circumpolar Health, vol. 75, no: 29373. https://dx.doi.org/10.3402%2Fijch.v75.29373 [ Links ]
Cann, A.P., Salmoni, A.W., and Eger, T.R. 2004. Predictors of whole-body vibration exposure experienced by highway transport truck operators. Ergonomics, vol. 47, no. 13. pp. 1432-1453. https://doi.org/10.1080/00140130410001712618 [ Links ]
Cann, A.P., Gillin, E.K., Salmoni, A.W., Vi, P., and Eger, T.R. 2005. Transmissibility of whole-body vibration exposure from floor to seat experienced by scraper operators in the construction industry. Proceedings of the Association of Canadian Ergonomics Conference, Halifax, Canada, 15-18 August 2005. Association of Canadian Ergonomists, Renfrew. [ Links ]
Chaudhary, D.K., Bhattacherjee, A., and Patra, A. 2015. Analysis of whole-body vibration exposure of drill machine operators in open pit iron ore mines. Procedia Earth and Planetary Science, vol. 11. pp. 524-530. https://doi.org/10.1016/j.proeps.2015.06.054 [ Links ]
Darby, A.M., Heaton, R., and Mole, M. 2010. Whole-body vibration and ergonomics of driving occupations: Road haulage industry. Research report 766, Health and Safety Executive, Derbyshire. [ Links ]
Eger, T., Stevenson, J., Boileau, P-E'., Salmoni, A., and VibRG. 2008. Predictions of health risks associated with the operation of load-haul-dump mining vehicles: Part 1-Analysis of whole-body vibration exposure using ISO 2631-1 and ISO-2631-5 standards. International Journal of Industrial Ergonomics, vol. 38, no. 9-10. pp. 726-738. https://doi.org/10.1016/jj.ergon.2007.08.012 [ Links ]
Eger, Tl, Stevenson, J.M., Grenier, S., Böileaü, P-E', and Smets, M.P. 2011. Influence of vehicle size, haulage capacity and ride control on vibration exposure and predicted health risks for LHD vehicle operators. Journal of Low Frequency Noise, Vibration and Active Control, vol. 30, no. 1. pp. 45-62. https://doi.org/10.1260%2F0263-0923.30.1.45 [ Links ]
Eger, T. and Godwin, A. 2014. Whole-body vibration exposure: what you need to know to prevent vibration induced injuries. Proceedings of the Workplace Safety North Health of a Miner Symposium,, Sudbury, Canada, 12 November 2014. Workplace Safety North, Sudbury. [ Links ]
EU. 2002. European Parliament and Council Directive, 2002/44/EC on the introduction of measures to encourage improvements in thesafety and health of workers at work. European Commission. Brussels. [ Links ]
Frimpong, S., Galecki, G., and Chang, z. 2011. Dump truck operator vibration control in high-impact shovel loading operations. International Journal of Mining, Reclamation and Environment, vol. 25, no. 3. pp. 213-225. https://doi.org/10.1080/17480930.2011.595090 [ Links ]
George, D. and Mallery, M. 2010. SPSS for Windows Step by Step: A Simple Guide and Reference. Pearson, Boston. [ Links ]
Griffin, M.J. 1998. General hazards: vibration. Encyclopedia of Occupational Health and Safety. pp. 50.2-50.15. International Labour Organization Geneva. [ Links ]
ILO. 1977. Working Environment (Air Pollution, Noise and Vibration) Recommendation (No. 156). International Labour Organization. Geneva. [ Links ]
ISO. 1997. Mechanical vibration and shock - evaluation of human exposure to whole-body vibration, Part 1: General Requirements, ISO 2631-1. International Organization for Standardization. Geneva. [ Links ]
ISO. 2004. Mechanical vibration and shock - evaluation of human exposure to whole-body vibration, Part 5: Method for evaluation of vibration containing multiple shocks, ISO 2631-5. International Organization for Standardization. Geneva. [ Links ]
Kumar, S. 2001. Theories of musculoskeletal injury causation. Ergonomics, vol. 44, no. 1. pp. 17-47. https://doi.org/10.1080/00140130120716 [ Links ]
Kumar, S. 2004. Vibration in operating heavy haul trucks in overburden mining. Applied Ergonomics, vol. 35, no. 6. pp. 509-520. https://doi.org/10.1016/'.apergo.2004.06.009 [ Links ]
Lundström, R. and Holmlund, P. 1998. Absorption of energy during whole-body vibration exposure. Journal of Sound and Vibration, vol. 215, no. 4. pp. 789-799. https://doi.org/10.1006/jsvi.1998.1594 [ Links ]
Maeda, S. and Morioka, M. 1998. Measurement of whole-body vibration exposure from garbage trucks. Journal of Sound and Vibration, vol. 215, no. 4. pp. 959-964. https://doi.org/10.1006/jsvi.1998.1676 [ Links ]
Mandal, B.B., Chatterjee, D., Kulkarni, N.P., zade, P.D., Vanerkar, A.P., Narwadiya, S., and Thote, N.R. 2006. Whole-body vibration exposure of heavy earth moving machinery operators in Indian mines. Indian Mining and Engineering Journal, vol. 45, no. 9. pp. 29-31. [ Links ]
Mandal, B.B. and Srivastava, A.K. 2010. Musculoskeletal disorders in dumper operators exposed to whole body vibration at Indian mines. International Journal of Mining, Reclamation and Environment, vol. 24, no. 3. pp. 233-243. https://doi.org/10.1080/17480930903526227 [ Links ]
Mansfield, N.J., Newell, G.S., and Notini, I. 2009. Earth moving machine whole-body vibration and the contribution of sub-1hz components to ISO 2631-1 metrics. Industrial Health, vol. 47, no. 4. pp. 402-410. https://doi.org/10.2486/indhealth.47.402 [ Links ]
Mayton, A.G., Jobes, C.C., and Miller, R.E. 2008. Comparison of whole-body vibration exposures on older and newer haulage trucks at an aggregate stone quarry operation. Proceedings of the ASME 2008 International Design Engineering Technical Conferences & Computers and Information in Engineering Conference, New York City, USA, 3-6 August 2008. American Society of Mechanical Engineers, New York. pp. 685-691. [ Links ]
Mayton, A.G., Jobes, C.C., and Gallagher, S. 2014. Assessment of whole-body vibration exposures and influencing factors for quarry haul truck drivers and loader operators. International Journal of Heavy Vehicle Systems, vol. 21, no. 3. pp. 241-261. [ Links ]
Mayton, A.G., Porter, W.L., xueyan, S.x., Weston, E.B., and Rubenstein, E.N. 2018. Investigation of human body vibration exposures on haul trucks operating at U.S. surface mines/quarries relative to haul truck activity. International Journal of Industrial Ergonomics, vol. 64, pp. 188-198. https://doi.org/10.1016/j'.ergon.2017.05.007 [ Links ]
Miyashita, K., Morioka, I., Tanabe, T., Iwata, H., and Takeda, S. 1992. Symptoms of construction workers exposed to whole body vibration and local vibration. International Archives of Occupational and Environmental Health, vol. 64, no. 5. pp. 347-351. https://doi.org/10.1007/BF00379545 [ Links ]
Newell, G.S., Mansfield, N.J., and Notini, I. 2006. Inter-cycle variation in whole-body vibration exposures of operators driving track-type loader machines. Journal of Sound and Vibration, vol. 298, no. 3. pp. 563-579. https://doi.org/10.1016/j.jsv.2006.06.015 [ Links ]
Nishiyama, K., Taoda, K., and Kitahara, T. 1998. A decade of improvement in whole-body vibration and low back pain for freight container tractor drivers. Journal of Sound and Vibration, vol. 215, no. 4. pp. 635-642. https://doi.org/10.1006/jsvi.1998.1700 [ Links ]
Noorloos, D., Tersteeg, I., Tiemessen, I.J.H., Hulshof, C.T.J., and Frings-Dresen, M.H.W. 2008. Does body mass index increase the risk of low back pain in a population exposed to whole body vibration. Applied Ergonomics, vol. 39, no. 6. pp. 779-785. https://doi.org/10.1016/j.apergo.2007.11.002 [ Links ]
Okunribido, O.O., Magnusson, M., and Pope, M.H. 2006. Low back pain in drivers: The relative role of whole-body vibration, posture and manual materials handling. Journal of Sound and Vibration, vol. 298, no. 3. pp. 540-555. https://doi.org/10.1016/j.jsv.2006.06.007 [ Links ]
özkaya, N., Goldsheyder, D., and Willems, B. 1997. Effect of subway car design on vibration exposure. International Journal of Industrial Ergonomics, vol. 19, no. 5. pp. 377-385. https://doi.org/10.1016/S0169-8141(96)00016-9 [ Links ]
Palmer, K.T., Griffin M.J., Bendall, H., Pannett, B., and Coggon, D. 2000. Prevalence and pattern of occupational exposure to whole body vibration in Great Britain: findings from a national survey. Journal of Occupational and Environmental Medicine, vol. 57, no. 4. pp. 229-236. https://doi.org/10.1136/oem.57.4.229 [ Links ]
Seidel, H. and Heide, R. 1986. Long-term effects of whole-body vibration: a critical survey of the literature. International Archives of Occupational and Environmental Health, vol. 58, no. 1. pp. 1-26. https://doi.org/10.1007/bf00378536 [ Links ]
Sherwin, LM., Owende, P.M.O., Kanali, CL., Lyons, J., and Ward, S.M. 2004. Influence of tyre inflation pressure on whole-body vibrations transmitted to the operator in a cut-to-length timber harvester. Applied Ergonomics, vol. 35 no. 3. pp. 253-261. https://doi.org/10.1016/j.apergo.2004.02.002 [ Links ]
Smets, M.P.H., Eger, T.R., and Grenier, S.G. 2010. Whole-body vibration experienced by haulage truck operators in surface mining operations: A comparison of various analysis methods utilized in the prediction of health risks. Applied Ergonomics, vol. 41, no. 6. pp. 763-770. https://doi.org/10.1016/j.apergo.2010.01.002 [ Links ]
Svantek. 2013. SVAN 106 vibration meter user manual. SVANTEK Sp. z o.o., Warsaw, Poland. [ Links ]
Svantek. 2015. SvanPC++ user manual. SVANTEK Sp. z o.o., Warsaw, Poland. [ Links ]
Thalheimer, E. 1996. Practical approach to measurement and evaluation of exposure to whole-body vibration in the workplace. Seminars in Perinatology, vol. 20, no. 1. pp. 77-89. https://doi.org/10.1016/S0146-0005(96)80060-7 [ Links ]
TSE. 2011. TS EN 1032+A1 Mechanical vibration - Testing of mobile machinery in order to determine the vibration emission value. Turkish Standards Institution, Ankara. [ Links ]
Vanerkar, A.P., Kulkarni, N.P., zade, P.D., and Kamavisdar, A.S. 2008. Whole body vibration exposure in heavy earth moving machinery operators of metalliferous mines. Environmental Monitoring and Assessment, vol. 143, no. 1-3. pp. 239-245. https://doi.org/10.1007/s10661-007-9972-z [ Links ]
Village, J., Morrison, J.B., and Leong, D.K.N. 1989. Whole-body vibration in underground load-haul-dump vehicles. Ergonomics, vol. 32, no. 10. pp. 1167-1183. https://doi.org/10.1080/00140138908966888 [ Links ]
Waters, T., Genaidy, A., Viruet, H.B., and Makola, M. 2008. The impact of operating heavy equipment vehicles on lower back disorders. Ergonomics, vol. 51, no. 5. pp. 602-636. https://doi.org/10.1080/00140130701779197 [ Links ]
 Correspondence:
B. Erdem
Email: bulent@cumhuriyet.edu.tr
Received: 1 Mar. 2020
Revised: 7 Sep. 2020
Accepted: 8 Sep. 2020
Published: September 2020

