


Services on Demand
Article
 English (pdf)
 Article in xml format
 Article references
Indicators

Related links
-
 Cited by Google
 -
 Similars in Google
Share

 Permalink
Journal of the Southern African Institute of Mining and Metallurgy
On-line version ISSN 2411-9717
Print version ISSN 2225-6253
J. S. Afr. Inst. Min. Metall. vol.120 n.9 Johannesburg Sep. 2020
http://dx.doi.org/10.17159/2411-9717/527/2020
PAPERS OF GENERAL INTEREST
The application of coal discards for acid mine drainage neutralization
S. MxinwaI; E.D. DeenanathI; S.W. RobertsonI; S. NdlovuII; P. BassonI
IProcess Design Group, Biotechnology Division, Mintek, Randburg, South Africa
IISchool of Chemical and Metallurgical Engineering, University of the Witwatersrand, Johannesburg, South Africa
SYNOPSIS
The neutralization of acid mine drainage (AMD) with coal discards in percolating columns was investigated as a potential precursor to lime neutralization. The neutralizing capacity of three coal samples, A (70% ash), B (25.3% ash), and C (28.9% ash, estimated), sourced from three South African coal mines, was determined at different crush sizes (-40 mm, -12.5 mm and -6.3 mm). AMD solution obtained from another local coal mine was percolated over the coal samples packed in 1 m and 6 m columns, until the pH of the accumulated drainage solution measured approximately pH 7. Samples B and C, with an alkalinity content equivalent to 2.3% CaCO3, achieved neutralizing capacities of 2112 L AMD and 929 L AMD per ton coal respectively, at a -6.3 mm crush size. Sample A, with an alkalinity content equivalent to 0.48% CaCO3, neutralized only 282 L AMD per ton coal at the same crush size.
An economic analysis was performed to compare neutralization with waste coal against lime neutralization in tanks. The analysis was based on a rate of AMD generation of 1750 m3/d, a neutralizing capacity of 1.4 m3 AMD per ton coal, with capital costs estimated at R18 million for lime neutralization and R27.6 million for coal neutralization. Operating costs were estimated at R24 million for lime neutralization and R9 million for coal neutralization. AMD neutralization with suitable waste coal may therefore be less expensive than neutralization with lime.
Keywords: acid mine drainage, neutralization, waste coal.
Introduction
Globally, approximately 6.9 billion tons of coal is extracted annually and used for electricity generation, steel manufacture, cement manufacture, and conversion to liquid fuel (World Coal Association, 2017). Waste coal stockpiles are a source of air and surface pollution, generating dust emissions and acid mine drainage (AMD), which may release heavy metals and toxic elements into the environment. From a South African perspective, the production of coal wastes currently stands at approximately 6 Mt/a (Cornish, 2016). In addition, approximately 50-62 ML/d of AMD is decanted from active and obsolete coal mines in the Mpumalanga Province alone (Hobbs, Oelofse, and Rascher, 2008).
The use of lime for the treatment of acidic mine water was implemented during the 1980s and is the method of choice to date (Mey and van Niekerk, 2009). However, with the cost of lime increasing annually and the liming process producing a low-density sludge that is difficult to filter (Mey and van Niekerk, 2009; Department of Mineral Resources, 2010), it is necessary to search for alternative low-cost options for AMD treatment. Acid-consuming minerals in waste coal could potentially be utilized to counteract sulphuric acid (H2SO4) generation, e.g. from the oxidation of pyrite (FeS2) if present in the coal. Examples of acid-consuming minerals include carbonates, such as calcite (CaCO3) and dolomite (CaMg(CO3)2); and also clay minerals such as kaolinite (Al2Si2O5(OH)4) and other phyllosilicates. The neutralization of AMD with alkaline-rich waste coal is therefore being investigated as an alternative low-cost process route that may be implemented to complement, or even substitute for, lime neutralization (Perry and Brady, 1995; Watten, Sibrell, and Schwartz, 2005; Fu and Wang, 2011).
Test work was performed to determine the neutralizing capacity of coal samples obtained from three South African mines: sample A (from a mine in Limpopo), sample B (from a mine in Mpumalanga), and sample C (from another mine in Mpumalanga). The coal samples were loaded into 1 m and 6 m columns, and irrigated with AMD solution (pH 2.5-2.8). The neutralizing capacity was quantified as the volume of solution that can be neutralized to approximately pH 7 per ton of coal, and was also expressed as an equivalent lime consumption in kilograms of Ca(OH)2 per ton coal.
An economic analysis was also performed to compare the costs of AMD neutralization with waste coal and the traditional lime neutralization route. Three proposed flow sheets were developed:
> Partial neutralization of AMD over waste coal heaps with only 75% of the neutralization requirement provided by coal (i.e. the ratio of AMD to coal was 1.9 m3 per ton instead of 1.4 m3 per ton), followed by neutralization with lime in stirred tanks to pH 7.
> Neutralization with lime only to pH 7.
> Neutralization with waste coal only to pH 7.
Design criteria, reagent consumptions, and reagent costs based on experimental and published data were used to calculate capital and operating costs for each process option.
Experimental
Sample preparation and analysis
Sample A was obtained from a coal mine in Limpopo. Approximately 1 ton of sample was transferred from a discard stockpile into bulk bags by front-end loader, and transported to Mintek. Sample B originated from a coal mine in Mpumalanga. The sample was already on-site at Mintek, and constituted material remaining from a prior sorting programme. Approximately 1 ton of sample C was sourced, in the same fashion as for sample A, from another coal mine in Mpumalanga.
Samples A, B, and C were blended separately and split into three batches each. The individual batches were then stagewise crushed (to reduce excessive fines generation) in a laboratory jaw crusher with screening between stages to -40 mm, -12.5 mm, and -6.3 mm. Only the -6.3 mm material from sample C was used in this study since the -40 mm and -12.5 mm material had been used in an earlier programme. Representative sub-samples were split out in 25 kg charges for chemical analysis and column neutralization test work. The particle size distributions (PSDs) were determined by dry screening at the following screen sizes: 40 mm, 19 mm, 12.5 mm, 9.5 mm, 6.3 mm, 3.35 mm, 1.18 mm, 500 µm, and 150 µm.
Splits of the representative sub-samples were pulverized and analysed by inductively coupled plasma-optical emission spectroscopy (ICP-OES) for: Al, Ca, Cu, Co, Cr, Fe, Mg, Mn, Ni, Pb, Si, Ti, V, and Zn. Sulphide sulphur (S2-) was analysed on a LECO instrument after pre-leaching with trichloroethylene to remove the other sulphur species. K and Na were analysed by atomic absorption spectroscopy (AAS). Alkalinity, expressed as calcium carbonate (CaCO3) equivalent, was analysed by an acid-base accounting (ABA) method (Lawrence and Wang, 1997).
In addition, the moisture content was determined from the mass loss upon heating for 2 hours in an oven at 110°C. The content of volatile material was determined from the mass loss upon ignition in a muffle furnace at 900°C for 7 minutes in the absence of air. The ash content was determined by ignition in air in a muffle furnace at 820°C for 90 minutes. The fixed carbon content was calculated by difference; in other words, by subtraction of the sum of the ash, moisture, and volatiles mass percentages from the total (100%).
The AMD and accumulated drainage solutions were analysed for: Al, As, Ca, Cd, Co, Cr, Cu, Fe, Li, Mg, Mn, Mo, Ni, Pb, S, Si, Ti, V, and Zn (ICP-OES), as well as for K and Na (AAS).
Column neutralization test work
Tests were conducted in 1 m and 6 m, water-jacketed polypropylene columns (160 mm ID) connected to a chiller or geyser for temperature control. The columns were irrigated from the top through a single dripper point from a tight-fitting 3 mm, plastic tube inserted through a hole in the centre of a flanged lid. The irrigated solution drained down through the packed coal bed by gravity (with lateral flow by conduction), and was collected at the column base through an enclosed perforated plate, with a drainage hole (fitted with a 'pigtailed' tube), for daily collection of drained solution.
A schematic representation of the experimental set-up for the neutralization test work is shown in Figure 1a. The facilities for the test work are shown in Figure 1b.


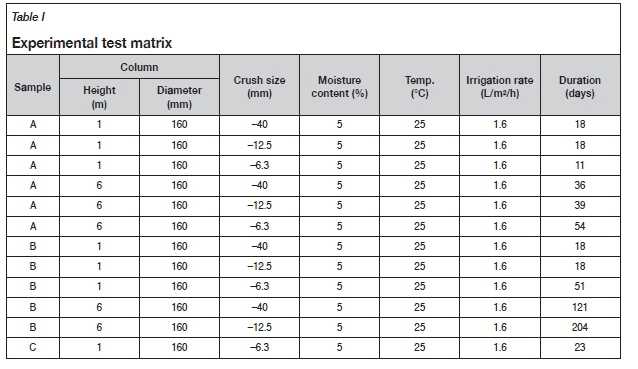
The experimental matrix is summarized in Table I.
The coal samples were agglomerated in a rotating drum mixer (for the 6 m columns) or on a plastic sheet (for the 1 m columns), with 5% agglomeration moisture (AMD) added. Agglomeration is a technique used to bind fines to coarse particles. This allows for even permeability of solution through the packed bed. The columns were then charged with the wet agglomerates and percolated with AMD solution by means of Watson Marlow 120 S peristaltic pumps (Figure 1a). The AMD solution was placed in 50 L feed tanks and daily measurements of mass, volume, specific gravity (SG), redox potential (vs. Ag/AgCl; 3 M KCl), pH, and temperature were taken. The daily drainage solutions were collected from the base of the columns (Figure 1a) and the following parameters were measured: mass, volume, SG, redox potential, pH, and temperature. The daily drainage solutions were then accumulated in plastic tanks and the pH of the accumulated solutions measured on a daily basis. Once the daily drainage pH levels dropped below pH 6, irrigation was stopped and the columns were allowed to drain. The final accumulated drainage solutions were analysed by ICP-OES and AAS.
Results and discussion
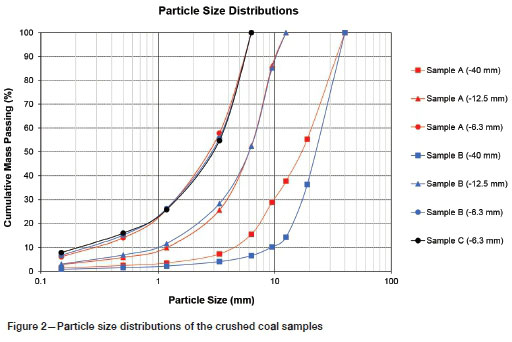
Particle size distribution
The particle size distributions of the three coal samples are presented in Figure 2. The fines (-1 mm) content increased from less than 5% in the coarser crush size (-40 mm) to above 20% in the finer (-6.3 mm) crush size. As the exposed surface area required for chemical reaction increases with increasing fines content, it was expected that the finer crush sizes would have improved neutralizing capacity. In all cases, a fines content of less than 10% passing 150 urn was achieved, which is below the maximum limit of 10% to 14% passing 150 µm typically reported to prevent permeability restraints in percolation leaching (Scheffel, 2017).
Chemical analysis
The chemical analyses of the AMD solution and samples A, B, and C are presented in Table II.
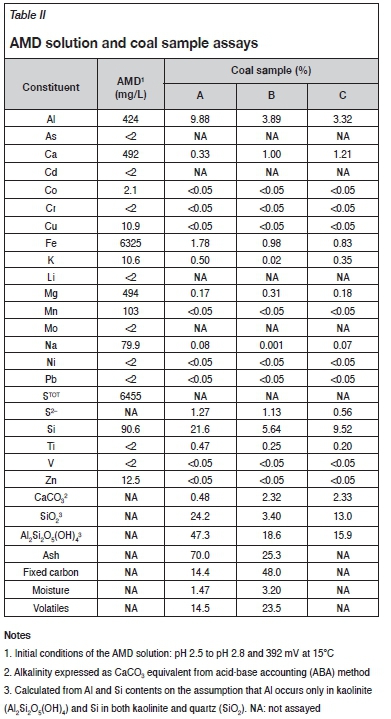
The coal samples contained high contents of Al (3.3% to 9.9%) and Si (5.6% to 21.6%), which are common characteristics for coal wastes (Modarres and Ayar, 2014; Vegas et al., 2015). Sample A contained 70% ash and sample B contained 25.3% ash as determined by combustion method. Semi-quantitative X-ray diffraction (XRD) performed on samples A and B indicated kaolinite (Al2Si2O5(OH)4) and quartz (SiO2) to be the predominant Al- and Si-containing minerals. On the assumption that Al occurs only in kaolinite and Si in both kaolinite and quartz, the combined contents for these two minerals can be calculated as 71.5% (sample A), 22% (sample B), and 28.9% (sample C), with the former two estimations in reasonable agreement with the corresponding ash contents determined by combustion. The ash content in South African coal discards is typically greater than 40% (Lloyd, 2000; Coal Resources, 2001; North, Engelbrecht, and Oboirien, 2015). Sample A can therefore be classified as waste coal. Samples B and C had ash contents of less than 30% and can therefore be classified as power station coal (Cornish, 2016).
Samples B and C had a higher degree of alkalinity expressed as CaCO3 (2.3%) compared with sample A (0.48%), which suggests that these two samples should show greater neutralizing capacities.
The AMD solution contained elevated concentrations of Fe (6.3 g/L) and (sulphate) sulphur (6.4 g/L), which is in agreement with AMD characteristics (Johnson and Hallberg, 2005).
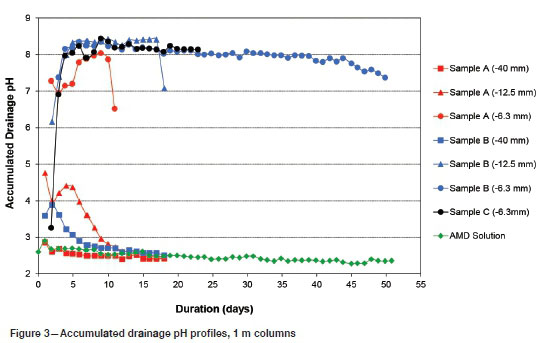
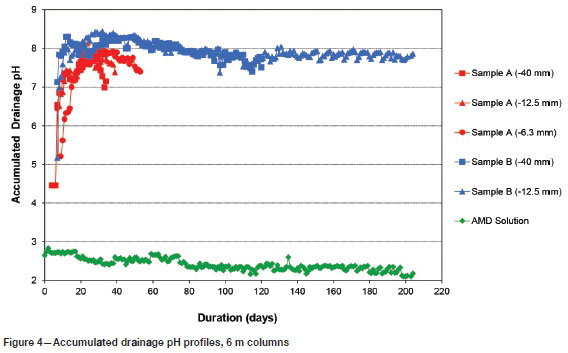
Column neutralization test work
The accumulated drainage pH profiles of the 1 m columns are presented in Figure 3. Sample A at the coarser crush sizes (-40 mm and -12.5 mm) did not achieve a drainage pH above 7, whereas the -6.3 mm crush size achieved a drainage pH above 7 for 11 days. Sample B at the coarse (-40 mm) crush size never achieved a drainage pH above 7, whereas the finer crush sizes achieved a drainage pH above 7 for 18 days and 51 days for the -12.5 mm and -6.3 mm crush sizes, respectively. Sample C (-6.3 mm) maintained a pH above 7 for 23 days.
The accumulated drainage pH profiles of the 6 m columns are presented in Figure 4. The columns containing sample A maintained an accumulated drainage pH above 7 for 36 days (-40 mm), 39 days (-12.5 mm), and 54 days (-6.3 mm), respectively. The test on sample B -40 mm crush size showed an accumulated drainage pH above 7 for 121 days, whereas the -12.5 mm crush size test continued to maintain an accumulated drainage pH above 7 for 204 days.
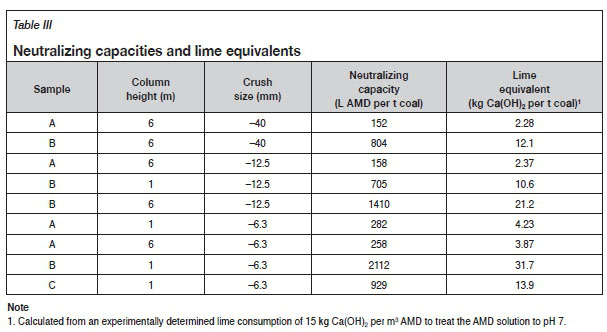
The neutralizing capacities are summarized in Table III. Sample A neutralized more than 150 L AMD per ton coal at the coarser crush sizes (-40 mm and -12.5 mm) in the 6 m columns, and 258 L AMD per ton coal (6 m columns) to 282 L AMD per ton coal (1 m columns) at the finer crush size (-6.3 mm). For sample B, the capacity increased from 804 L AMD per ton coal at the -40 mm crush size (6 m columns) to 1410 L AMD per ton coal at the -12.5 mm crush size (6 m columns), and as high as 2112 L AMD per ton coal at the -6.3 mm crush size (1 m columns). Lime equivalents ranged from 2.28 kg Ca(OH)2 to 31.7 kg Ca(OH)2 per ton coal.
In general, decreased crush size resulted in an increase in neutralizing capacity (see samples A and B). Also, as expected from the alkalinities, the capacities for samples B and C (2.3% CaCO3) are markedly higher than for sample A (0.48% CaCO3). For example, at 1 m and -6.3 mm crush size the capacities are 282 L AMD per ton coal (sample A) versus 2112 L AMD per ton coal (sample B) and 929 L AMD per ton coal (sample C). However, it is interesting to note that despite the same alkalinity of 2.3% CaCO3 (determined on pulverized material) and PSDs (Figure 2), sample B achieved a higher neutralizing capacity than sample C. This may be the result of sample C's alkalinity being weighted to the finer material. Another possibility is that sample B may be more penetrable to the percolating solution than sample C
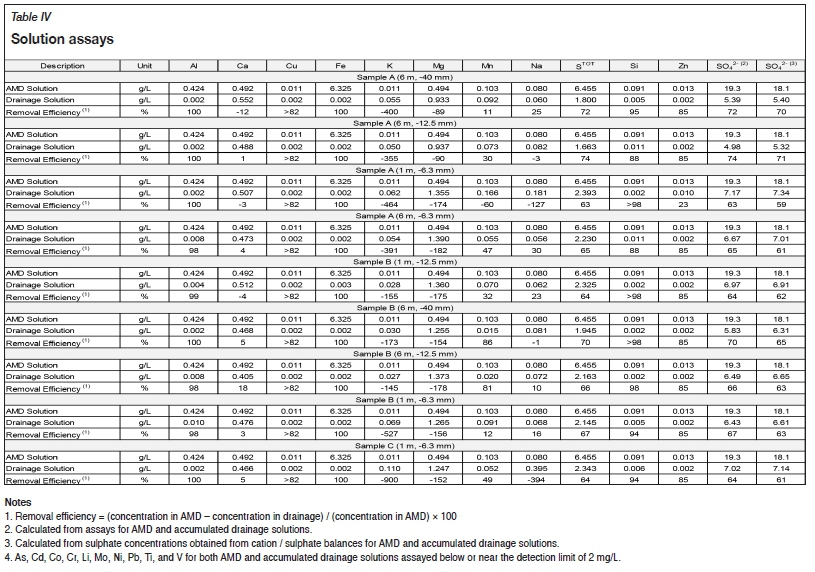
The chemical assays of the AMD and accumulated drainage solutions are presented in Table IV. The sulphate values were calculated from the total sulphur ICP-OES assays. The solution assays indicate high removal efficiencies of Al, Cu, Fe, Si, and Zn, whereas K and Mg, on the other hand, increase in the accumulated solutions due to the leaching of acid-consuming minerals. The Na concentration of the drainage solution for sample C also increased. The results show total sulphate removals of between 63% and 74% based on ICP-OES assays. These values are in agreement with those calculated from sulphate concentrations obtained for cation / sulphate balances for the AMD and accumulated drainage solutions.
Figure 5 shows the AMD solution percolated through the column and the neutralized drainage solution after contact with the coal. The red-coloured AMD solution is dominated by iron, whereas the drainage solution is clear due to iron removal. This is supported by the solution assays data, which indicates an iron removal efficiency of 100% (Table IV).
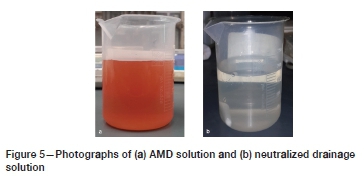
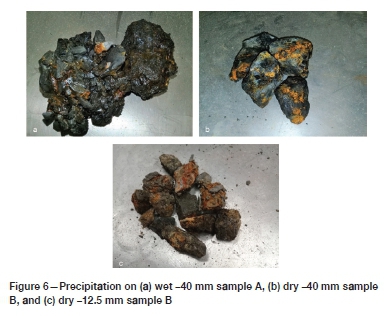
Figure 6 presents photographs of offloaded coal particles with yellow/orange and reddish brown precipitation visible on parts of their surfaces. This suggests that species that were removed from the AMD solution can deport to the coal surface as precipitation products.
The AMD solution contained 6.325 g/L Fe at pH 2.5 to 2.8, 392 mV (vs. Ag/AgCl; 3 M KCl) and 15°C. Using an appropriate formal potential (EΦ) of 0.678 V (vs. SHE), the Fe(III) and Fe(II) concentrations can be estimated as 0.332 g/L and 5.993 g/L respectively from the following equations:
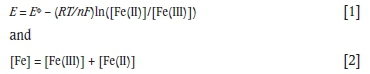
where
E Solution potential (V vs. SHE)
EΦ Formal potential for the Fe(III)/Fe(II) redox couple (V
vs. SHE)
F Faraday's constant (96 487 C/mol)
Fe Total iron concentration (mol/L)
Fe(III) Ferric concentration (mol/L)
Fe(II) Ferrous concentration (mol/L)
n Number of electrons (mol)
R Universal gas constant (8.314 J/mol/K)
T Temperature (K)
Acid in the AMD solution reacts with acid-consuming minerals present in the coal when the solution percolates through the coal bed. This causes a decrease in the acidity of the solution as reflected by the increasing solution pH; most notably for samples A (-6.3 mm), B (-12.5 mm and -6.3 mm), and C (-6.3 mm) for the 1 m columns (Figure 3), and samples A and B for the 6 m columns (Figure 4). The alkalinity provided by the coal could be due to the presence of acid-consuming minerals that include carbonates such as calcite and dolomite; and also clay minerals such as kaolinite and other phyllosilicates. For example, in the case of calcite:

As the solution pH increases above pH 4 it is expected that Fe(III) and Al(III) would precipitate from solution as metal hydroxides. By way of example, in the case of Fe(III):

However, it should be noted that depending on pH and solution composition, a variety of iron(III) precipitates are possible such as jarosite (H3O, K, Na, NH4)Fe3(OH)6(SO4)2, haematite (a-Fe2O3), schwertmannite (Fe8O8(OH)6(SO4)), goethite (a-FeOOH), and ferrihydrite (Fe5(OH)8-4H2O); and in the case of aluminium(III) precipitates, jurbanite (Al(SO4)OH), alunite (KAl3(SO4)2(OH)6) and gibbsite (Al(OH)3) (Petrik, 2004). The above precipitation reactions generate acid, which can be consumed again by acid-consuming minerals present in the coal.
The AMD solution's Fe(III) concentration forms a much smaller part of the total iron concentration (about 5%) than the Fe(II) concentration (about 95%). However, it has been shown that Fe(II) can be removed by oxidative precipitation where Fe(II) is oxidized by dissolved oxygen to Fe(III). For example, Stumm and Lee (1961) studied the kinetics of the reaction in bicarbonate (HCO3-) solutions over the range pH 6 to pH 7.5, and found that their experimental measurements were in agreement with the stoichiometric relationship:

They found that the rate of Fe(II) to Fe(III) oxidation was first order in Fe(II) concentration, first order in dissolved oxygen concentration, and second order in hydroxyl (OH-) concentration, with the rate of the reaction increasing 100-fold for an increase in one pH unit.
The reaction presented in Equation [5] may well have been responsible for the effective removal of Fe(II) from the AMD solution in the columns where the drainage solution pH increased to as high as pH 8 to pH 8.4. These results are consistent with the hydroxide precipitation diagram by Monhemius (1977), which shows that Fe(II) will precipitate over the range pH 6.3 to pH 8.5.
The 1 m and 6 m columns were not aerated during operation. This would mean that if the reaction in Equation [5] was responsible for Fe(II) removal, the oxygen supply from dissolved oxygen in the irrigating AMD solution and from air in the voidage of the packed coal bed was sufficient to sustain the reaction. Ambient air ingress into the coal bed was unlikely since the 'pigtailed' drainage tube always contained some solution, as well as the bottom of the bed and column base, thus forming a natural seal.
Economic analysis
An economic analysis was performed to compare the cost of neutralizing AMD with waste coal (in heaps) versus lime (in agitated vessels).
The stacking methodology for the coal heaps comprises an on-off pad, whereby a permanent pad is constructed and the ore is stacked (using either trucks or a mechanical stacker) in a single 6 m lift. AMD is pumped over the heaps and dripper or sprinkler irrigation is used. Solution draining from the base of the heaps is collected in drainage pipes and solution ponds. Spent coal is removed with a front-end loader. The lime neutralization plant consists of a series of agitated tanks with overhead motors, a clarifier, and auxiliaries such as feed pumps and holding tanks.
The capital cost includes ground preparation, construction of a permanent pad of sufficient area to allow the stacking, equipping, percolation, and drainage, and de-equipping and removal operations. Adequate sustaining capital or alternative operating cost provision must be allowed for replacement of the gradually depleted drainage layer and blocked or damaged drainage piping. The operating costs include labour, pumping power, reagents, and maintenance materials.
Economic analysis methodology
The economic analysis employs a method of factoring costs from best available benchmark data, by the following sequence of steps.
> Basic production criteria are specified (e.g. rate of AMD generation, coal neutralizing capacity, coal bulk density, heap stacking height, lime tank residence time, number of tanks, and lime neutralizing capacity).
> Mass balance data is calculated (e.g. coal stacking rate, solution application rate, mass under percolation, area under percolation, pond volumes, tank volumes, pump sizes, and lime addition rates).
> Direct capital costs are calculated based on the mass balance and selected multipliers. Appropriate benchmark factors are selected for the calculation of the heap capital costs (e.g. cost per m2 of pad area constructed, cost per m3 of pond volume excavated, and cost per m2 of plastic liner).
> Uninstalled costs of capital items such as tanks and pumps are calculated from the Mintek equipment cost database (Ruhmer, 1996). Installed capital costs are calculated from the uninstalled capital costs by multiplying with an appropriate factor, e.g. civils, piping, instrumentation, and electrical costs.
> Indirect capital costs such as engineering, procurement, and construction management (EPCM), owner's cost, etc. are calculated from the total installed capital cost by multiplying with an appropriate factor.
> Reagent consumptions are specified from experimental and published data. Reagent costs from published journals are used.
> Total operating costs are calculated taking into account labour, power, reagents, and maintenance.
Economic analysis data
The economic analysis was used to compare the costs of three proposed flow sheet options, as illustrated in Figure 7:
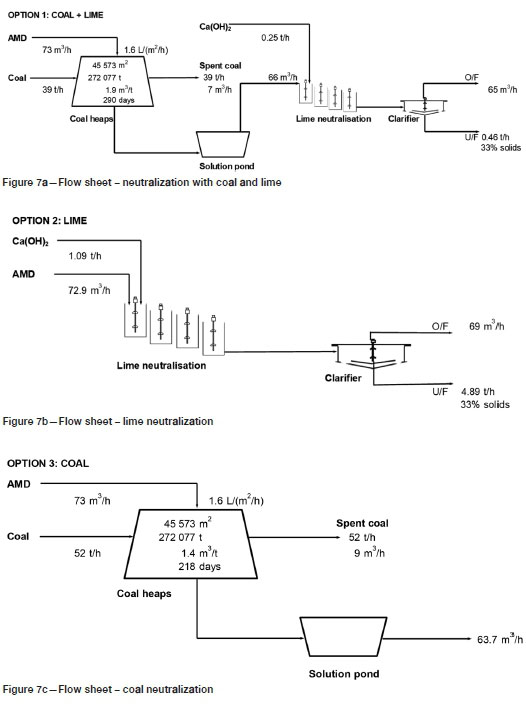
• Option 1: partial neutralization with coal followed by lime
• Option 2: neutralization with lime only
• Option 3: neutralization with coal only.
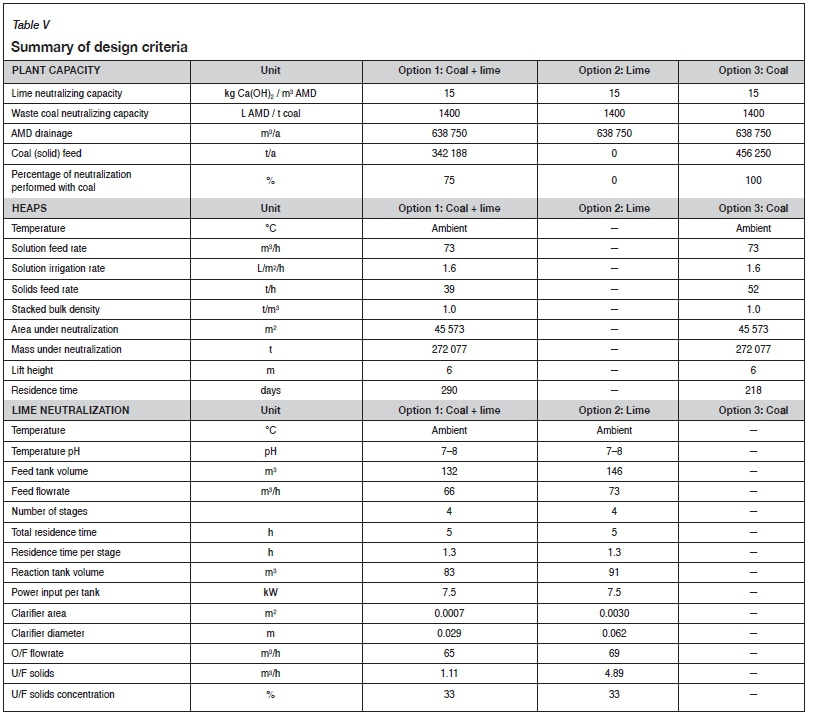
Table V provides a summary of the design criteria from the three flow sheet options. The analysis is based on a rate of AMD generation of 1750 m3/d (Maree et al., 2013). A neutralizing capacity of 1.4 m3 AMD per ton coal, a solids bulk density of 1 t/m3, and a heap height of 6 m were specified from the experimental results from the neutralization test for sample B (6 m column; -12.5 mm; Table III). A lime cost of R2000 per ton and a lime neutralizing capacity of 15 kg Ca(OH)2 per m3 AMD were used (Table III).
A summary of the capital costs is provided in Figure 8, and a summary of operating costs in Figure 9. Amortized capital is included in the operating costs, based on a 10% annual interest and a 10-year payback period. A South African electricity cost of 86 cents per kWh was used (Deloitte, 2017). Costs of crushing and coal transportation are not included in the calculation of capital and operating costs. The analysis also does not include costs of a tailings facility for storage of the lime slurry.
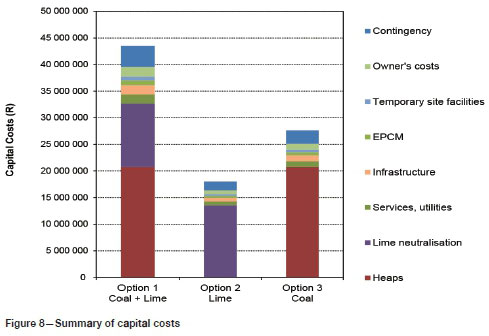
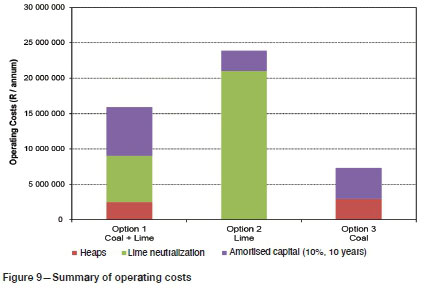
Capital cost for lime neutralization was estimated at R18 million versus R27.6 million for coal neutralization, and R44 million for partial coal and partial lime neutralization (Figure 8). Operating costs (including amortized capital) were approximately R24 million for lime neutralization, followed by R17.4 million for coal and lime neutralization, and R9 million for coal neutralization (Figure 9).
Conclusions
> The concept of acid mine drainage treatment by means of percolation (or trickle) neutralization, through a packed bed of coal discards has been demonstrated in 1 m and 6 m high columns.
> Two of the three coal samples tested, viz. samples B and C, were more effective as neutralizing agents and may contribute to lime savings, as these showed significantly higher neutralizing capacities than sample A (<300 L AMD per ton coal). It is anticipated that samples with too low capacities would require to be used in excessive amounts, with accompanied costs. Therefore, the neutralizing capacity at which a waste coal sample would be deemed suitable needs to be determined by an overall economic assessment.
> Samples B and C, which yielded higher neutralizing capacities, also contained higher levels of alkalinity (expressed as CaCO3 equivalent), i.e. 2.3% CaCO3 compared with 0.48% CaCO3 for sample A. However, Sample C only achieved 44% of sample B's neutralizing capacity at -6.3 mm crush size and virtually the same particle size distribution. The reason for this is unknown, but it is possible that the minerals responsible for neutralization in sample B were more liberated, and hence more exposed to the percolating solution. Quantitative, size class modal analyses from a mineralogical investigation, on both head and residues for these two samples, could shed more light on this.
> Neutralizing capacities increased with decreasing crush size, with sample B achieving capacities of between 804 L AMD per ton coal and 2112 L AMD per ton coal at -40 mm and -6.3 mm, respectively. Sample C neutralized 929 L AMD per ton coal at -6.3 mm crush size.
> High removal efficiencies for Al, Cu, Fe, Si, and Zn were achieved, with total sulphate removals of between 63% and 74%.
> Offloaded coal particles showed yellow/orange and reddish brown precipitation on parts of their surfaces. This suggests that species that were removed from the AMD solution deport to the coal surface as precipitation products.
> Capital costs were estimated at R18 million for lime neutralization, R27.6 million for coal neutralization, and R44 million for partial coal and partial lime neutralization. Operating costs (including amortized capital at 10% over 10 years) were estimated at R24 million for lime neutralization, followed by R17.4 million for coal and lime neutralization and R9 million for coal neutralization. Costs do not include crushing and transport of coal or tailings treatment of lime slurry. Hence it may be concluded that the coal neutralization route may constitute a lower cost alternative to lime neutralization provided suitable discard coal is freely available at the site and no additional capital for crushing is required.
Acknowledgements
The authors kindly acknowledge Mintek for research project funding the Department of Science and Technology - National Research Foundation (PDP) for financial support to the second author, and Mintek's Biotechnology division operators for technical assistance.
ORCiD ID:
E.D. Deenanath: https://orchid.org/0000-0002-3038-0126
References
Coal Resources. 2001. National inventory discard and duff coal - summary report. 31 pp. https://www.energy.gov.za [accessed 29 November 2019]. [ Links ]
Cornish, I. 2016. Coal waste material. An untapped power generation solution. Mining Review Africa. pp. 50-53. [ Links ]
Deloitte Consulting Pty (Ltd). 2017. An overview of electricity consumption and pricing in South Africa. Report for Eskom Holdings SOC Ltd. 86 pp. [ Links ]
Department of Mineral Resources. 2010. Lime Industry in South Africa. Report R85/2010. 28 pp. [ Links ]
Fu, F. and Wang, Q. 2011. Removal of heavy metal ions from wastewaters: A review. Journal of Environmental Management, vol. 92. pp. 407-418. [ Links ]
Hobbs, p., Oelofse, S.H.H., and Rascher, J. 2008. Management of environmental impacts from coal mines in the Upper Olifants River Catchment as a function of age and scale. International Journal of Water Resources Development, vol. 24, no. 3. pp. 417-431. [ Links ]
Johnson, D.B. and Hallberg, K.B. 2005. Acid mine drainage remediation options. A review. Science of the Total Environment, vol. 338. pp. 3-14. [ Links ]
Lawrence, R.W. and Wang, Y. 1997. Determination of neutralising potential in the prediction of acid rock drainage. Proceedings of the Fourth International Conference on Acid Rock Drainage, Vancouver, BC, Canada, 31 May-6 June. Mine Environment Neutral Drainage (MEND) Program pp. 449-464. [ Links ]
Lloyd, P.J. 2000. The potential of coal wastes in South Africa. Journal of the South African Institute of Mining and Metallurgy, vol. 100. pp. 69-72. [ Links ]
Maree, J.P., Mujuru, M., Bologo, v., Daniels, N., and Mpholoane, D. 2013. Neutralisation treatment of AMD at affordable cost. Water SA, vol. 39, no. 2. pp. 245-250. [ Links ]
Mey, W.S. and van Niekerk, A.M. 2009. Evolution of mine water management in the Highveld coalfields. Proceedings of the International Mine Water Conference, Pretoria, South Africa, 19-23 October 2009. International Mine Water Association. [ Links ]
Modarres, A. and Ayar, P. 2014. Coal waste application in recycled asphalt mixtures with bitumen emulsion. Journal of Cleaner Production, vol. 83. pp. 264-272. [ Links ]
Monhemius, A.J. 1977. Precipitation diagrams for metal hydroxides, sulphides, arsenates and phosphates. Transactions of the Institution of Mining and Metallurgy Section C - Mineral Processing and Extractive Metallurgy, vol. 86. pp. C202-C206. [ Links ]
North, B., Engelbrecht, A., and Oboirien, B. 2015. Feasibility study of electricity generation from discard coal. Journal of the Southern African Institute of Mining and Metallurgy, vol. 115. pp. 573-880. [ Links ]
Perry, E.F. and Brady, K.B. 1995. Influence of neutralization potential on surface mine drainage quality in Pennsylvania. Proceedings of the West Virginia Surface Mine Drainage Task Force Symposium, Morgantown, West Virginia, USA, 4-5 April 1995. West Virginia University. [ Links ]
Petrik, I. 2004. Environmental impact of the placing of coal residue, fine coal residue and ash in mined out areas. Coaltech 2020 report. Johannesburg. 130 pp. [ Links ]
Ruhmer, W.T. 1996. Handbook on the Estimation of Metallurgical Process Costs, 2nd edn. Mintek, Randburg, South Africa. [ Links ]
Scheffel, R. 2017. Metallurgical Consultant, USA. Personal communication. [ Links ]
Stumm, W. and Lee, G.F. 1961. Oxygenation of ferrous iron. Industrial and Engineering Chemistry, vol. 53, no. 2. pp. 144-146. [ Links ]
Vegas, I., Cano, M., Arribas, I., Frias, M., and Rodrigues, O. 2015. Physical-mechanical behaviour of binary cements blended with thermally activated coal mining waste. Construction and Building Materials, vol. 99. pp. 169-174. [ Links ]
Watten, B.J., Sibrell, P.L., and Schwartz, M.F. 2005. Acid neutralization within limestone sand reactors receiving coal mine drainage. Environmental Pollution, vol. 137. pp. 295-304. [ Links ]
World Coal Association. www.worldcoal.org [accessed: 14 October 2017]. [ Links ]
 Correspondence:
P. Basson
Email: petrusb@mintek.co.za
Received: 10 Dec. 2018
Revised: 24 Aug. 2020
Accepted: 7 Sep. 2020
Published: September 2020

