


Services on Demand
Article
 English (pdf)
 Article in xml format
 Article references
Indicators

Related links
-
 Cited by Google
 -
 Similars in Google
Share

 Permalink
Journal of the Southern African Institute of Mining and Metallurgy
On-line version ISSN 2411-9717
Print version ISSN 2225-6253
J. S. Afr. Inst. Min. Metall. vol.120 n.9 Johannesburg Sep. 2020
http://dx.doi.org/10.17159/2411-9717/978/2020
PAPERS OF GENERAL INTEREST
Measurement of air and ground vibrations produced by explosions situated on the Earth's surface
M. GrobbelaarI; T. MoleaI; R. DurrheimII
ICouncil for Geoscience Engineering and Geohazards Unit, South Africa
IIUniversity of the Witwatersrand, Johannesburg, Souh Africa
SYNOPSIS
Most equations used to predict the ground motion produced by explosions were developed using confined blasts that were detonated for breaking rock in mining or tunnelling. Ground motion is usually recorded by geophones or seismometers. The air blast produced by open-pit blasts and explosions on the surface can pose a significant risk, thus microphones and pressure gauges are often also used to monitor the effects of the explosion. The aim of this study is to determine whether the predictive equations developed for confined explosions can be used to predict the effects from explosions on the surface, with appropriate adjustments to the various coefficients.
Three predictive equations developed for buried explosions were tested. The study shows that the US Bureau of Mines peak particle velocity (PPV) predictive equation is the most reliable. In addition, a predictive equation that uses the secondary atmospheric shock wave phenomenon also produced good results, and uses the scaled delay time parameter, which is easier to measure. These equations may be utilized for demolition sites, where old and potentially unstable explosives and obsolete equipment are destroyed on the surface, and for assisting in forensic seismology to determine the details of an unexpected and unknown explosion.
Keywords: surface explosions, prediction, demolition, PPV, secondary shock wave.
Introduction
Military demolition sites are areas where old and potentially unstable explosives and obsolete equipment are destroyed. Typically, the ordnance is placed on the ground surface and detonated. Ideally, the area should be located far from any human activity or dwellings, and is cleared prior to use. However, some demolition sites have been encroached upon by human settlements. Consequently, modelling and monitoring of the ground vibrations and air blasts have become a priority to ensure that the blasts do not cause irritating disturbances to the local inhabitants or damage to structures, which may result in protests and legal challenges. Equations that could be utilized to predict the effects of the demolition activities on the surrounding population and structures would be useful in mitigating these risks.
Using a 'mixed' content of explosives on the surface in order to determine whether predictive equations can be utilized would not only assist with determining the effects of explosions from a military demolition range on the surrounding infrastructure, but can also assist with forensic investigations of unexpected explosions. Instrumental tests with surface explosions ranging up to 25 t have not been conducted or reported in South Africa, and thus this study aims to provide insight into this novel aspect.
The main features of the study are:
> Vibration measurements of large surface explosions (up to 25 t)
> Applicability of the USBM PPV equation to long distances (29 km), which is far beyond the usual measuring range for blasting vibrations
> Measurement of the delay between the main and secondary air shocks at equally long distances
> Possible relevance of the vibration analysis to truck bomb explosions and to forensic analysis of large unplanned explosions.
Blast monitoring
Blasts or explosions on the Earth's surface, such as at demolition ranges, create seismic waves that travel through the ground and overpressure (air pressure waves) through the atmosphere, both of which can shake buildings and disturb people. Together, these phenomena are referred to as seismoacoustics (Ford et al., 2014). The Comprehensive Nuclear Test Ban Treaty Organization measures this phenomenon with infrasound and seismic stations in their international monitoring system, in order to monitor nuclear explosions both above and below the Earth's surface.
Typically a blast is characterized by the nature of the explosive material utilized, whether there was any reflection (due to geology, topography, atmosphere, etc.), and the extent to which the blast was contained. Overpressure generally occurs in the case of explosions on or above the surface of the ground (Williams and Newell, 1991), and in some cases the overpressure can be recorded up to 2 seconds after the seismic waves when the explosion is approximately 1 km from the sensors.
The recorded ground motion from blasts is not simple to characterize due to the radiation pattern from the site of the explosion, which is affected by geophysical factors such as (1) geometrical spreading, (2) separation of compressional shear and surface waves, (3) reflection, refraction, diffraction and scattering, and mode conversion, and (4) frequency-dependent attenuation (New, 1991). In addition, it is influenced by aspects such as the mass of explosive and the distance from the explosion (Puri and Prakash, 1991). Similarly, different types of detonations and the prevailing weather conditions, such as temperature gradients, wind direction, and cloud cover, can affect the overpressure. These phenomena, along with the features of the structure (such as the foundation) make accurate predictions of nuisance or damage difficult.
In order to encompass the complexity of the blasts, charge weight and distance are combined to produce a parameter called 'scaled distance', which generally uses the square root of the maximum weight of the charge for predicting ground vibration and the cube root for overpressure. Thus, the scaled distance is a combination of the maximum weight of explosive used in generating the vibrations through the ground and air and the distance. The 'cube root scaled' distance is the distance from the blast to a defined position divided by the cube root of the maximum weight of explosives. Scaled distance is similarly calculated; however, the distance is divided by the square root of the maximum weight of explosives in any 8-millisecond period (Joint Committee on Administrative Rules, 1998).
Kahriman (2002) and Ozer, Kahriman, and Aksoy (2008) examined a number of predictor equations proposed in the literature, and concluded that, owing to the large number of complications related to surface blasting, a suitable generic formula has not yet been determined. In addition, Ford et al. (2014) found that there is less information available on seismic motions from surface explosions than on underground explosions.
Prediction equations for underground explosions
There is extensive literature describing prediction equations for the vibrations induced by blasting in open pit mines and during tunnelling, for example Aloui et al. (2016), Bongiovanni et al. (1991), Khandelwal and Singh (2007); Kahriman (2002), Ozer (2008), Ozer, Kahriman, and Aksoy (2008), Milev et al. (2016), and Puri and Prakash (1991). The most common approach is to plot the variation of PPV with scaled distance, especially since PPV is not as sensitive to changes in geological conditions as acceleration and displacement and provides an excellent criterion for assessing the damage (Kumar, Choudhury, and Bhargava, 2016; Puri and Prakash, 1991). Kumar, Choudhury, and Bhargava (2016) and Gupta and Hartenberger (1981) summarized the vast number of prediction equations developed since 1959, when they examined methods of creating a model that can address the rock properties of the sites when using predictive relationships. Koper et al. (2002), Bonner et al. (2013), and Yan, Jiang, and Duan (2009) noted that seismic waveforms are more complex than atmospheric acoustic waveforms due to the geological structure of the ground, and thus the scaling laws will be site-specific.
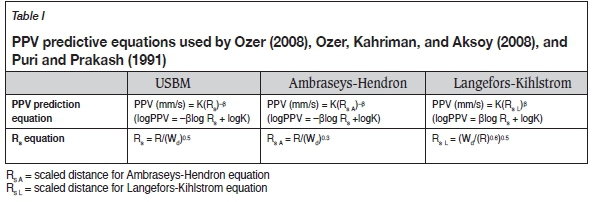
Ozer, Kahriman, and Aksoy (2008), Ozer (2008), Khandelwal and Singh (2007), and Bongiovanni et al. (1991) used three PPV-based predictor equations chosen from a number of equations proposed in the literature: (a) the US Bureau of Mines (USBM) equation, (b) the Ambraseys-Hendron equation (Ambraseys and Hendron, 1968), and (c) the Langefors-Kihlstrom equation (Langefors and Kihlstrom, 1963) to establish a relationship between PPV and scaled distance (Rs) (Table I). The USBM equation uses the square root scaled distance, Ambraseys-Hendron uses the cube root scaled distance, and the Langefors-Kihlstrom uses a different formula for scaled distance. Thus, these three equations represent a good sample of the typical predictive equations available.
where
PPV = peak particle velocity (mm/s)
Rs = scaled distance
K = the ground transmission coefficient
ß = the specific geological constant
R = distance from explosion to station (m)
Wd= maximum charge per explosion (kg)
Prediction equations for explosions on the ground surface and in the air
When a high explosive detonates in the atmosphere, an increase in pressure, known as the blast wave, is created (Williams and Newell,1991). The blast wave moves away from the centre of the blast in a spherical wave front, the peak overpressure of which subjects an additional pressure to any building it encounters.
Different types of detonation and weather condition can affect the overpressure, which may cause complaints usually attributed to ground vibration. The energy released by a surface explosion varies with the soil conditions as well.
Bonner et al. (2013), Gitterman and Hofstetter (2012), and Gitterman (2013) monitored calibration explosions on the ground surface at a military range in Israel, which they recorded with high-pressure sensors, accelerometers on the surface, buried seismometers, acoustic gauges, and high-speed cameras. Using the seismometer data, they developed a unique empirical scaled relationship for the secondary shock (SS) delay for ANFO (ammonium nitrate/fuel oil, which is a widely used bulk industrial explosive) charges and various distances. The obtained relationship can be used as a new yield estimator.
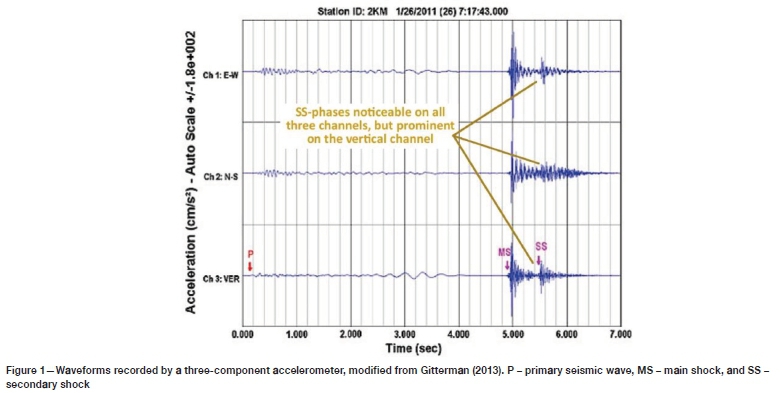
The SS delay phenomenon (Figure 1) occurs when the air blast wave for an explosion source displays a number of recurrent shocks of smaller magnitudes and at different times, caused by successive implosion of rarefaction waves (the region of low relative pressure following a shock wave). It is important to note that these shock waves are 'supersonic', i.e. travel at a speed greater than the normal velocity of sound in air (Cullis, 2001). These air waves may produce a signal in seismometers. A higher pressure shock front travels faster, therefore the time delay between the main shock (MS) and the SS phase increases with distance, as well as with the amount of explosive. Thus longer SS delays are observed for longer distances, as well as for larger amounts of explosives. Bonner et al. (2013), Gitterman and Hofstetter (2012) and Gitterman (2013) noted that the ambient temperature and pressure (altitude) would lead to only minor changes in the air blast parameters and thus did not consider them in the distance and SS delay scaling relations. The empirical relationship developed for SS delay (the time between secondary shock and main shock arrivals) is dependent on the charge and distance, as are standard air blast parameters, and also on the type of explosive (velocity of detonation).
Gitterman (2013) noted that the SS delay increased with the amount of explosives used and with decreasing velocity of detonation (VOD) of the explosives (Figure 2). This is due to the time taken to completely detonate the finite charge (the tests compared ANFO with IMI, which is a military explosive). However, Gitterman acknowledged that there may be other explosive parameters that can affect the delay. This new method may be less accurate than that of the traditional procedures based on high pressure measurements, but it is significantly less expensive and, in the case of an accidental explosion, may be the only method available. It should work well for determining the relative sizes of two charges of the same explosive.

There is very little literature available on utilizing seismograph systems to determine prediction equations for atmospheric waves created by explosions above or on the surface of the Earth. However, the SS delay is a unique parameter that can be measured by both pressure gauges and seismograph systems and could prove very useful for prediction if records from either of the sensors are not available.
Methodology
Monitoring of seismic signals
The purpose of this study was to perform an investigation similar to those by Aloui et al. (2016), Bongiovanni et al. (1991), Khandelwal and Singh (2007), Kahriman (2002), Ozer (2008), Ozer, Kahriman, and Aksoy (2008), and Puri and Prakash (1991).
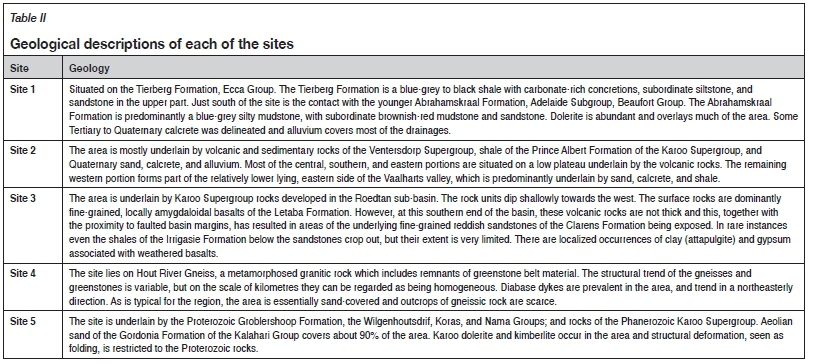
Five different military demolition ranges (the local geology is briefly described in Table II) were monitored by a mobile network of seismometers in order to develop an empirical relationship for the prediction of PPVs from on-surface blasting, which can then be used for other demolition ranges with similar properties. The results from the three different vibration prediction equations given in Table I were then compared in order to determine the most reliable equation.
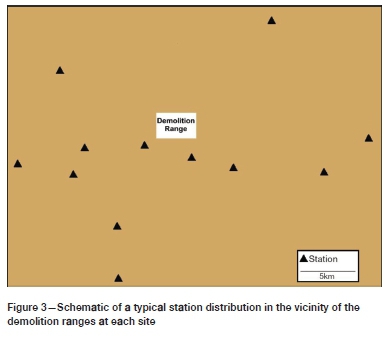
The blasting was monitored using a temporary mobile network of between five and twelve stations consisting of a combination of 4.5 Hz triaxial geophones and 1 Hz triaxial seismometers installed on the ground surface (Figure 3) at varying distances from the source, with the furthest stations being 29 km distant for site 5. The number of stations used was dependent on the local site conditions and accessibility.
The amount of explosive used and the distances between the source and stations were carefully recorded. The weight of the ordinance was recorded as net explosive content (the total mass of the enclosed explosive material, without the casings/shells) that was heaped on the surface of the ground and detonated.
A linear RMS fit regression curve of the logarithm of PPV against the logarithm of Rs was obtained for each of the explosions and each of the stations. In order to find the site constants, the graph of PPV values versus Rswas plotted for all predictor equations, along with the 95% mean prediction interval. The coefficient of determination (R2) was calculated as this is generally accepted as a basic measure of the quality of fit.
In Table I, the constants K and ß are site constants that vary between sites and are dependent on the nature of the site geology and the type of explosive. K (the ground transmission coefficient) represents the line intercept at Rs= 1 on the log-log graph and is the initial energy radiated into the immediate rock and thus is reliant on the features of the medium and the explosive used. ß (the specific geological constant) is a slope factor that provides an indication of the attenuation rate of the PPV caused by the geometric spreading and the specific characteristics of the rock (Aloui et al., 2016; Puri and Prakash, 1991).
Monitoring of atmospheric signals
Another major aim of this study was to perform similar analyses to those by Koper et al. (2002), Bonner et al. (2013), Gitterman and Hofstetter (2012), and Gitterman (2013), but using the data obtained from the mobile network of temporary stations described above.
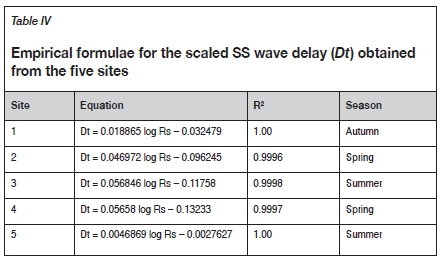
Bonner et al. (2013), Gitterman and Hofstetter (2012), and Gitterman (2013) examined data from three large-scale on-surface explosions, where the explosives were packed on dry desert alluvium. They used ANFO and military explosives (IMI) with different velocities of detonation (IMI VOD is 7130-7980 m/s and ANFO is 2400 m/s). The VODs for the explosives used in this current study ranged from 3000 m/s to 10 000 m/s, and thus fall in the same range as the military explosives used by Bonner et al. (2013), Gitterman and Hofstetter (2012), and Gitterman (2013). The following formulae were used to plot the measured scaled SS time delay (Dt) against the scaled distance (Rs):

where:
Dt is the scaled SS time delay Δt is the measured delay in seconds Wd is the amount of explosive in kg
where:
Rs is the scaled distance R is the distance in metres from the explosion to the station Wd is the amount of explosive in kg
A linear RMS-fit regression curve of the scaled SS time delay against the scaled distance was then obtained for the explosions.
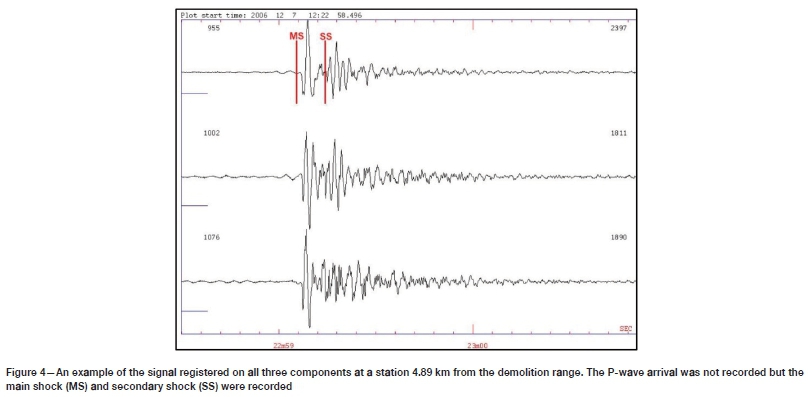
Figure 4 is an example of the atmospheric shock waves recorded at one of the stations. The horizontal line at the start of the plot is the DC level. The small number above each trace to the right is the maximum absolute count with the DC level subtracted, and the small number to the left above the trace is the DC level.
Results
Ground monitoring
PPV predictive equations
The largest PPV recorded was 0.485 mm/s for a 250 kg explosion at a distance of 10 m. However, this was only 2.5% of the 19 mm/s limit set out in the US Code of Federal Regulations (30 CFR part 816.67 of 1998), which deals with the control of adverse effects caused by the use of explosives. As was expected, since the readings were so low, no damage to the infrastructure in and around the stations was observed.
The relationships between log PPV and log Rsfor each of the sites were examined. Figure 5 displays the results for all five sites for log PPV and log Rsusing the USBM equation.
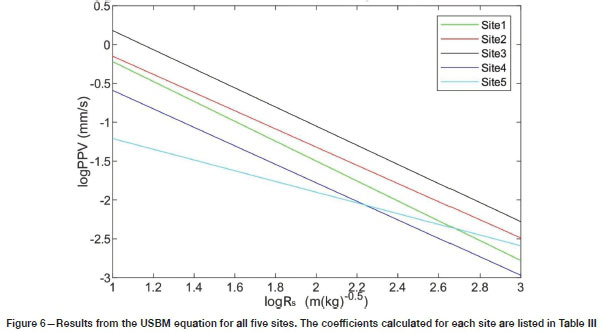
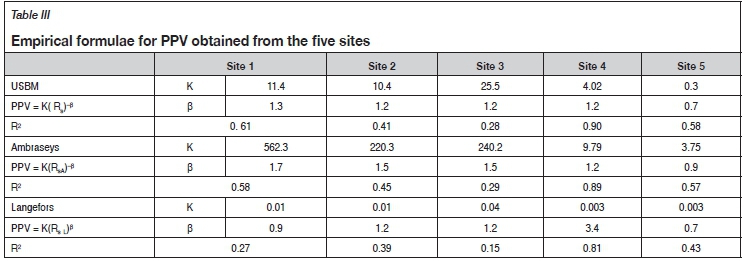
Figure 6 displays the results from each of the sites on one graph for the USBM prediction equation. The results of the regression analyses and the coefficient of determination (R2) value for each of the sites and equations are summarized in Table III.
Generally, from Table III, the Langefors-Kihlstrom equation for each of the sites gives a lower value for the coefficient of determination (R2) than the values obtained from the USBM and Ambraseys-Hendron equations. This result agrees with the findings of Bongiovanni et al. (1991); they concluded that since the data shows a poor correlation for the Langefors-Kihlstrom equation, the equation is not reliable for predicting motion produced by blasts at their site.
It is interesting to note that the highest R2 values (greater than the generally accepted value of 0.7 (Kahriman, 2002) for all three equations were for site 4, which is located on metamorphosed granitic rock. The other R2 values were far lower.
The results obtained from the USBM equation for site 1 (Table III) are similar to those of Gupta and Hartenberger (1981), and the geology is similar to one of the sites at which their study took place. The geological constants (ß) for sites 1, 2, 3, and 4 are similar for the USBM equation, and sites 2 and 3 for the Ambraseys and Langefors equations. The ground transmission coefficient (K) for each relationship for site 5, compared to the other sites, is expected to be low due to the sandy nature of the region.
Atmospheric shock wave monitoring
Secondary shock delay
The values for the atmospheric shock waves were easier to measure than those for the ground motion because the atmospheric shock waves are more prominent on the seismograms than the ground motion. Johnston (1987) encountered a similar situation and noted that analysing the atmospheric shock waves was useful when the P and S waves are not clearly recorded.
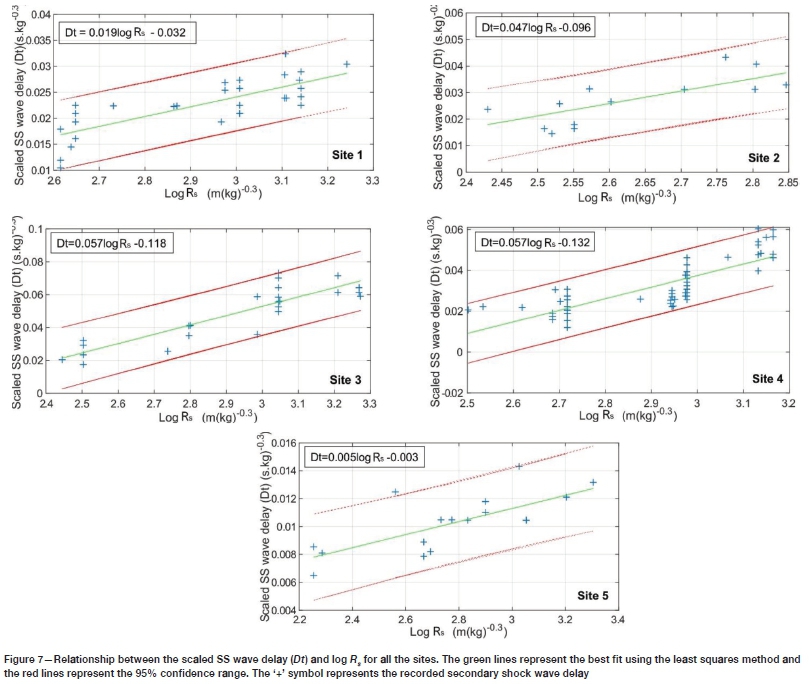
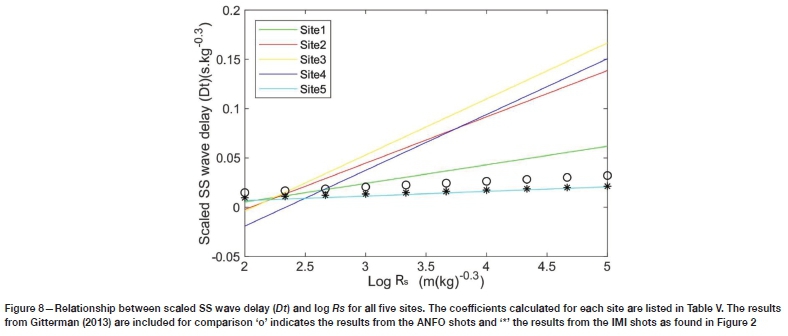
All of the graphs of the logarithm of the scaled secondary shock delay (Dt) versus the natural log Rs(as described in Bonner et al., 2013; Gitterman and Hofstetter, 2012, and Gitterman, 2013) for each of the sites are found in Figure 7, together with the 95% mean prediction interval. Figure 8 depicts the results from all the sites compared to the results obtained by Gitterman (2013) and displayed in Figure 2.
Table V summarizes the results obtained from the relationship between the logarithm of the scaled secondary shock delay (Dt) and log Rs(as described in Bonner et al., 2013; Gitterman and Hofstetter, 2012; and Gitterman, 2013) for each of the sites.
From Table V and Figure 8, it is clear that sites 2, 3, and 4 display similar gradients, which may be indicative of a different VOD within the assortment of explosives used compared to sites 1 and 5. However, as shown in Figure 8, site 5 is the only site that displays a similar gradient to the results obtained by Gitterman (2013). These differences could also be related to the differing topographies of the sites, especially since site 5 is very similar to the site used in Bonner et al., 2013; Gitterman and Hofstetter, 2012, and Gitterman, 2013.
The results in Table V display high R2 values (greater than the generally accepted value of 0.7 (Kahriman, 2002). In addition, it is clear that sites 2 to 4 display similar gradients while sites 1 and 5 differ.
Discussion
Ground monitoring
Although there is extensive literature describing prediction equations for the vibrations induced by blasting in open pit mines and tunnelling (e.g. Aloui et al., 2016; Bongiovanni et al., 1991; Khandelwal and Singh, 2007; Kahriman, 2002; Ozer, 2008; Ozer, Kahriman, and Aksoy, 2008; Puri and Prakash, 1991; Kumar, Choudhury, and Bhargava, 2016), many authors conclude that a reliable general approach or formula has not yet been established due to the complexity of issues relating to blasting.
The low R2 values obtained for the PPV predictive equations (Table III) are comparable with those of Khandelwal and Singh (2007), who used the same three equations and obtained R2 values of 0.2276 for the USBM equation, 0.1836 for the Ambraseys-Hendron equation, and 0.2218 for the Langefors-Kihlstrom equation. Thus, these low R2 are not unique to the present study. However, unlike Khandelwal and Singh (2007), the explosions in this study were detonated on the surface and, as Evers et al. (2007) and Williams and Newell (1991) stated, very little of the energy goes into the ground.
The higher coefficients of determination (R2) in Table III indicate that the formulae obtained using the USBM equation show better fit than for the other relationships, and a good fit for site 4. This is contrary to Ozer, Kahriman, and Aksoy (2008) and Kahriman (2002), who obtained the highest R2 value for the Ambraseys-Hendron equation and thus recommended the use of that equation.
However, although the R2 values for the Ambraseys-Hendron and Langefors equations are not as high as for the USBM sites, it is not necessarily true that there is something wrong with the fit. R2 measures how useful the independent variable is in predicting values of the dependent variable, not how appropriate the polynomial model is for the data. When analysing inherently unpredictable data, a small value of R2 indicates that the independent variable does not predict the dependent variable precisely.
This is particularly true for measurements of explosions on the ground surface, as opposed to excavation/mining explosions, which are within the bedrock. Thus, a lot of the energy from surface explosions is lost to the atmosphere and therefore an increase in distance from the explosions results in smaller P and S waves than calculated by the predictor equations, such as at site 5 where the sensors were placed at greater distances than at the other sites. Ichinose, Smith, and Anderson (1998), Johnston (1987), and Evers et al. (2007) noted similar findings. In addition, site 4 is a good example of an area where the geology plays an important role, as noted by Johnston (1987) and Koper et al. (2002), who stated that even minimal changes in the anelastic structure can affect the predictor equations, and Redmayne and Turbitt (1991) who noted that different soils can magnify or diminish the values obtained from predictor equations by a factor of 4.
The geological constants for regions 1, 2, 3, and 4 are similar for the USBM equation, indicating that the USBM is the more reliable PPV predictive equation for each of these sites, especially because geological constants of 1.2 are considered satisfactory (Atkinson, 2004; Atkinson and Mereu, 1992; Ford et al., 2014). Redmayne and Turbitt (1991), using a simple attenuation relationship, obtained a geological constant of 2.18, which differs from the results obtained during this study. However, the use of predictive equations designed for mining and excavation must be applied with caution, because during blasting on the surface most of the energy escapes into the atmosphere. Thus, other methods should be sought to enhance these predictive equations in order to predict the ground vibrations caused by blasting on the surface.
Although the results of this study are different at the various sites, the equation which seems to produce the best fit is the USBM equation, which is in agreement with Aloui et al. (2016). What is also noticeable is that the equation seems to hold at distances of up to 29 km, as found for site 5, which is further than the typical distances of up to 1 km used for monitoring (Bongiovanni et al. 1991).
Surface/air monitoring
Although this study only used seismographs on the surface and did not utilize the sensors used by Koper et al. (2002), Bonner et al. (2013), Gitterman and Hofstetter (2012), Gitterman (2013) and Ford et al. (2014), it provided an opportunity to replicate their studies. The fact that the explosives used included casings/ shells as well as net explosive content provided an excellent correlation with the study performed by Koper et al. (2002) on truck bombings, which also constitute a similar 'mixed' content of explosive and casings, as well as that by Redmayne and Turbitt (1991) on an aircraft crash. This study agreed with findings of Gitterman (2013), Johnston (1987), and Evers et al. (2007), who stated that the atmospheric shock waves were clearly observed at all sites, especially compared to the ground motion measurements. The seismograms showed clear and strong main shock peaks and smaller amplitude secondary peaks, with easily measured arrival times. Johnston (1987) examined the seismograms created by a missile silo explosion and noted that large arrivals were recorded over an eleven-minute interval as opposed to a scatter of less than one minute, which is expected for P-wave arrivals. The missile silo explosion was 84 km west of the station, which registered the event four minutes later. There was no trace of P- or S- waves, probably because most of the energy went into the atmosphere, but there were very small signals at the stations on hard rock.
However, the results do improve dramatically when examining the secondary shock wave phenomenon as described by Gitterman and Hofstetter (2012) and Gitterman (2013). This unique phenomenon seems to provide a better solution than the USBM, Ambraseys-Hendron, and Langefors equations for surface explosions. Although the R2 values reported in Table V, which covers the scaled secondary shock wave delay, equate to unity, which indicates that the model explains all the variability of the response data around its mean, they are similar to the Gitterman and Hofstetter (2012) and Gitterman (2013) studies. From Figure 8 it is noticeable that the gradient for site 5 is also similar.
Sites 2 to 4 display similar gradients, which could indicate a different assortment of explosives used with different VODs to those used at sites 1 and 5. Gitterman and Hofstetter (2012) and Gitterman (2013) noted similar differences when using different explosives with varying VODs. However, what is noteworthy is the similarity of the results from site 5 and those of Gitterman and Hofstetter (2012) and Gitterman (2013). This is to be expected because the conditions are similar at both sites.
Conclusions
This study has identified a number of predictive equations that have produced acceptable results using data obtained from disposal of military ordnance that included not only the explosives but also the casings/shells, the demolitions being conducted on the surface.
In general, the values for the atmospheric shock waves were easier to determine than those of the ground motion because the atmospheric shock waves are more prominent on the seismograms than those of the ground motion, due to the fact that very little of the energy is transmitted into the ground. Therefore, utilizing atmospheric shock wave measurements may be more useful because the ground motion waves are not clearly recorded. In addition, the secondary shock wave delay increases with distance from the explosion as well as the amount of explosives used, unlike the PPV, which increases with the amount of explosives used but decreases with distance. The secondary shock wave delay equations may therefore be used for sites further from the source of the explosion, where the ground motion equations are less applicable.
Although, the USBM PPV predictive equation was identified as the most reliable equation out of the three examined, the predictive equation using the secondary shock wave phenomenon produced better results.
The usefulness of the suggested prediction equations would depend on the quantity that requires predicting. Thus, when assessing how best to mitigate the hazard posed by a military demolition range, where PPV prediction is required, the USBM equation would be the better solution. Alternatively, when assisting in forensic seismology to determine the details of an unexpected explosion (such as the amount of explosives used), the secondary shock wave has the potential to be useful, especially if the ground motion waves are not obvious in the seismograms.
References
Alöüi, M., Bleüzen, Y., Essefi, E., and Abbes, C. 2016. Ground vibrations and air blast effects induced by blasting in open pit mines: Case of Metlaoui mining basin, Southwestern Tunisia. Journal of Geology and Geophysics, vol. 5, no. 3. doi: 10.4172/2381-8719.1000247 [ Links ]
Ambraseys, N.R. and Hendron, A.J. 1968. Dynamic behavior of rock masses. Rock Mechanics in Engineering Practice. Wiley, London. [ Links ]
Atkinson, G.M. 2004. Empirical attenuation of ground-motion spectral amplitudes in southeastern Canada and northeastern United States. Bulletin of the Seismological Society of America, vol. 94. pp. 1079-1095. [ Links ]
Atkinson, G.M. and Mereu, R.F. 1992. The shape of ground motion attenuation curves in southeastern Canada. Bulletin of the Seismological Society of America, vol. 82. pp. 2014-2031. [ Links ]
Bongiovanni, G., Gonelli, v., Rienzo, G., and Rinaldis, D. 1991. Experimental studies of vibrations caused by blasting of tunnel excavation. Earthquake, Blast and Impact: Measurement and Effects of Vibration. Elsevier Applied Science, London. pp. 201-210. [ Links ]
Bonner, J., Waxler, R., Gitterman, Y., and Hofstetter, R. 2013. Seismo-acoustic energy partitioning at near-source and local distances from the 2011 Sayarim explosions in the Negev desert, Israel. Bulletin of the Seismological Society of America, vol. 103, no. 2A. pp. 741-758. [ Links ]
Cullis, LG. 2001. Blast waves and how they interact with structures. Journal of the Royal Army Medical Corps, vol. 147. pp. 16-26. [ Links ]
Evers, LG., Ceranna, I., Haak, H.W., Le Pichon, A., and Whitaker, R.W. 2007. A seismoacoustic analysis of the gas-pipeline explosion near Ghislenghein in Belgium. Bulletin of the Seismological Society of America, vol. 97. pp. 417-425. [ Links ]
Ford, S.R., Rodgers, A.J., Xu, H., Templeton, P.H., Foxall, W., and Reinke, R.E. 2014. Partitioning of seismoacoustic energy and estimation of yield and height-of-burst/depth-of-burial for near surface explosions. Bulletin of the Seismological Society of America, vol. 104. pp. 608-623. [ Links ]
Gitterman, Y. 2013. Secondary shock features for large surface explosions: results from the Sayarim Military Range, Israel and other experiments. Shock Waves. doi: 10.1007/s00193-013-0487-y [ Links ]
Gitterman, Y. and Hofstetter, R. 2012. GT0 explosion sources for IMS infrasound calibration: Charge design and yield estimation from near-source observations. Pure and Applied Geophysics. doi: 10.1007/s00024-012-0575-4 [ Links ]
Gupta, I.N. and Hartenberger, R.A. 1981. Seismic phases and scaling associated with small high-explosive surface shots. Bulletin of the Seismological Society of America, vol. 71. pp. 1731-1741. [ Links ]
Ichinose, G.A., Smith, K.D., and Anderson, J.G. 1999. Seismic analysis of the 7 January 1998 chemical plant explosion at Kean Canyon, Nevada. Bulletin of the Seismological Society of America, vol. 89. pp. 938-945. [ Links ]
Johnston, A.C. 1987. Air blast recognition and location using regional seismographic networks. Bulletin of the Seismological Society of America, vol. 77. pp. 1446-1456. [ Links ]
Joint Committee on Administrative Rules 1998. Administrative Code, Title 62: Mining. Chapter 1, Part 1817, Section 1817.67. Illinois General Assembly. [ Links ]
Kahriman, A. (2002). Predictability of the ground vibration parameters induced by blasting during the tunneling. Mineral Resources Engineering, vol. 11, no. 3. pp. 279-291. [ Links ]
Khandelwal, M. and Singh, T.N. 2007. Evaluation of blast-induced ground vibration predictors. Soil Dynamics and Earthquake Engineering, vol. 27. pp. 116-125. [ Links ]
Koper, K.D., Wallace, T.C., Reinke, R.E., and Leverette, J.A. 2002. Empirical scaling laws for truck bomb explosions based on seismic ad acoustic data. Bulletin of the Seismological Society of Americaa, vol. 92. pp. 527-542. [ Links ]
Kumar, R., Choudhury, d., and Bhargava, K. 2016. Determination of blast-induced ground vibration equations for rocks using mechanical and geological properties. Journal of Rock Mechanics and Geotechnical Engineering, vol. 8, no. 3. pp. 341-349. [ Links ]
Langefors, U., Kihlstrom, B., and Westerberg, H. 1958. Ground vibrations in blasting. Water Power. p. 200. [ Links ]
Milev, A., Durrheim, R., Brovko, F., Kgarume, T., Singh, N., Lumbwe, T., Wekesa, B., Pandelany, T., and Mwila, M. 2016. Development of a South African minimum standard on ground vibration, noise, air-blast and flyrock near surface structures to be protected. SIM 14-09-01, Mine Health and Safety Council, Sandton, South Africa. [ Links ]
New, B.M. 1991. The effect of detonator variability on explosively induced ground vibration. Earthquake, Blast and Impact: Measurement and Effects of Vibration, Elsevier Applied Science, London. pp. 163-175. [ Links ]
Ozer, U. 2008. Environmental impacts of ground vibration induced by blasting at different rock units on the Kadikoy-Kartal metro tunnel. Engineering Geology, vol. 100. pp. 82-90. [ Links ]
Ozer, U., Kahriman, A., and Aksoy, M. 2008. The analysis of ground vibrations induced by bench blasting at Akyol quarry and practical blasting charts. Environmental Geology, vol. 54. pp. 737-743. [ Links ]
Puri, V.K. and Prakash, S. 1991. Estimation of design forces on structures near quarries from field blast tests. Earthquake, Blast and Impact: Measurement and Effects of Vibration. Elsevier Applied Science, London. pp. 201-210. [ Links ]
Redmayne, D.W. and Turbitt, T. 1991. Ground velocity attenuation associated with the Lockerbie air crash impact. Earthquake, Blast and Impact: Measurement and Effects of Vibration. Elsevier Applied Science, London. pp. 352-362. [ Links ]
Williams, M.S. and Newell, J.P. 1991. Methods for the assessment of the blast response of engineering structures. Earthquake, Blast and Impact: Measurement and Effects of Vibration. Elsevier Applied Science, London. pp. 176-185. [ Links ]
Yan, Z., Jiang, P., and Duan, J. 2009. Study on the methods of predicting blasting-induced ground vibration intensity. Proceedings of the 7th International Symposium on Rockburst and Seismicity in Mines (RaSiM): Controlling Seismic Hazard and Sustainable Development of Deep Mines. Tang, C.A. (ed.). Rinton Press, Princeton, NJ. [ Links ]
 Correspondence:
M. Grobbelaar
Email: michelle@geoscience.org.za
Received: 22 Oct. 2019
Revised: 7 Sept. 2020
Accepted: 8 Sept. 2020
Published: September 2020

