


Services on Demand
Article
 English (pdf)
 Article in xml format
 Article references
Indicators

Related links
-
 Cited by Google
 -
 Similars in Google
Share

 Permalink
Journal of the Southern African Institute of Mining and Metallurgy
On-line version ISSN 2411-9717
Print version ISSN 2225-6253
J. S. Afr. Inst. Min. Metall. vol.120 n.7 Johannesburg Jul. 2020
http://dx.doi.org/10.17159/2411-9717/901/2020
PAPERS OF GENERAL INTEREST
http://dx.doi.org/10.17159/2411-9717/901/2020
Energy consumption modelling using socio-economic indicators: Evidence from the BRICS-T countries
I. Karakurt
Mining Engineering Department, Karadeniz Technical University, Trabzon, Turkey. https://orchid.org/0000-0002-3360-8712
SYNOPSIS
An outlook on energy consumption in the BRICS-T countries is presented, using statistical models based on multiple regression analysis to predict the future energy consumption. The accuracy and prediction capabilities of the proposed models were verified by various statistical tests, and the most significant variables that affect the energy consumption according to the proposed models determined. Energy consumption of the BRICS-T countries is forecast for the next 5, 10, 15, and 20 years. The most significant variable statistically affecting the energy consumption of South Africa, India, and China is determined as the total population, while the urban population and gross domestic product per capita are the most significant variables for Brazil, Turkey, and the Russian Federation. The forecasting results show that the energy consumption of BRICS-T countries will increase significantly in the future.
Keywords: BRICS-T countries, socio-economic indicators, energy consumption, modelling, regression analysis.
Introduction
Increases in human population, industrialization, living standards, and growth rates of national economies have raised worldwide energy consumption. At the end of 2018, world total primary energy consumption amounted to 13 864.88 Mt of oil equivalent (Mtoe), (BP, 2019). China was the world's largest energy consumer with a 23.61% share, followed by the USA, India, the Russian Federation, and Japan with 16.60%, 5.84%, 5.20%, and 3.27% respectively. These five top countries were responsible for 54.52% of world primary energy consumption (BP, 2019). In the same year, fossil fuels accounted for 84.70% of world primary energy consumption. Fossil fuels were followed by hydroelectric, nuclear, and renewable sources (Figure 1). As seen, fossil fuels are vital for global energy needs. Recent scenarios taking into account factors such as demand growth, technology development, policy agreements for reducing greenhouse gas emissions, and changes in regional production capacity indicate that fossil fuels continue to be the dominant energy source worldwide (Feng et al., 2012; Mohr et al., 2015; Abas, Kalair, and Khan, 2015: Mardani et al., 2019; BP, 2019).

Due to the expected growth rate in world energy consumption in the coming years, predicting future energy consumption as accurately as possible has theoretical and practical significance for economists as well as energy and environmental policy-makers. In this way, the energy consumption structure can be properly planned, the relationship between energy consumption and economic development can be coordinated, and mitigations against energy-related environmental problems can be established. Many prediction models have been proposed and implemented in energy consumption studies (Liu and Qin, 2010; Yilmaz and Atak, 2010; Avami and Boroushaki, 2011; Feng et al., 2012; Aydin, 2015; Aydin, Jang, and Topal., 2016; Suganthi and Samuel, 2016; Ji, 2016; Ozturk, 2017; Shakouri and Yazdi, 2017; Rueda, 2019). Different techniques such as those based on time series and artificial intelligence have been used successfully. Although these modelling techniques are able to accurately describe long-term trends, they have some limitations such as requiring more observations and many assumptions that are difficult to test, and involving complicated computational equations as well as large errors. Simpler and less accurate modelling techniques could be advantageous, especially if the predicting module is just a part of a more complex planning tool (Bianco, Manca, and Nardini, 2009).
In this study, regression techniques are preferred for building models to forecast the energy consumption of BRICS-T countries based on socio-economic indicators. The motivation for selecting the regression technique is:
> Almost all statistical software incorporates a regression toolbox, which facilitates model construction
> Since the dependent variable is expressed as a function of independent variables, the developed model is simpler and understandable
> Regression does not contain anything of a 'black box' nature that will not give any insight on the structure of the function being approximated when building a model, as in artificial intelligence applications
> Once the ultimate equation is found, it can be applied to any scenario or projection (Sen, Günay, and Tunç, 2019).
Another important motivation for conducting the current study is the BRICS-T countries themselves, because: they have an important place in the global energy balance and the world economy. They include the world's largest energy consumers (China, India, and the Russian Federation), and are responsible for about 40% of world total primary energy consumption. Furthermore; to the best of author's knowledge, this will be the first attempt to model and forecast energy consumption of the BRICS-T countries using regression analysis.
BRICS-T countries
By the early 2000s, the economies of the BRIC countries, consisting of Brazil, the Russian Federation, the People's Republic of China, and India, had become increasingly prosperous (Azevedo et al, 2018). The BRIC acronym was changed to BRICS in 2010 when South Africa officially became a member of the group (Nistor, 2015). Although these countries differ from one another in their culture, background, language, and structure, this group shares significant common characteristics such as fast-growing economies, large populations, influential governments, and the willingness to embrace global markets. Thus, the BRICS countries have recently attracted a great deal of media and academic attention (Nistor, 2015; Zakarya et al., 2015; Azevedo, Sartori, and Campos, 2018). According to recent forecasts, BRICS countries will be economically more powerful than the major advanced countries of the world (the G7 and the European Union) by 2050 (Gusarova, 2019). Turkey, which is an emerging actor in the region, shows a similar trend to the countries in this group. Therefore, BRICS-T will be used in this study instead of the BRICS acronym.
Based on 2018 data, the BRICS-T countries represented 42.66% of the world's population, 30.1% of the land area, and 24.41% of the world's economy with a combined gross domestic product of approximately US$21 trillion (Table I) (WBI, 2019). It can also be concluded from Table I that both India's and China's annual growth rates were well above the world average, while the Russian Federation's and Turkey's annual growth rates were very close to the world average - respectively 1.32 and 1.05 times less than the world growth rate of 2.97% in 2019. On the other hand, the annual growth rates of Brazil and South Africa were below the world average - 2.66 times and 3.76 times less respectively.
Energy outlook of the BRICS-T countries
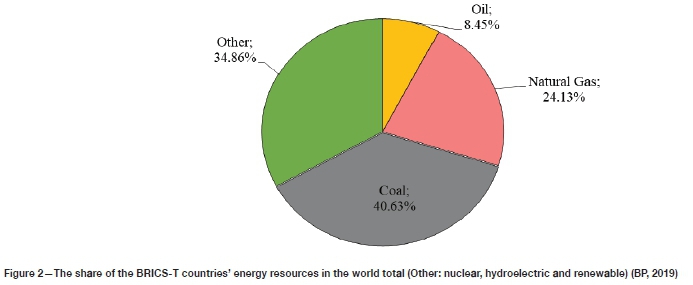
Based on 2018 data, the BRICS-T countries hold 8.45% of the world's proven oil reserves, 24.13% of the natural gas, and 40.63% of the coal reserves (Figure 2). The major oil reserves are in the Russia Federation, with 70.49% of the BRICS-T reserves, followed by China with 17.15% and Brazil with 9.45% in 2018. Similar to the oil reserves, most of the natural gas reserves of the group are in the Russian Federation (83.42%) and in China (13.01%). Turkey and South Africa do not have oil or gas reserves. All countries in the group have coal reserves.
The Russian Federation, China, and India have significant coal reserves, with 37.42%, 32.39%, and 23.65% shares respectively.
In addition to fossil fuel resources, the BRICS-T countries have significant nuclear, hydroelectric, and renewable resources, with 35.33% of the world's total. China holds the greatest potential of the bloc with 66.87% of the renewable, 60.72% of the hydroelectric, and 52.13% of the nuclear resources. In terms of nuclear and renewable resources, next come the Russian Federation and Brazil (BP, 2019; MME, 2019). Turkey has no nuclear resources, but studies have been initiated on the establishment of two nuclear power plants (Kok and Benli, 2017).
BRICS-T countries are increasingly facing higher energy demands due to their status as emerging and growing economies. On the basis of fossil-fuel-type energy resources, the Russian Federation is an energy exporter of all three types of fuel. It was the world leader in natural gas export via pipelines, exporting approximately 215 billion cubic metres of natural gas at the end of 2018. While the primary energy consumption of the world was 13.8 Gtoe by the end of 2018, the total primary energy consumption of BRICS-T countries in the same year was 5.4 Gtoe, or 39.13% of the world's total primary energy consumption. In the same year, 85.45% of the primary energy requirement of the BRICS-T countries was met by fossil fuels, with coal responsible for almost half of this consumption (Figure 3). BRICS-T countries' dependence on coal puts this group in a significant place in global coal consumption, constituting approximately 70% of the total in 2018. The main countries contributing to this were China with 50.55% and India with 11.99%.

Modelling studies
Data and methodology
Kavaklioglu et al. (2009) and Kankal et al. (2011) stated that population growth increases the need for energy resources. Additionally, the size of the urban population directly affects the industry structure, employment, living conditions, and social public services in urban areas. Gross domestic product per capita is a measure of economic activity and living standards, and strongly affects energy consumption. Most existing energy modelling studies in the literature use the independent variables selected in the current study. Therefore, in the current study, total primary energy consumption (TPEC), total population (TP), urban population (UP), and gross domestic product per capita (GDPPC) were used as dependent and independent variables.
The annual data for the BRICS-T countries for the period 1965-2017, except for the Russian Federation, and are from British Petroleum (BP, 2019) and the World Bank Development Indicators (WBI, 2019). A different starting point is used for the Russian Federation (1990-2017) since the country was established in the 1990s after the dissolution of the Soviet Union. From the historical trend, it can be concluded that the data shows substantially linearity as one of the basic assumptions for the regression model suggested by Ostrom (1990). Nevertheless, all of the data was converted into natural logarithms prior to the empirical analysis, to stabilize the variance of a series. The annual energy consumption data was divided into two groups: the data for training the model (1965-2010) and the data for testing (2011-2017). The multiple regression toolbox of the SPSS Statistics v17.0 package was used to produce the prediction models.
Model development
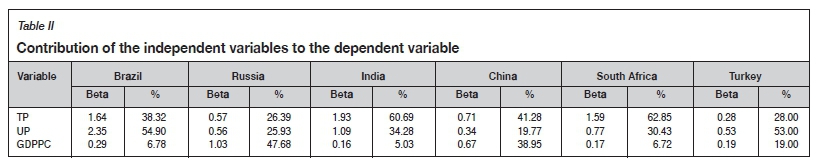
The models developed to predict the total primary energy consumption of BRICS-T countries are presented in Equations [1] to [6]. The TPEC of each country is expressed as a linear function of more than one independent variable. The contribution rates for the independent variables in the regression models provide an evaluation of the order of priority among the variables in predicting the dependent variables (Karakurt, Aydin, and Aydiner, 2013; Aydin, Karakurt, and Aydiner, 2013a). Therefore, the contribution rates were calculated to define the most significant variables statistically affecting the TPEC. These contribution rates of the independent variables are presented in Table II. Table II reveals that the total population is the most significant independent variable for South Africa, India, and China, with contribution rates of 62.85%, 60.69%, and 41.28% respectively, while the urban population is the most significant independent variable for Brazil and Turkey (54.90% and 53%). The most significant independent variable for the Russian Federation is determined as the gross domestic product per capita (GDPPC), at 47.68%.
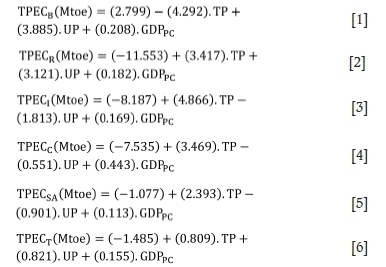
where TPEC is the total primary energy consumption (Mtoe, in natural logarithm), TP is the total population (million, in natural logarithm), UP is the urban population (million, in natural logarithm) and GDPPC is the gross domestic product per capita (current US dollars, in natural logarithm).
Verification of the proposed models
The proposed regression models are generally verified by statistical approaches, including the coefficient of determination (R2), the F-test, t-test, and the actual versus predicted data plots (Karakurt, Aydin, and Aydiner, 2012; Aydin, Karakurt, and Aydiner, 2013b). The R2 value not only indicates the goodness of fit, but can also be interpreted as the amount of variation of the dependent variable explained by the regression equation; the F-test indicates the significance of the relationship between the independent and dependent variables, and the t-test the power of each of the individual coefficients of the model. Statistical results of the developed models are given in Table III. As seen, the R2 values of the developed models are higher than 0.95, indicating a strong relationship between the TP, UP, GDPPC, and TPEC. The tabulated F-value is much smaller than the calculated F-values for all models. Therefore, it can be concluded that all equations are significant at the 95% confidence level. Similar to the calculated F-values, the t-test results for the coefficients are higher than the tabulated t-values, except for the Russian Federation. The coefficients in the models are valid in their use in the final model. However, the TP and UP variables in the predictive model for the Russian Federation failed based on the t-test, although the model was verified in terms of the other criteria. The plots of the actual versus the predicted TPEC for the model case are shown in Figure 4. The values are close to each other, verifying that the proposed models can give accurate predictions.

Performance measures of the proposed models
The performance of the proposed models was measured using three criteria - the mean absolute percentage error (MAPE), the mean absolute deviation (MAD), and the root mean square error (RMSE). The MAPE is a percentage measure of the prediction accuracy, whereas the MAD and the MSE indicate the average magnitude of absolute forecast errors (Bianco, Scarpa, and Tagliafico, 2014). The accuracy of prediction is evaluated based on the estimation of error, thus the smaller the values of MAPE, RMSE, and MAD, the better the prediction. The mathematical expressions for performance criteria are given in Equations ([7], [8], and [9]:

where n is the total number of measurements, eiis the difference between actual and predicted values, and yi is the actual value.
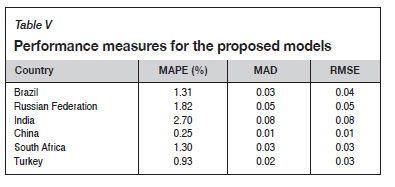
Among these criteria, MAPE is preferred over the others due to its advantages of scale-independence and interpretability (Hamzacebi and Karakurt, 2015; Aydin, Karakurt, and Hamzaçebi, 2015). The MAPE values for model evaluation are given in Table IV, and the results of performance measures for the proposed models in Table V. Based on Table V, it was determined that all models have high-accuracy prediction capability since their MAPE values are lower than 10%. Similarly, the MAD and RMSE values of the proposed models are very close to zero, indicating that the prediction performance of the models is quite high.

Forecasting of TPECs of the BRICS-T countries
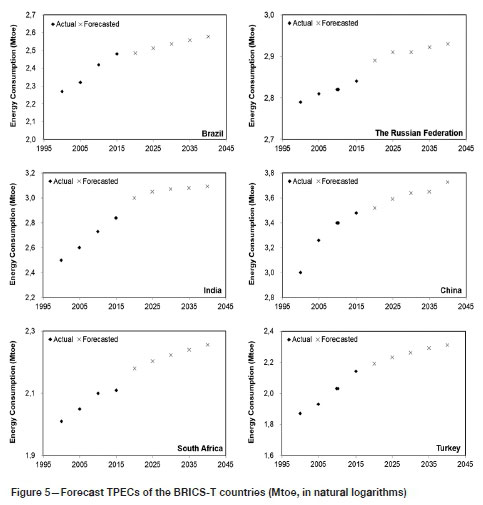
Based on the projected data (UN, 2018; OECD, 2020), the TPECs of the BRICS-T countries are forecast for the next 5, 10, 15, and 20 years with the proposed models. Figure 5 illustrates the forecast TPECs, together with the past trends. From 2015 to 2040 he TPECs of Brazil and the Russian Federation are projected to increase from 2.48 to 2.58 Mtoe (in natural logarithm) and from 2.84 to 2.93 Mtoe (in natural logarithm) - increases of 80.6% and 63.6% respectively. The TPECs of India, China, South Africa, and Turkey are projected to more than double, increasing from 2.84 to 3.09, 3.48 to 3.73, 2.11 to 2.26, and from 2.14 to 2.31 Mtoe (in natural logarithms) respectively.
Conclusions
An outlook on energy consumption in the BRICS-T countries has been presented and predictive models proposed, based on selected socio-economic indicators using multiple regression analysis. The results can be summarized as follows:
> The results reveal that China, India, and the Russian Federation, which are the most populous members of the BRICS-T countries, were among the world's top five energy consumers, accounting for 54,52% of world's TPEC in 2018. The BRICS-T countries accounted for 39.13% of the world's TPEC in that year. The vast majority of TPEC in BRICS-T countries is met by fossil fuels, with coal responsible for almost half of this consumption.
> The modelling results demonstrate that the proposed models have highly accurate prediction capabilities for TPECs of the BRICS-T countries. Almost all proposed models successfully passed the verification tests and performance measurement criteria.
> The most significant variable statistically affecting the energy consumption of South Africa, India, and China was determined to be the TP, while the UP was the most significant variable for Brazil and Turkey. The most significant variable for the Russian Federation was the GDPPC.
> The TPECs of Brazil and the Russian Federation are projected to increase by 80.6% and 63.6% respectively by 2040, whereas the TPECs of India, China, South Africa, and Turkey are projected to more than double in the same period.
Due to the dramatic increases in global energy consumption in recent years, it is believed that the information presented in this paper will be useful for both scientists in relevant areas and for energy and environmental policy-makers.
References
Abas, N., Kalair, A., and Khan, N. 2015. Review of fossil fuels and future energy technologies. Futures, vol. 69. pp. 31-49. [ Links ]
Avami, A. and Boroushaki., M. 2011. Energy consumption forecasting of Iran using recurrent neural networks. Energy Sources, Part B: Economics, Planning, and Policy, vol. 6. pp. 339-347. [ Links ]
Aydin, G. 2015. The modeling and projection of primary energy consumption by the sources. Energy Sources, Part B: Economics, Planning, and Policy, vol. 10. pp. 67-74. [ Links ]
Aydin, G., Karakurt, I., and Hamzaçebi, C. 2015. Performance prediction of diamond sawblades using artificial neural network and regression analysis. Arabian Journal for Science and Engineering, vol. 40, no. 7. pp. 2003-2012. [ Links ]
Aydin, G., Jang, H., and Topal, E. 2016. Energy consumption modeling using artificial neural networks: The case of the world's highest consumers. Energy Sources, Part B: Economics, Planning, and Policy, vol. 11, no. 3. pp. 212-219. [ Links ]
Aydin, G., Karakurt, I., and Aydiner, K. 2013a. Investigation of the surface roughness of rocks sawn by diamond sawblades. International Journal of Rock Mechanics and Mining Sciences, vol. 61. pp. 171-182. [ Links ]
Aydin, G., Karakurt, I., and Aydiner, K. 2013b. Development of predictive models for specific energy of circular diamond sawblades in sawing of granitic rocks. Rock Mechanics and Rock Engineering, vol. 46, no. 4. pp. 767-783. [ Links ]
Azevedo, V.G., Sartori, S., and campos, L.M.S. 2018. CO2 emissions: A quantitative analysis among the BRICS nations. Renewable and Sustainable Energy Reviews, vol. 81. pp. 107-115. [ Links ]
Bianco, v., Scarpa, F., and Tagliafico, L.A. 2014. Analysis and future outlook of natural gas consumption in the Italian residential sector. Energy Conversion and Management, vol. 87. pp. 754-764. [ Links ]
Bianco, v., Manca, 0., and Nardini, S. 2009. Electricity consumption forecasting in Italy using linear regression models. Energy, vol. 34. pp. 1413-1421. [ Links ]
BP. 2019. BP Statistical review of world energy 2018. https://www.bp.com/content/dam/bp/business-sites/en/global/corporate/pdfs/energy-economics/statistical-review/bp-stats-review-2018-full-report.pdf [accessed April 2019]. [ Links ]
Feng, S.J., Ma, Y.D., Song, Z.L., and Ying, J. 2012. Forecasting the energy consumption of China by the grey prediction model. Energy Sources, Part B: Economics, Planning, and Policy, vol. 7, no. 4. pp. 376-389. [ Links ]
Gusarova, S. 2019. Role of China in the development of trade and FDI cooperation with BRICS countries. China Economic Review. https://doi.org/10.1016/j.chieco.2019.01.010 [ Links ]
Hamzacebi, C. and Karakurt, I. 2015. Forecasting the energy-related CO2 emissions of Turkey using grey prediction model. Energy Sources, Part A: Recovery, Utilization, and Environmental Effects, vol. 37, no. 9. pp. 1023-1031. [ Links ]
Ji, L.O. 2016. A variable asymptote Boltzmann model for modeling and forecasting energy consumption in China. Energy Sources, Part B: Economics, Planning, and Policy, vol. 11, no. 2. pp. 124-129. [ Links ]
Kankal, M., Akpinar, A., Komurcu, I.M., and Ozsahin, S.T. 2011. Modeling and forecasting of Turkey's energy consumption using socio-economic and demographic variables. Applied Energy, vol. 88. pp. 1927-1939. [ Links ]
Karakurt, I., Aydin, G., and Aydiner, K. 2013. Experimental and statistical analysis of cutting force acting on diamond sawblade in sawing of granitic rocks. Proceedings of the Institution of Mechanical Engineers Part B: Journal of Engineering Manufacture, vol. 227, no. 2. pp. 286-300. [ Links ]
Karakurt, I., Aydin, G., and Aydiner, K. 2012. A study on the prediction of kerf angle in abrasive waterjet machining of rocks. Proceedings of the Institution of Mechanical Engineers Part B: Journal of Engineering Manufacture, vol. 226, no. 9. pp. 1489-1499. [ Links ]
Kavaklioglu, K., Ceylan, H., Ozturk, K.H., and Canyurt, E.0. 2009. Modeling and prediction of Turkey's electricity consumption using artificial neural networks. Energy Conversion and Management, vol. 50. pp. 2719-2727. [ Links ]
Kok, B. and Benli, H. 2017. Energy diversity and nuclear energy for sustainable development in Turkey. Renewable Energy, vol. 111. pp. 870-877. [ Links ]
Lewis, CD. 1982. International and Business Forecasting Methods. Butterworths, London. [ Links ]
Liu, D.P.J. and Qin, X. 2010. A grey prediction approach to forecasting energy demand in china. Energy Sources, Part A: Recovery, Utilization, and Environmental Effects, vol. 32. pp. 1517-1528. [ Links ]
Mardani, A., Streimikiene, D., Cavallaro, F., Loganathan, N., and Khoshnoudi, M. 2019. Carbon dioxide (CO2) emissions and economic growth: A systematic review of two decades of research from 1995 to 2017. Science of the Total Environment, vol. 649. pp. 31-49. [ Links ]
MME. 2019. BRICS energy indicators. Ministry of Mines and Energy of Brazil. [ Links ]
Mohr, S.H., Wang, J., Ellem, G., Ward, J., and Giurco, N. 2015. Projection of world fossil fuels by country. Fuel, vol. 141. pp. 120-135. [ Links ]
Nistor, P. 2015. FDI implications on BRICS economy growth. Procedia Economics and Finance, vol. 32. pp. 981-985. [ Links ]
OECD, 2020. OECD Data. https://data.oecd.org [accessed 1 April 2020]. [ Links ]
Ostrom, C.W. 1990. Time series analysis, regression techniques. 2nd edn. Quantitative Applications in the Social Sciences, vol. 07-009. Sage Publications, Newbury Park, CA. [ Links ]
Ozturk, F. 2017. Energy consumption-GDP causality in MENA countries. Energy Sources, Part B: Economics, Planning, and Policy, vol. 12, no. 3. pp. 231-236. [ Links ]
Rueda, R., Cuéllar, M.P., Pegalajar, M.C., and Delgado, M. 2019. Straight line programs for energy consumption modelling. Applied Soft Computing, vol. 80. pp. 310-328. [ Links ]
Sen, D., Günay, M.E., and Tunç, K.M.M. 2019. Forecasting annual natural gas consumption using socio-economic indicators for making future policies. Energy, vol. 173. pp. 1106-1118. [ Links ]
Shakouri, B. and Yazdi, S.K. 2017. Causality between renewable energy, energy consumption, and economic growth. Energy Sources, Part B: Economics, Planning, and Policy, vol. 12, no. 9. pp. 838-845. [ Links ]
Suganthi, L., and Samuel, A.A. 2016. Modelling and forecasting energy consumption in India: Influence of socioeconomic variables. Energy Sources, Part B: Economics, Planning, and Policy, vol. 11, no. 5. pp. 404-411. [ Links ]
UN, 2018. World Urbanization Prospects: The 2018 Revision. United Nations, Department of Economic and Social Affairs, Population Division. https://population.un.org/wup/ [ Links ]
WBI. 2019. World Bank Indicators. https://data.worldbank.org/indicator [accessed March 2019] [ Links ]
Yilmaz, M. and Atak, M. 2010. Decomposition analysis of sectoral energy consumption in Turkey. Energy Sources, Part B: Economics, Planning, and Policy, vol. 5. pp. 224-231. [ Links ]
Zakarya, G.Y., Mostefa, B., Abbes, S.M., and Seghir, G.M. 2015. Factors affecting CO2 emissions in the BRICS countries: A panel data analysis. Procedia Economics and Finance, vol. 26. pp. 114-125. [ Links ] ♦
 Correspondence:
I. Karakurt
Email: karakurt@ktu.edu.tr
Received: 28 Aug. 2019
Revised: 14 Apr. 2020
Accepted: 3 Aug. 2020
Published: July 2020

