


Services on Demand
Article
 English (pdf)
 Article in xml format
 Article references
Indicators

Related links
-
 Cited by Google
 -
 Similars in Google
Share

 Permalink
Journal of the Southern African Institute of Mining and Metallurgy
On-line version ISSN 2411-9717
Print version ISSN 2225-6253
J. S. Afr. Inst. Min. Metall. vol.120 n.7 Johannesburg Jul. 2020
http://dx.doi.org/10.17159/2411-9717/1196/2020
PAPERS OF GENERAL INTEREST
http://dx.doi.org/10.17159/2411-9717/1196/2020
Modelling and analysis of the Brumadinho tailings disaster using advanced geospatial analytics
I. AtifI; F.T. CawoodI; M.A. MahboobII
IWits Mining Institute (WMI), University of the Witwatersrand, Johannesburg, South Africa
IISibanye-Stillwater Digital Mining Laboratory (DigiMine), Wits Mining Institute (WMI), University of the Witwatersrand, Johannesburg, South Africa
SYNOPSIS
On 25 January 2019, one of the most significant and deadliest tailings dam failures in history occurred at Brumadinho Córrego do Feijão iron ore mine in Brazil. Twelve million cubic metres of tailings travelling at 120 km/h destroyed a total of 109 buildings, 36 belonging to Vale and 73 local residences. More than 259 people died. Some farmlands were wiped out and left under a sea of mud and tailings up to 8 m deep. Seven sections of local roads, one main road, and one railway bridge were severely damaged. In this research, a GIS-based tailings spill path (TSP) model was developed using the Python programming language for predicting the potential tailings flow path - before failure of the tailings storage facility (TSF). The pre- and post-failure satellite images of the Brumadinho disaster were processed and analysed to map the damaged infrastructure and to extract digital footprints of the tailings waste and flow path. This model was then compared with the post-failure satellite images. The TSP model is capable of generating the possible path of tailings flow and other important outputs like a processed digital elevation model (DEM), processed satellite image, down-path slope direction, and flow accumulation. The model was tested and validated for the Brumadinho and Samarco tailing disasters. The results are very promising and correlate well with the actual tailings spills. The methodology adopted in this research is robust, advanced, and can be applied to other tailings dams for hazard and risk assessment in case of their possible failure. The lack of high-resolution post-disaster satellite images and other topographical data were the main limitations of this research, which if available, could improve the modelling results.
Keywords: Geospatial modelling, tailings dam failure, Brazil dam collapse, mining disaster, Brumadinho, Samarco tailings, tailings management.
Introduction
The mining industry plays a significant role in supporting the economies of several developed and underdeveloped countries around the globe. Massive volumes of solid and liquid waste are produced as part of the mining and metals extraction processes. This has the potential for several negative socio-economic and environmental impacts. Among these, the greatest threat is failure of a tailings storage facility (TSF), which may contain a large volume of mining wastes. TSF failure is not a new phenomenon and many such events have occurred around the world, as shown in Figure 1. Some of the critical failures are Mount Polley in Canada (Byrne et al., 2015), Merriespruit in South Africa (van Niekerk and Viljoen, 2005), Cieneguita mine in Mexico (Warden, 2018), Cerro Negro in Chile (Valenzuela, 2018), Rio Pomba Cataguases in Brazil (Oliveira and Kerbany, 2016), and Bento Rodrigues in Brazil (Segura et al., 2016), but there are many more.
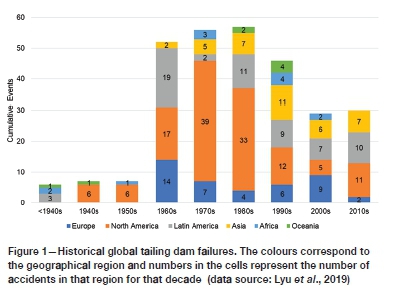
There can be many reasons for TSF failures, such as an earthquakes (17% of global failures) (Villavicencio et al., 2014; Lyu et al., 2019), heavy rainfall (Ozkan and Ipekoglu, 2002), construction issues (17.3% of global failures) (Davies, 2002; Lyu et al., 2019), poor maintenance (Rico et al., 2008), excess pore water pressure (21.6% of global failures) (Wang et al., 2016, Lyu et al., 2019), starter wall and foundation failure and slope instability (Davies, 2002). Hence, proper monitoring, management, and risk assessment should be done to minimize the devastating impacts of a possible failure. To assess the risk of a potential TSF hazard, the first (and the most important) step is to map and quantify the magnitude of potential damage that can occur in the zone of influence. The zone of influence is the area that would be significantly affected in case of a TSF failure and should be categorized as a risk zone.
Usually, field-based surveys can be used to map the zone of influence. However, such mapping is expensive and time-consuming. Recent advances in digital technologies like Geographical Information Systems (GIS) and Remote Sensing (RS) have made mapping and modelling a viable option for delineating the zone of influence. In the last decade, GIS and RS have been extensively and successfully used in disaster management studies, e.g. seismic disasters (Ehrlich et al., 2009; Frigerio et al., 2016); flood disasters (Atif, Mahboob, and Waheed, 2015, Sajjad et al., 2020); geological disasters (Li et al., 2005, Mahboob et al., 2015b, 2019b); droughts (Raut et al., 2020, Atif, Iqbal, and Su, 2019); and fire disasters (Hinkley, 2019). Several commercial and open-source satellite data-sets are available for both pre- and post-disaster analysis and future risk assessments (Mahboob et al., 2019b; Voigt et al., 2007; van Westen, 2013).
The applications of these advanced technologies can also be useful in the mining industry, particularly for TSF management. For example, Rudorff et al. (2018) investigated the impact of the Samarco tailings dam collapse on the turbidity of the Doce River plume off the eastern Brazilian coast by applying Landsat and MODIS-Aqua imagery. Mura et al. (2018) used advanced differential interferometric synthetic aperture radar (A-DInSAR) data from TerraSAR-X satellites to monitor the spatial and temporal displacement and assess the vulnerability of the TSF at Samarco in Brazil. Goff et al. (2019) proposed a cost-effective solution for monitoring and management of tailings by combining satellite-based Earth observations and global navigation satellite systems, such as the Global Positioning System (GPS) technologies, with real-time on-site instrumentation. Wang et al. (2018) modelled tailings slurry runout using a Smoothed Particle Hydrodynamics (SPH) method. They concluded that SPH numerical modelling is a powerful technique that can be recommended for risk assessment and design assessments of TSFs. However, these numerical models are usually expensive and computationally very demanding when applied to solve the mathematical equations in order to predict the tailings flow paths.
On 25 January 2019, one of the most severe tailing dam failures ever occurred in Brazil at Brumadinho Córrego do Feijão iron ore mine. About 11.7 million cubic metres of tailings was released, inundating around five miles of the area downstream and killed at least 259 people (Vale, 2020). Nine persons are still missing. The reason for the dam failure is still under investigation. Along with the TSF failure at Samarco, this disaster has put the mining industry under enormous pressure concerning safety in the zone of influence. The risk of failure of tailings dams located in Brazil has been assessed by experts, who found that 27 of the total number of TSFs in the country represent a high risk to human life, infrastructure, and the environment (New York TImes, 2019). If these TSFs, which are located in mountainous regions, failed, then an estimated number of more than 100 000 people living downstream could be affected, along with severe environmental destruction. Hence, for effective TSF management, it is essential to define the zone of influence as part of the risk assessment process. In this research, advanced geospatial analytics have been used to develop a model for mapping the potential tailings spill path (TSP) in case of a TSF failure. This can help decision-makers to assess, quantify, and manage the risk in a better, efficient, and scientific way.
Materials and methods
Study area
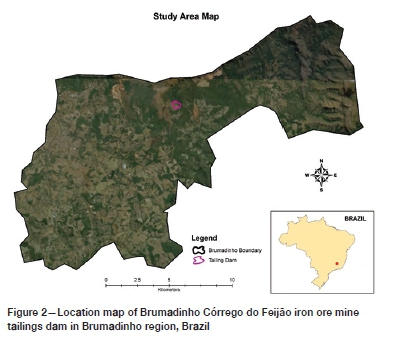
The study area is a tailings dam at Brumadinho Córrego do Feijão iron ore mine, located in Belo Horizonte's Brumadinho metropolitan district in southeastern Brazil (Figure 2). The average minimum and maximum temperatures of the study area are 16°C and 27°C respectively, with average annual precipitation of 965 mm (38 inches). The Brumadinho region has a complex geology with different types of sedimentary ores like high-grade compact and soft haematite, soft itabirite, canga rica, slumped canga, and rolado, with alluvial pebbles and cobbles of compact haematite (Simmons, 1968). Extensive mining has been conducted for more than 150 years (Chase, 2008) for gold and iron. Brazil is the world's second-largest iron ore producing country (De Moraes and Ribeiro, 2019).
Upstream construction method
The Brumadinho region has several tailings dams located in the vicinity of mining areas, most of which are constructed using the upstream method (Valenzuela, 2018).
This economical construction method is very common in low seismic risk areas. A cross-section illustrating the construction method is shown in Figure 3 (Soares, Arnez, and Hennies, 2000). In this method, the fresh tailings are deposited on top of the previously placed tailings. This requires the tailings to provide support for the dam and as such makes this type of dam potentially more prone to failure where the tailings are of low strength and materials may be prone to liquefaction (McLeod and Bjelkevik, 2017). Most of the tailing dams that have failed in the past few decades, were constructed using upstream construction (Rico et al., 2008). This method is mostly suitable for arid regions and requires more careful supervision and water management than other methods.
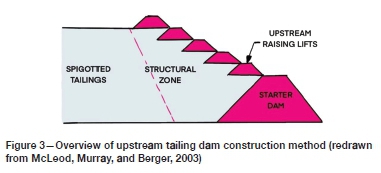
The Brumadinho Córrego do Feijão tailings dam, which failed in January 2019, was constructed using the upstream method. Upstream constructed TSFs are not permitted in Chile and Peru (and recently in Brazil as a result of the failure) due to the higher probability of failure under static and dynamic loading (Breitenbach, 2010, Valenzuela, 2018).
Satellite data
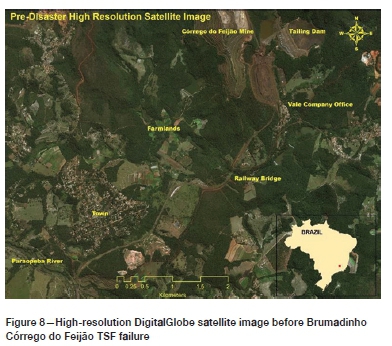
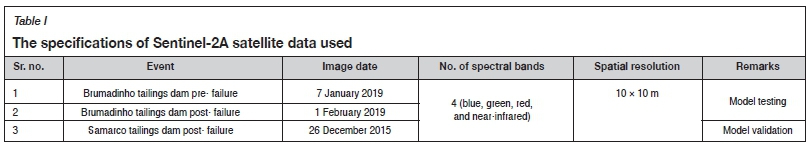
The Sentinel-2A satellite data was used owing to its good spatial resolution and open access from the European Union. For detailed analysis, another high-resolution open-source DigitalGlobe satellite image acquired from Google Earth dated November 2017 was utilized to map the elements at risk. The specifications of the Sentinel-2A images are given in Table I. Two images were used - one from before the failure and the other from after the failure. The post-failure satellite image of Samarco dam was also used for validation of the model.
The satellite images were processed with respect to the analysis as recommended in several studies (Mahboob et al., 2019a, , 2015a, Minu, Shetty, and Gopal, 2016), including atmospheric, radiometric, and geometric correction (Mahboob et al., 2019a). A command-line Atmospheric and Radiometric Correction of Satellite Imagery (ARCSI) software package was used to automate the pre-processing of Sentinel-2A imagery (Padró et al., 2017). It generates analysis-ready data by standardizing the surface reflectance for atmospheric correction, cloud masking, and topographic shadows correction.
Topographical data
The Global Digital Elevation Model (GDEM) version 2.0 was extracted from Advanced Space-borne Thermal Emission and Reflection Radiometer (ASTER) images. The GDEM was the only open-access topographical data available before the Brumadinho tailings disaster. Several studies (Gesch et al., 2016; Courty, Soriano-Monzalvo, and Pedrozo-Acuna, 2019) have used ASTER data for detailed terrain and geomorphological analysis. The absolute vertical accuracy of GDEM2 was assessed by a joint team from the USA and Japan. They found an elevation offset of +7.4 m and Root Mean Square Error (RMSE) of 15 m in the high-lying mountainous and forested area (Aster, 2016).
Development of a GIS-based TSP model
The GIS-based model was developed using Python (computer programming language) in ArcGIS Desktop version 10.X to predict the potential path of tailings waste, in case of failure, by incorporating the satellite imagery and Digital Elevation Model (DEM). Pre-processing of the DEM for filling of sinks is recommended (Köthe and Bock, 2009) before any application. The sinks are the cells in the data with very low or high values compared to their neighbour cells. Hence, it is crucial to identify any possible sinks in the data as they can distort the results. After the identification of sinks, the next important task was to fill those sinks. For this, many methods have been proposed (Lindsay, 2016; Sharma and Tiwari, 2019). The linear interpolation method proposed by Pan, Xi, and Wang (2019) was applied for filling of sinks due to its simplicity and lower computational requirements. The Python library for GIS analysis was imported and the workspace environment specified. The maximum allowable difference for the depth of a sink and the neighbour cell was auto-defined by local variable h-limit to fill those sinks. The kernel window of 3x3 was run on the surface to identify which cell to be filled and which to remain untouched as per Equation [1].
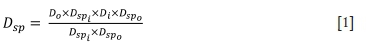
where Dspis the depth of the sink cell, Doand Diare the depths of outflow and inflow cells respectively, and Dspiand Dspoare the distance from sink cell to inflow and outflow cells, respectively. This algorithm was iterated until all the sinks were filled within the pre-defined h-limit to obtain a DEM without depressions. After pre-processing, the smoothed DEM was incorporated in the TSP model to generate other hydrological parameters, i.e. flow direction and flow accumulation. To calculate the flow direction, the slope of each cell was determined using a geodesic measurement technique. Equation [2] was used to compute the slope variation in elevation surface:
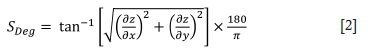
where SDegis the slope measurement in degrees and ôz/ôx and ôz/ôy represent the change (difference) in horizontal and vertical directions, respectively.
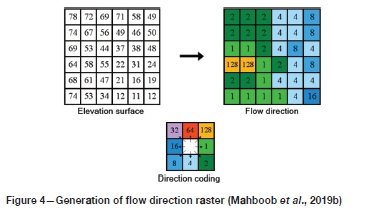
After computing the slope variations, a flow direction map was generated using the D8 technique, which was further based on three flow-modelling algorithms proposed by Jiaye et al. (2020). D8 calculates the flow direction for each cell with its downward steepest-slope neighbour cells. The flow direction grid was generated to represent flow in several directions with unique colour symbols, where the colours represent directional distribution of flow (Figure 4).
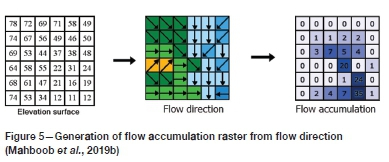
The flow direction raster was then used to generate the flow accumulation map to highlight the total accumulated flow from higher to lower elevation based on the specified threshold value for the pixels (Figure 5). It is noteworthy that flow accumulation plays a vital role in dam failures, surface landslides, and subsurface land subsidence (Liu et al., 2014).
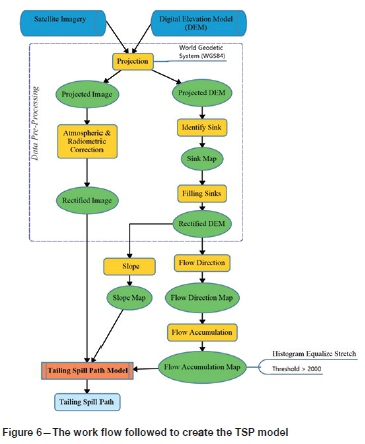
For the delineation of tailing spill paths, the threshold was examined by applying the histogram equalize stretch to the flow accumulation raster. It helps to determine the minimum number of cells that contribute to generating flow into the target cells. This threshold was found to be the most sensitive parameter of the TSP model for determining the spill path accurately. The lower the threshold value, the lower will be the number of cells that can contribute to generate the flow. The model was tested for the Brumadinho Córrego do Feijão tailings dam for threshold values starting from 100 and increasing in steps of 100 till the flow accumulation started towards the downslope cells. The final threshold value was found to be greater than or equal to 2000. The model was further validated on another TSF (Samarco dam disaster) located in a similar region to assess its accuracy under certain conditions. The work flow and Python code for the development of the TSP model are given in Figure 6 and Appendix-A, respectively.
Results and discussion
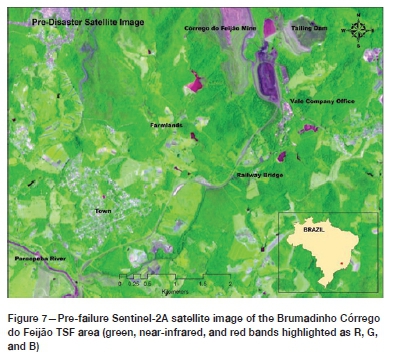
The pre-failure Sentinel-2A satellite image of the Brumadinho Córrego do Feijão TSF is given in Figure 7. The dark and light green tones represent the forest cover and farmlands respectively. The whitish-grey colour represents the semi-urban region (towns and villages), and the dark purple colour highlights the freshwater resources. The TSF is shown as dark grey, which might be related to the altered chemical materials in the tailings.
In addition to this pre-failure satellite image, the highresolution DigitalGlobe satellite image acquired from Google Earth was also analysed to assess the significant elements at risk due to TSF failure (Figure 8).
The post-failure Sentinel-2A satellite image (Figure 9) shows the spill and the extent of destruction caused by the failure. After mapping of the affected area, the digital footprint of the tailings spill was extracted and overlaid on the high-resolution imagery for detail damage analysis, as shown in Figure 10.
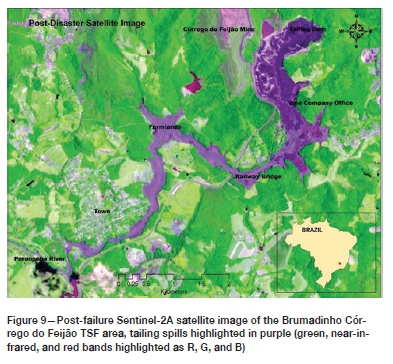

The results show that the total area of the spill was about 3.1 km2. A straight line from the start (the TSF) to end of the flow (Paraopeba River) measured 6 km. However, the length of the spill measured along the centre line of the flow path was about 10 km. The main infrastructure affected comprised the Vale administrative office, a railway bridge, some farmlands in the northwest, and houses located in the southern side of the town. A considerable portion of the tailings ran into the Paraopeba River, causing significant pollution.
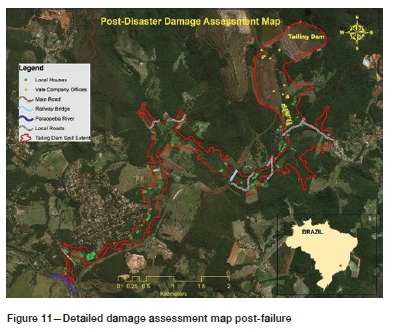
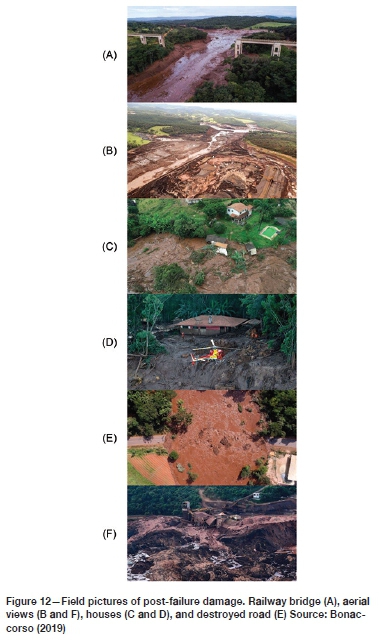
A total of 109 buildings were damaged; 36 belonged to Vale and the remaining 73 were local residences (Figure 11). Some farmlands were wiped out and left under a sea of mud with depths of around 8 m. Seven sections of local roads, one main road, and one railway bridge were severely damaged. Field pictures from post-failure are given in Figure 12, showing the collapsed bridge (Figure 12A), aerial views of the catastrophe (Figures 12B and F), and demolished roads and houses (Figures 12C-E).
For the back-propagation modelling of the TSF failure, the TSP model was developed and applied to predict the potential path of the tailings spill based on the DEM of the area. The Graphical User Interface (GUI) of the developed model is shown in Figure 13.
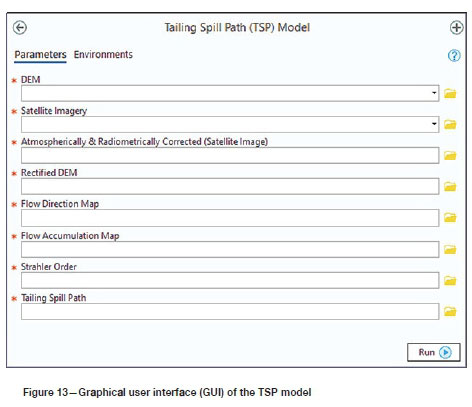
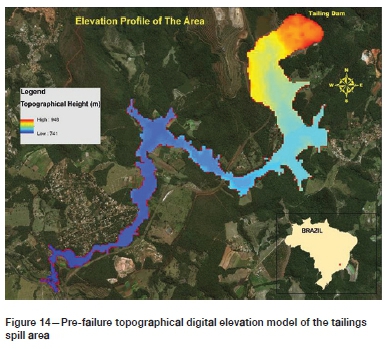
The input of the model is the raw DEM and satellite image of the study area. The model can generate several output maps such as processed DEM, processed satellite image, elevation, slope, flow direction, flow accumulation, and the potential path that the liquefied tailings will take. The elevation map showed that the vertical height variation from Brumadinho Córrego do Feijão TSF to the Paraopeba River was 207 m (from 948 m to 741 m above mean sea level), as shown in Figure 14.
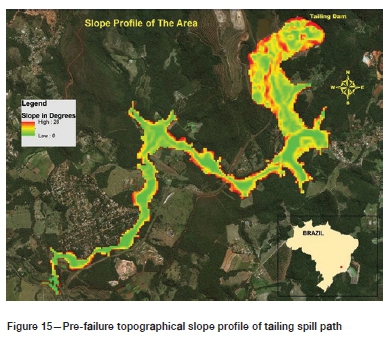
The results of slope analysis (Figure 15) showed a slope profile of between 0 and 28 degrees with the maximum slope of 28 degrees at the TSFs and zero towards the Paraopeba River.
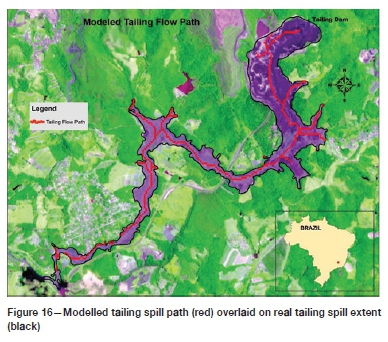
The developed model was applied to delineate the potential tailings flow paths, before the failure. The results show that the potential spill path as predicted by the TSP model using geospatial analytics matched the actual extents of the tailing spill, shown in Figure 16.
The elevation profile of the predicted tailings spill path was also extracted - illustrated in Figure 17. The elevation difference is 207 m with an average topographic slope of 2.07% over the 10 km horizontal distance to the Paraopeba River.

A TSP model was developed for TSFs located in mountainous terrain and was further validated for the Samarco Tailings dam of Brazil. The Samarco TSF failure, which occurred on 5 November 2015, also constituted a major disaster in the history of the mining industry. Figure 18 shows the potential tailings spill path (red line) from the Samarco TSF as predicted by the TSP model, overlaid on the post-failure satellite image. The results illustrate that the predicted tailings flow path is in accordance with and within the actual tailings spill extent, hence validating the model.

This TSF failure devastated two communities, Bento Rodrigues and Paracatu de Baixo, located about 2 km and 38 km away from the collapsed dam (do Carmo et al., 2017). The section in Figure 19 shows the modelled tailings flow up to point X in Figure 18, which is 50 km away from the start of the spill. Modelling was stopped at point X due to the presence of thick cloud cover in the next satellite image. In this case, the elevation difference is 804 m with an average slope of 2.2%.

The validation results showed that the model is capable of making acceptable predictions of the potential tailings flow path in the case of TSF failures in mountainous regions. The output of the model is also suitable for mapping a first pass of the zone of influence, which in turn can be used in the development of mitigation strategies as well as guide search and rescue missions. The accuracy of the TSP model is highly dependent on the spatial resolution of the input DEM. Fine resolution (<5 m) will generate more detailed and accurate results.
Conclusion
Geospatial technologies were successfully applied for post-failure modelling and analysis of TSF failures. The TSP model was developed and applied to two TSF failures, Brumadinho Córrego do Feijão and Samarco in Brazil. The predicted tailings flow paths based on geospatial technologies were found to correlate well with the actual (post-failure) paths.
An attempt was made to delineate the path followed by the spill from the Brumadinho Córrego do Feijão iron ore mine TSF using satellite data and geospatial technologies. The TSP model developed, and methodology adopted, in this research is robust, advanced, and can be applied to other TSFs for assessment of areas which could be affected in case of failure. Currently, the model is suited for the prediction of the longitudinal section of a tailings flow; however, further research into prediction of the the cross-sectional characteristics is also recommended. Highresolution LiDAR (Light Detection and Ranging) point cloud data-sets could be used for this purpose. The unavailability of high-resolution post-failure satellite images and topographical data ( <1m spatial resolution) was the main limitation of this research. This data, if available, could improve the modelling results.
Acknowledgements
The work presented here was conducted as part of postdoctoral fellowship at the Wits Mining Institute (WMI), University of The Witwatersrand, Johannesburg, South Africa. The authors would like to thank and acknowledge the administrative and financial support provided by the Sibanye-Stillwater Digital Mining Laboratory (DigiMine), WMI.
References
Aster, G. 2016. Validation Team (2011) ASTER Global Digital Elevation Model Version 2-Summary of Validation Results. METI and NASA. [ Links ]
Atif, I., Iobal, J., and Su, L.-J. 2019. Modeling hydrological response to climate change in a data-scarce glacierized high mountain Astore Basin using a fully distributed TOPKAPI model. Climate, vol. 7 p. 127. [ Links ]
Atif, I., Mahboob, M. a., and Waheed, A. 2015. Spatio-temporal mapping and multi-sector damage assessment of 2014 flood in Pakistan using remote sensing and GIS. Indian Journal of Science and Technology, vol. 8. p. 1. [ Links ]
Bonacoorso, N. 2019. Before and after images of Brazil's disastrous dam collapse. https://weather.com/news/news/2019-02-07-brazil-dam-collapse-satellite-photos [accessed 1 March 2020]. [ Links ]
Breitenbach, A. Overview: Tailings disposal and dam construction practices in the 21st century. Proceedings of Tailings and Mine Waste, 2010: The International Conference on Tailings and Mine Waste. CRC Press, Leiden, The Netherlands. pp. 49-57. [ Links ]
Byrne, P., Hudson-Edwards, K., Macklin, M., Brewer, P., Bird, G., and Williams, R. 2015. The long-term environmental impacts of the Mount Polley mine tailings spill, British Columbia, Canada. Proceedings of the EGU General Assembly Conference, Vienna, 12-17 April 2015 [Abstracts]. [ Links ]
Chase, J. 2008. Their space: Security and service workers in a Brazilian gated community. Geographical Review, vol. 98. pp. 476-495. [ Links ]
Courty, L.G., Soriano-Monzalvo, J.C. and Pedrozo-Acuna, A. 2019. Evaluation of open-access global digital elevation models (AW3D30, SRTM, and ASTER) for flood modelling purposes. Journal of Flood Risk Management, vol. 12. e12550. [ Links ]
Davies, M.P. 2002. Tailings impoundment failures Are geotechnical engineers listening? Geotechnical News-Vancouver, vol. 20. pp. 31-36. [ Links ]
De Moraes, S. and Ribeiro, T. 2019. Brazilian iron ore and production of pellets. Mineral Processing and Extractive Metallurgy Review, vol. 40. pp. 16-23. [ Links ]
Do Carmo, F.f., Kamino, L.H.Y., Junior, R.T., De Campos, I.C., Do Carmo, F.f., Silvino, G., Mauro, M.L., Rodrigues, N.U.A., De Souza Miranda, M P., and Pinto, C.E.F. 2017. Fundão tailings dam failures: The environment tragedy of the largest technological disaster of Brazilian mining in global context. Perspectives in Ecology and Conservation, vol. 15. pp. 145-151. [ Links ]
Ehrlich, D., Guo, H., Molch, K., Ma, J. and Pesaresi, M. 2009. Identifying damage caused by the 2008 Wenchuan earthquake from VHR remote sensing data. International Journal of Digital Earth, vol. 2. pp. 309-326. [ Links ]
Frigerio, I., Ventura, S., Strigaro, d., Mattavelli, M., De Amicis, M., Mugnano, S. and Boffi, M. 2016. A GIS-based approach to identify the spatial variability of social vulnerability to seismic hazard in Italy. Applied Geography, vol. 74. pp. 12-22. [ Links ]
Gesch, D., Oimoen, M., Danielson, J. and Meyer, D. 2016. Validation of the ASTER global digital elevation model version 3 over the conterminous United States. International Archives of Photogrammetry, Remote Sensing and Spatial Information Sciences, vol. 41. p. 143. [ Links ]
Goff, O., Gimeno, O., Petkovsek, G., and Roca, M. 2019. Minimising the risks of tailings dams with remote sensing data. Proceedings of the ICOLD 2019 Symposium, (ICOLD 2019), Ottawa, 9-14 June 2019. Taylor & Francis. [ Links ]
Hinkley, E. 2019. Remote sensing in support of disasters with a focus on wildland fire. US Department of Agriculture. [ Links ]
Jiaye, L., Tiejian, L., Zhang, L., Sivakumar, B., Xudong, f., Huang, Y., and Rui, B. 2020. A D8-compatible high-efficient channel head recognition method. Environmental Modelling and Software, 104624. doi: 10.1016/j.envsoft.2020.104624 [ Links ]
Köthe, R.and Bock, M. 2009. Preprocessing of digital elevation models-derived from laser scanning and radar interferometry-for terrain analysis in geosciences. Proceedings of Geomorphomeay, Zurich, Switzerland. http://geomorphometry.org/KoetheBock2009. [ Links ]
Li, C.-Z., Nie, H.-F., Wang, J. and Wang, X.-H. 2005. A remote sensing study of characteristics of geologicol disasters in a mine. Remote Sensingfor Land and Resources, vol. 17, no. 1. pp. 45-48. [ Links ]
Lindsay, J.B. 2016. Efficient hybrid breaching-filling sink removal methods for flow path enforcement in digital elevation models. Hydrological Processes, vol. 30. pp. 846-857. [ Links ]
Liu, X.L., Li, J.G., Li, X., Wang, O.L., Zhang, L.F., and Liao, W.L. 2014. Digital drainage network model of Ebinur Lake basin of Bortala Mongol Autonomous Prefecture based on DEM data. Applied Mechanics and Materials, vol. 522-524. pp.1161-1165. [ Links ]
Lyu, Z., Chai, J., Xu, Z., Oin, Y. and Cao, J. 2019. A comprehensive review on reasons for tailings dam failures based on case history. Advances in Civil Engineering. https://doi.org/10.1155/2019/4159306 [ Links ]
Mahboob, M., Genc, B., Celik, T., Ali, S., and Atif, I. 2019a. Mapping hydrothermal minerals using remotely sensed reflectance spectroscopy data from Landsat. Journal of the Southern African Institute of Mining and Metallurgy, vol. 119. pp. 279-289. [ Links ]
Mahboob, M.A., Genc, B., Celik, T., Ali, S., and Atif, I. 2019b. Modeling and analysis of Lily gold mine disasters using geoinformatics. GeoJournal, vol. 85. pp. 837-862. [ Links ]
Mahboob, M.A., Atif, I., and Iobal, J. 2015a. Remote sensing and GIS applications for assessment of urban sprawl in Karachi, Pakistan. Science, Technology and Development, vol. 34. pp. 179-188. [ Links ]
Mahboob, M.A., Iobal, J., and Atif, I. 2015b. Modeling and simulation of glacier avalanche: A case study of gayari sector glaciers hazards assessment. IEEE Transactions on Geoscience and Remote Sensing, vol. 53. pp. s5824-5834. [ Links ]
Mcleod, H. and Bjelkevik, A. 2017. Tailings dam design: Technology update. Proceedings of the 85th Annual Meeting of International Commission on Large Dams, 3-7 July 2017.Czech National Committee on Large Dams, Prague. [ Links ]
Mcleod, H., Murray, L,. and Berger, K.C. 2003. Tailings dam versus a water dam, what is the design difference. Proceedings of the ICOLD Symposium on Major Challenges in Tailings Dams. International Commission on Large Dams, Paris. p. 12. [ Links ]
Minu, S., Shetty, a., and Gopal, B. 2016. Review of preprocessing techniques used in soil property prediction from hyperspectral data. Cogent Geoscience, vol. 2. 1145878. [ Links ]
Mura, I.C., Gama, F.F., Paradella, W.R., Negrão, P., Carneiro, S., De Oliveira, C.G., and Brandão, W.S. 2018. Monitoring the vulnerability of the dam and dikes in Germano iron mining area after the collapse of the tailings dam of Fundão (Mariana-MG, Brazil) using DInSAR techniques with TerraSAR-X data. Remote Sensing, vol. 10. p. 1507. [ Links ]
New York Times. 2019. Why did the dam in Brazil collapse? Here's a brief look. https://www.nytimes.com/2019/02/09/world/americas/brazil-dam-disaster.html [accessed 1 March 2020]. [ Links ]
Oliveira, M.G.S. and Kerbany, M. 2016. Environmental vulnerability and technological risks in collapse and break of dams in Brazil: Lessons for Mariana (MG) disaster. Proceedings of the 15th Conference of the Global Spatial Data Infrastructure (GSDI) Association, Taipei. pp. 539-546. [ Links ]
Ozkan, S. and Ipekoglu, B. 2002. Investigation of environmental impacts of tailings dams. Environmental Management and Health, vol. 13, no. 3. pp. 242-248. https://doi.org/10.1108/09566160210431042. [ Links ]
Padró, J.-C., Pons, X., Aragonés, D., DIaz-Delgado, R., GarcIa, D., Bustamante, J., Pesouer, L., Domingo-Marimon, C., González-Guerrero, Ò., and Cristobal, J. 2017. Radiometric correction of simultaneously acquired Landsat-7/Landsat-8 and Sentinel-2A imagery using pseudoinvariant areas (PIA): Contributing to the Landsat time series legacy. Remote Sensing, vol. 9. p. 1319. [ Links ]
Pan, F., Xi, X., and Wang, C. 2019. A Matlab-based digital elevation model (DEM) data processing toolbox (MDEM). Environmental Modelling and Software, vol. 122. 104566. [ Links ]
Raut, D., Mukherjee, N., Sheikh, Z., and Basu, A. 2020. Drought vulnerability assessment using GIS: Case of Sangli District, Maharashtra. Applications of Geomatics in Civil Engineering. Springer. [ Links ]
Rico, M., Benito, G., Salgueiro, A., DIez-Herrero, A., and Pereira, H. 2008. Reported tailings dam failures: a review of the European incidents in the worldwide context. Journal of Hazardous Materials, vol. 152. pp. 846-852. [ Links ]
Rudorff, N., Rudorff, C. M., Kampel, M., and Ortiz, G. 2018. Remote sensing monitoring of the impact of a major mining wastewater disaster on the turbidity of the Doce River plume off the eastern Brazilian coast. ISPRS Journal of Photogrammetry and Remote Sensing, vol. 145. pp. 349-361. [ Links ]
Sajjad, A., Lu, J., Chen, X., Chisenga, C., Saleem, N., and Hassan, H. 2020. Operational monitoring and damage assessment of riverine flood-2014 in the Lower Chenab Plain, Punjab, Pakistan, using remote sensing and GIS techniques. Remote Sensing, vol. 12. p. 714. [ Links ]
Segura, F., Nunes, E.A., Paniz, F.P., Paulelli, A.C., Rodrigues, G.B., Braga, G.Ú.L., Dos Reis Pedreira Filho, W., Barbosa Jr, F., Cerchiaro, G., and Silva, F.F. 2016. Potential risks of the residue from Samarco's mine dam burst (Bento Rodrigues, Brazil). Environmental Pollution, vol. 218. pp. 813-825. [ Links ]
Sharma, A. and Tiwari, K. 2019. Sink removal from digital elevation model-A necessary evil for hydrological analysis. Current Science, vol. 1 17, no. 9. p. 1512-1515. [ Links ]
Simmons, G. 1968. Geology and iron deposits of the Western Serra do Curral, Minas Gerais, Brazil. US Geological Survey Professional Paper 342-G. https://pubs.usgs.gov/pp/0341g/report.pdf [ Links ]
Soares, L., Arnez, F. and Hennies, W.T. 2000. Major causes of accidents in tailing dam due to geological and geotechnical factors. Proceedings of the International Symposium on Mine Planning and Equipment Selection, Athens, Greece, 6-9 November 2000. Balkema, Rotterdam, The Netherlands. pp. 371-376. [ Links ]
Vale. 2020. Vale will begin disposing of tailings from dam breach at Feijão Mine. Engineering and Mining Journal. p. 221. [ Links ]
Valenzuela, L. 2018. Design, construction, operation and the effect of fines content and permeability on the seismic performance of tailings sand dams in Chile. Obras y Proyectos. pp. 6-22. [ Links ]
Van Niekerk, H. and Viljoen, M. 2005. Causes and consequences of the Merriespruit and other tailings-dam failures. Land Degradation and Development, vol. 16. pp. 201-212. [ Links ]
Van Westen, C.J. 2013. Remote sensing and GIS for natural hazards assessment and disaster risk management. Treatise on Geomorphology, vol. 3. pp. 259-298. [ Links ]
Villavicencio, G., Espinace, R., Palma, J., Fourie, A., and Valenzuela, P. 2014. Failures of sand tailings dams in a highly seismic country. Canadian Geotechnical Journal, vol. 51. pp. 449-464. [ Links ]
Voigt, S., Kemper, T., Riedlinger, T., Kiefl, R., Scholte, K., and Mehl, H. 2007. Satellite image analysis for disaster and crisis-management support. IEEE Transactions on Geoscience and Remote Sensing, vol. 45. pp. 1520-1528. [ Links ]
Wang, K., Yang, P., Hudson-Edwards, K.A., Lyu, W., Yang, C., and Jing, X.J.W. 2018. Integration of DSM and SPH to model tailings dam failure run-out slurry routing across 3D real terrain, Water, vol. 10, no. 8. https://doi.org/10.3390/w10081087 [ Links ]
Wang, S., Zhang, H., Zou, Z., and Liu, X. 2016. Liquid-solid coupling analysis of tailings dam under complex engineering conditions. Proceedings of the 3rd International Symposium on Mine Safety Science and Engineering. pp. 413-418. https://isms2016.proceedings.mcgill.ca/article/view/125 [ Links ]
Warden, S. 2018. Retaining wall collapses at Chihuahua Mine, Fatalities reported Mexico Business Publishing. http://www.mineriamexico.com/retaining-wall-collapses-at-cihuahua-mine-fatalities-reported/ [accessed 16 February 2020] [ Links ]
 Correspondence:
I. Atif
Email: iqra.atif@wits.ac.za / iqraatif18@hotmail.com
Received: 26 Apr. 2020
Revised: 27 Jul. 2020
Accepted: 3 Aug. 2020
Published: July 2020
Appendix A
Python code for the development of the TSP model
import arcpy
from arcpy import env
from arcpy.sa import *
env.workspace = "C:\GIS-TSP Model\Data"
arcpy.CheckOutExtension("Spatial-Analyst")
arcpy.ProjectRaster_management(in_raster=Satellite_Imagery,
out_raster=Atmospherically_Radiometrically_Corrected_
Satellite_Image_, out_coor_system="PROJCS['WGS_1984_UTM_
Zone_23N',GEOGCS['GCS_WGS_1984',DATUM['D_WGS_1984',S
PHEROID['WGS_1984',6378137.0,298.257223563]],
PRIMEM['Greenwich',0.0],UNIT['Degree',0.0174532925199433]],
PROJECTION['Transverse_Mercator'],
PARAMETER['False_Easting',500000.0],
PARAMETER['False_Northing',0.0],
PARAMETER['Central_Meridian',- 45.0],PARAMETER['Scale_Factor',0.9996], PARAMETER['Latitude_Of_Origin',0.0],
UNIT['Meter',1.0]]",
resampling_type="NEAREST",
cell_size="29,9314345838804 29,9314345838805",
geographicjransform="",
Registration_Point="",
in_coor_system="GEOGCS['GCS_WGS_1984',
DATUM['D_WGS_1984',
SPHEROID['WGS_1984',6378137.0,298.257223563]],
PRIMEM['Greenwich',0.0],
UNIT['Degree',0.0174532925199433]]",
vertical="NO_VERTICAL")
arcpy.ProjectRaster_management(in_raster=DEM,
out_raster=Output_Project_DEM, out_coor_
system="PROJCS['WGS_1984_Complex_UTM_Zone_23N',
GEOGCS['GCS_WGS_1984',
DATUM['D_WGS_1984',
SPHEROID['WGS_1984',6378137.0,298.257223563]],
PRIMEM['Greenwich',0.0],
UNIT['Degree',0.0174532925199433]],
PROJECTION['Transverse_Mercator_Complex'],
PARAMETER['False_Easting',500000.0],
PARAMETER['False_Northing',0.0],
PARAMETER['Central_Meridian',-45.0],
PARAMETER['Scale_Factor',0.9996],
PARAMETER['Latitude_Of_Origin',0.0],
UNIT['Meter',1.0]]",
resampling_type="NEAREST",
cell_size="29,9314345838804 29,9314345838805",
geographic_transform="", Registration_Point="", in_coor_
system="PROJCS['WGS_1984_UTM_Zone_23N',
GEOGCS['GCS_WGS_1984',
DATUM['D_WGS_1984',SPHEROID['W
GS_1984',6378137.0,298.257223563]],
PRIMEM['Greenwich',0.0],
UNIT['Degree',0.0174532925199433]],
PROJECTION['Transverse_Mercator'],
PARAMETER['False_Easting',500000.0],
PARAMETER['False_Northing',0.0],
PARAMETER['Central_Meridian',-45.0],
PARAMETER['Scale_Factor',0.9996],
PARAMETER['Latitude_Of_Origin',0.0],UNIT['Meter',1.0]]",
vertical="NO_VERTICAL")
arcpy.env.overwriteOutput = False
Filled-DEM = arcpy.GetParameterAsText(O)
Satellite_Imagery = arcpy.GetParameterAsText(l) Atmospherically_
Radiometrically_Corrected_Satellite_Image_ = arcpy.
GetParameterAsText(2)
Rectified_DEM = arcpy.GetParameterAsText(3)
Flow_Direction_Map = arcpy.GetParameterAsText(4)
Flow_Accumulation_Map = arcpy.GetParameterAsText(5)
Tailing_Spill_Path = arcpy.GetParameterAsText(6)
Strahler_Order = arcpy.GetParameterAsText(7)
inSurfaceRaster = "Elevation"
sink_minimum = ZonalStatistics(sink_areas, "Value",
inSurfaceRaster, "Minimum")
sink_maximum = ZonalFill(sink_areas, inSurfaceRaster)
sink_depth = Minus(sink_maximum, sink_minimum)
h-Limit = 3.28
Output-Fill = Fill(inSurfaceRaster, h-Limit)
Output-Fill.save("C:\GIS-TSP Model\Data\Filled-DEM")
inRaster = "Filled-DEM"
outMeasurement = "DEGREE"
method = "GEODESIC"
arcpy.CheckOutExtension("3D-Analyst")
arcpy.Slope_3d(inSurfaceRaster, outMeasurement, method)
arcpy.Slope_3d.save("C:\GIS-TSP Model\Data\Slope")
inRaster = "Filled-DEM"
method = "D8"
output-FlowDirection = FlowDirection(inRaster, method, outRaster)
output-FlowDirection.save("C:\GIS-TSP Model\Data\Flow-Direction")
inflow-DirectionRaster = "output-FlowDirection"
dataType = "INTEGER"
Output-FlowAccumulation = FlowAccumulation(inflow- DirectionRaster, dataType)
Output-FlowAccumulation.save("C:\GIS-TSP Model\Data\Flow-Accumulation")
Flow-Accumulation-Conditional = Con(Raster("Output-FlowAccumulation") > 2000, " Output-FlowAccumulation")
Flow-Accumulation-Conditional.save("C:\GIS-TSP Model\Data\Flow-Accumulation-Conditional")
RasterConditioning = "Flow-Accumulation-Conditional"
TailingSpillPath = "C:\GIS-TSP Model\Data\Tailing Spill Path.shp"
backgrVal = "ZERO"
dangleTolerance = 50
field = "VALUE"
arcpy. RasterToPolyline_conversion(inRaster, TailingSpillPath, backgrVal, dangleTolerance, "SIMPLIFY", field)
StreamRaster = "Output-FlowAccumulation"
FlowDirectionRaster = "output-FlowDirection"
StreamorderMethod = "STRAHLER"
TSPStrahlerOrder = StreamOrder(StreamRaster, FlowDirectionRaster, StreamorderMethod)
TSPStrahlerOrder.save("C:\GIS-TSP Model\Data\Spill Path order. shp)

