


Services on Demand
Article
 English (pdf)
 Article in xml format
 Article references
Indicators

Related links
-
 Cited by Google
 -
 Similars in Google
Share

 Permalink
Journal of the Southern African Institute of Mining and Metallurgy
On-line version ISSN 2411-9717
Print version ISSN 2225-6253
J. S. Afr. Inst. Min. Metall. vol.120 n.5 Johannesburg May. 2020
http://dx.doi.org/10.17159/2411-9717/880/2020
PAPERS OF GENERAL INTREST
In-truck ore grade estimation using apparent density measurements
J. GirouxI; F-A. ConsuegraII; M. FillionII; G. FortinII; D. HorthII; D. Michaud
IRio Tinto Iron & Titanium (RTIT), Canada. Rio Tinto Fer & Titane, Canada
IICOREM, Canada
SYNOPSIS
The Rio Tinto Iron and Titanium (RTIT) Havre St-Pierre (HSP) mine located in Quebec, Canada has implemented a grade estimation system based on the determination of the apparent density of the material loaded into mine trucks. The system is used to segregate economic ore from waste as part of the re-handling of a historical waste stockpile. The system takes advantage of the strong relationship established between ore density and grade for the HSP mineralization. The apparent density is derived from the measurements of (i) the volume of the truck load using a laser-based scanner and (ii) the mass of the truck load provided by an onboard truck scale. The ore grade is then calculated by applying a void factor to the apparent density measurement. In the future, this in-truck grade estimation technology could be expanded to the entire mine operations and be instrumental in ore vs waste discrimination and production reconciliation.
Keywords: grade estimation, apparent density, laser scanning.
Introduction
Rio Tinto Fer et Titane (RTFT) operates an open pit haemo-ilmenite mine located at Havre St-Pierre (HSP) in the province of Quebec, Canada. The mine supplies the RTFT smelter located in Sorel, Quebec, some 800 km upstream on the St Lawrence River. Processing activity at the HSP mine is limited to crushing of the ore to minus 3 inches (-7.62 cm). Since 2017, due to a change in the legislation relating to waste disposal, the HSP mine has had to re-handle a historical waste rock pile (WRP) totalling 25 Mt, named Petitpas (PTP). An opportunity has been identified to valorize part of the PTP WRP, estimated at approximately 20%, by mixing the higher-grade material extracted from the WRP with the regular output from the mine.
Some means of evaluating the ore grade from the WRP was needed in order to ensure the proper blending ratio of this material with the run-of-mine ore. Published accounts of prompt measurement or estimation of ore grade very early in the mining process are scarce. An approach using RFID tags to trace ore movement on conveyors in underground mines was attempted at Vale Inco (Fiscor, 2007) and at KGHM (Bardzinski et al., 2020). This approach, however, relies on modelling qualitative data (ore source and type, RFID timestamps, etc.) in an integrated flow pattern leading to the estimation of ore quality loaded in train bins and does not provide a specific evaluation of a given ore load or sample. Direct in-field ore grade estimations was what was precisely sought for in the present case. Thus, initially, few on-site methods were available to attain this objective. Firstly, periodic geophysical mapping of the WRP benches could be carried out to qualitatively delineate the grade distribution prior to excavating the material. This technique, however, is limited to a depth of 5 m. Secondly, a close visual inspection of the WRP excavation face could be performed by the mine geologist. Both methods, however, are of a qualitative nature only and thus subject to potential uncertainties. Hence it soon appeared that a more quantitative method was needed. Through collaborative research an in-truck ore grade estimation system was recently implemented (late 2018). This system is used to provide a quantitative assessment of the PTP WRP material loaded in a truck; from this information, a decision can be made whether to route the payload to the crusher for valorization or to an alternative WRP as final waste. In this paper we describe the in-truck grade estimation system covering the following aspects: theory and model development, experimental procedure, trial run results, and the next steps and potential future applications.
Background - theory and model development
The characteristics of the HSP mine ore are described in Charlier et al. (2010). From a practical point of view, particularly in the day-to-day operation of the mine, the ore can be considered as a binary matrix with end components haemo-ilmenite and anorthosite (Guéguin and Cardarelli, 2007). Hence, the material loaded in a truck bin can be viewed as a weighted mixture of the two end components. Throughout the mine, the composition of the end components varies only slightly and it is thus possible to attribute an average density of 4.81 to haemo-ilmenite and 2.79 to anorthosite. Given the large density difference between the end components, there is a very good correlation between the grade and the density of the ore. Figure 1 illustrates the relationship between ore grade and density.
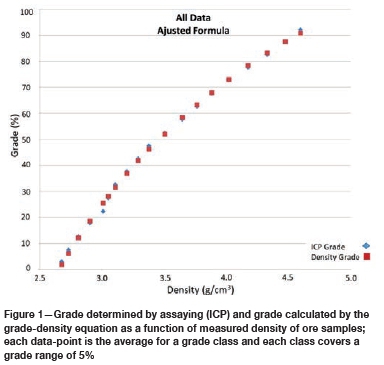
The assumption of constant density for the end components allows the density of a blend to be derived from first principles as follows:

where D is the density of the blend and G is the haemo-ilmenite grade (on a weight basis; in practice, grade is computed from iron and titanium assays).
Solving for grade yields the basic grade-density equation as follows:

where A and B are constants.
On theoretical grounds, A and B are functions of the densities of the two end components. In practice, the constants were rather fitted to experimental data (Bourque, 2015); more than 10 000 samples were used for this purpose.
The in-truck ore grade estimation system measures the apparent density (Da) of a payload. The volume occupied by the material loaded in the truck bin is measured by a laser-based 3D scanner and the mass by an onboard weight scale. In order to obtain the density of the broken ore from the apparent density, a void factor (f) has to be applied. Given that the size range of the blasted ore can vary widely (typically from fines up to 1.5 m diameter rocks), trying to estimate the void factor directly on the load appeared difficult at start. It was deemed more reliable to sample and assay the ore load and subsequently back-calculate a corresponding ore density using the grade-density equation; having previously measured the corresponding apparent density in the truck bin, the void factor could then be calculated as follows:
Through a calibration run with multiple samples, an average void factor was subsequently set for general application.
Experimental
Hardware
HSP mine's truck fleet comprises Caterpillar models 777D and 777F, nominally rated for payloads up to 100 t. The truck bins were specially designed and fabricated by Maxter (Montreal) and a Hardox liner was welded by the mine's workshop to cover all internal faces. Excluding the canopy over the driver hub, the truck bins measure 6.5 m in length by 4.8 m in width (internal dimensions).
The Truck Payload Measurement system (TPMS) developed by Caterpillar is used to determine the weight of a truck's payload (Caterpillar, 2016). The TPMS measures the change in pressure in the four suspension cylinders as the truck is being loaded. The pressure difference is interpreted as additional mass according to a pre-established pressure-mass relationship. Upon completing the loading of the truck bin, the truck status is set to « Loaded » and the mass is then recorded. The TPMS is deemed accurate to ±5% on 95% of payloads under normal operating conditions.
The 3D scanner selected is the Load Volume Scanner (LVS) from Loadscan, New Zealand (Loadscan, 2019); an automated three-way adjustable mounting bracket was also purchased from Loadscan. The system uses ID tags to identify individual trucks. Each truck equipped with an ID tag is first scanned empty to store the 'empty' reference; subsequently, when a truck passes under the LVS, the ID tag is detected and a scan is launched automatically. Measurement specifications are ±0.1 m3 for loads up to 130 m3; in the present case, loads were on the order of 40 m3.
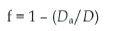
A supporting structure was tailor-made to hold the LVS head and controller (see Figure 2). The LVS head comprises two cameras (one longitudinal and one lateral) and is fixed on an extension arm, some 10 m above ground with a lateral offset of 5 m. The extension arm is articulated in its middle so that the upper branch can be lowered, thereby allowing the cameras to be serviced easily. The base of the extension arm is fixed on a platform that also holds a cabin to house the control system. This system includes a dedicated computer for autonomously controlling the LVS; the computer can be interrogated through a wi-fi connection and the whole system can be remotely controlled. The cabin has temperature and humidity controls built in and is powered by a gas generator. The platform is 7.6 m long by 3.6 m wide and is fitted with skids that allow the system to be towed to location in the mine.
A driveway was delineated with concrete blocks to properly guide the trucks under the LVS head. Driving requirements concerning speed and trajectory have been instituted to ensure that good measurements can be recorded by the scanner. The driveway must be maintained clear of mud, snow, or other debris that could affect the area scanned by the LVS.
Trial run set-up
The trial run was held in June 2018 and comprised two types of tests: a calibration run and reproducibility tests.
The calibration procedure required the procurement of material beforehand in five nominal grades: 10%, 30%, 50%, 70%, and 90%; these materials were identified and localized throughout the mine from geophysical data and visual observations. For each nominal grade, some 500 t (or five truck payloads) were stacked nearby the LVS system. All five trucks were to pass under the scanner and the payloads subsequently dumped in succession in the crushing circuit's dumping bin. Crushing reduced the material to a size of less than 3 inches (7.62 cm) in diameter. On exiting the crushing zone, a means of dynamically sampling the crushed material was available. Trucks no. 1 and 5 were considered as transition (or isolating) loads. Trucks no. 2, 3, and 4 were sampled by scraping some 4-5 t of material off the conveyor. The top of the heap was pushed aside and some 400 kg of material were then shovelled to fill a drum (one drum per truck); these drums of sampled material were submitted to a laboratory for assaying. To minimize intermixing of payloads, a means of managing the flow of material was applied in the dumping bin; this was done using a backhoe to push the material towards the crusher's entrance door between each truck unloading.
Reproducibility tests were conducted in the following manner. Firstly, a truck was loaded with ore and this load was passed five times under the scanner head. The load was then dumped on the ground, reloaded in the same truck and passed under the scanner again. Dumping was executed on a solid, flat and clean area near a solid wall; reloading was done using a bucket loader by pushing the material against the wall in order to load the very same material as best as possible. This reloading process was repeated four times. Both types of tests (repetition and reloading) were performed first with sterile material and then with rich ore.
Following the trial run, some mechanical adjustments were made on the trucks and on the ground set-up and a running-in period took place during the fall of 2018.
System operation and communication interface
Prior to the implementation of the in-truck grade estimator, a locally-developed fleet management system, called TioGo, was deployed at the mine. TioGo manages, in real time, the flow of information (inputs and outputs) between the user module (in the trucks) and the mine's dispatch centre, for example. The system connects to the truck's electronic control module (ECM) and can read the truck's payload mass in real time.
TioGo is equipped with GPS capability and wi-fi connectivity. The application keeps track of all trucks (and other equipment as well) by geolocalization inside the mine area. The mine survey team initially defined zones inside the mine using AutoCAD; these zones are automatically synchronized by wi-fi with the trucks. Zones can be modified and new ones can be defined as needed; a specific LVS zone was thus set to cover the vicinity of the scanner. TioGo detects trucks entering or exiting zones according to their GPS-reported position, with a resolution of 1 m.
Taking advantage of the TioGo system, the in-truck grade estimation system was thus put under TioGo control. Loadscan was requested to modify the LVS control application so that the status of the device could be accessed through the mine's wi-fi network. As soon as a truck enters the LVS zone, TioGo communicates directly with the 3D scanner by wi-fi in a 'peer-to-peer' mode. The status of the scanner is displayed on the truck's screen inside the driver's cabin throughout the scanning sequence. A few seconds after a successful scanning sequence, TioGo computes the ore grade based on the mass and volume readings. This grade value is displayed on the truck screen along with an indication whether the payload is waste or valuable ore (item 3 in Figure 3). In the event of a problem during the reading sequence, the truck operator is sent an error message indicating the origin of the problem (speed, course, mismatch, obstruction, etc.).
The application allows adjusting of the cut-off grade between waste and ore and modifying at will the parameters in the ore grade equation (such as the void factor). All readings and parameters are archived and eventual changes are synchronized automatically; parameter changes can be retrofitted to any selected and valid time window. The LVS data is synchronized with the data server and all information is accessible from any corporate workstation.
The TioGo screen at the mine's dispatch centre displays the LVS status in real time. Hence, the dispatch operator continually knows if the scanner is ready and operational even before routing an ore truck for some duty in the mine. Reading errors for each truck and each driver are also displayed; this can be very useful for diagnostics and allows live retroaction with the drivers.
Figure 3 illustrates the process under TioGo control. Trucks are identified by number and their positions in the mine are known at all times. The origin and destination of payloads are recorded, the latter being determined according to the grade estimation issued by the control system.
Results and discussion
Repeated measurements results
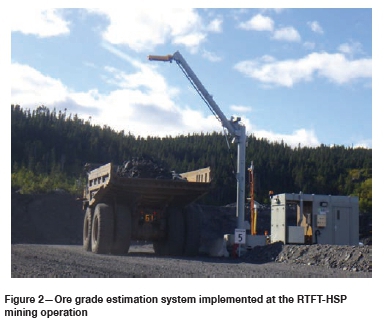
The results for the test comprising repetitive measurements of the same truck payload are shown in Table I. Standard deviation figures for mass are zero by design due to locking of the onboard mass record after the first reading. In the case of rich ore, the standard deviation on volume was equal to the resolution of the instrument. For sterile material, the superior standard deviation on volume can potentially be related to the coarser size of this material. In fact, the successive volume readings decreased quite consistently by about 0.1 m3 throughout the five passes under the scanner. There is a historical and definite trend towards finer blasting of material of increasing grade at this mine. It is hypothesized that coarser material will initially pack into less stable heaps in the truck bin and some settling of material is thus likely to occur during transportation.
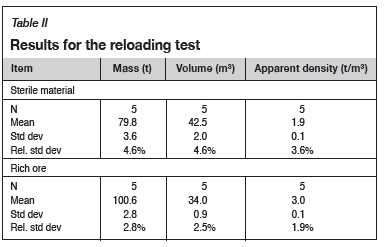
Reloading results
The results for the reloading test are shown in Table II. The values reported indicate higher standard deviations on both measured variables (mass and volume). This was to be expected with this kind of test, inasmuch as it could not be assured that the exact mass could be picked up anew after dumping the load. Indeed, at each iteration of the test, underlying ground could be scraped off and added to the payload or, conversely, some ore material could be left on the ground. Hence the scope of this test, although of interest, is more of a qualitative nature. Nevertheless, it is again seen here that the results for rich ore are better than for the sterile material. The larger standard variation observed for anorthosite may be due to its greater hardness compared to haemo-ilmenite - which in effect is very friable - thus leading to a coarser size with potentially greater associated variability in the void factor.
Calibration results
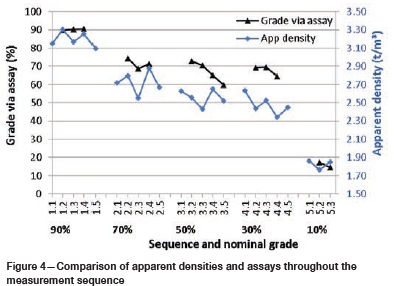
A total of 23 truck payloads were passed under the scanner, 15 of which were sampled for assaying. Figure 4 shows the results obtained in sequence, wherein the apparent density computed from the load data is compared to the assayed grade of the corresponding load. A clear relationship can be seen between these variables, and the correlation (R2) was calculated at 0.84. It can be observed that the nominal grades of 50% and 30% differ more significantly from the corresponding assays; this testifies to the difficulty of estimating the bulk grade by eye.
From the discrete apparent densities measured, a void factor could be calculated for each of the 15 payloads for which assays were available. The average void factor was 0.33. Applying this overall average in the grade equation led to estimated grades from apparent density as shown in Figure 5 (black dots and black interpolation line). The computed R2 in this case is 0.93 and the mean error on grades compared to the assays was then ±8.1% (absolute).
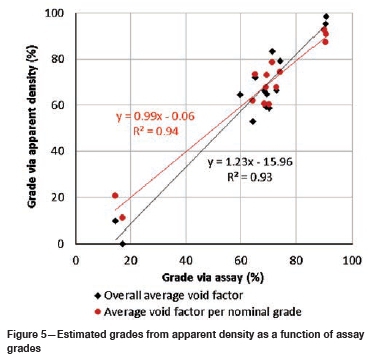
It was observed that the void factor varied as a function of grade; namely, the void fraction increased from approximately 0.28 to 0.36 over the range of grades assayed (from 10% to 90%). This is a trend that was hypothesized beforehand on the basis of the varying size of the fractured material according to grade; indeed, poorer ore resulting in coarser-blasted loose material is likely to pile up with greater voids. Calculating an average void factor for each nominal grade material tested led to improved estimated grades, as can be seen in Figure 5 (red dots and red interpolation line). In this manner, although the R2 barely improved (0.94), the slope of the interpolation line became essentially unity and the ordinate quasi-null. The mean error on grades estimated in this way relative to the assayed grades reduced to ±4.7% (absolute).
Running-in results
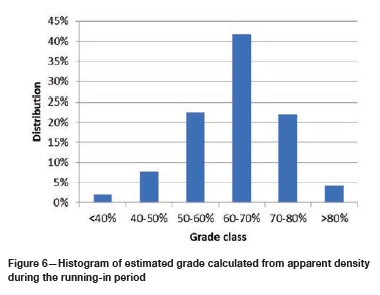
During the running-in period, a total of 619 valid readings were recorded by the in-truck grade estimation system. The histogram of recorded grades appears in Figure 6. The range of grades covered from 12% to 91%, with an average of 63.5% and a standard deviation of ±10.7%. These figures were in line with those forecast by the production department of the mine. The running-in period, however, revealed a high number of invalid readings (resulting in no data being recorded), amounting to some 40% of the truck passes under the scanner. The great majority of these failures (over 90%) could be attributed to driving errors: too fast, uneven speed, off centre, etc. A recommendation was issued to narrow the driveway to a minimum and driver instructions were stressed in order to correct the situation.
Discussion
The results of the trial tests demonstrated the applicability of the method to estimate the grade of material (waste and ore) loaded in a truck. The implementation involved setting up a measurement station where the trucks pass under the 3D scanner and building a structure to support the scanner. Instrumental to the success of the system is the control program (TioGo application) allowing tracking of each truck via the exchange and recording of data concerning its location, including its origin, actual position and destination, its onboard mass and volume, etc.
The forecast uncertainty on grade estimations was initially set at ±10%. This was a level judged 'workable' in view of the objectives pursued by the production team at the mine. The ±8% obtained in the calibration run (when applying an overall average void factor) is thus in line with this objective. The number of data-points collected (15) remains somewhat low in terms of statistical significance. Adding new data-points in future and potentially recurrent calibration runs would allow the method to be improved and strengthened.
An important issue, calibration-wise, and particularly at this scale, is ensuring the representativeness of the sample taken for each truck payload. This implies managing the flow of material in the dumping bin in order to minimize intermixing of material from consecutive payloads; however, means to do so are limited by structural and operational constraints. Thorough modification of the dumping bin not being an option in the short term, physically manipulating the material to free the 'dead' zones in the bin, for example, becomes an important factor. Furthermore, safety considerations adopted at the mine (some of which are under automatic control) prohibit letting the dumping bin run dry while the crusher circuit is operating. The measures applied in the trial run turned out to be adequate, but there still remains room for refining the practice.
The void factor of the material as loaded in the trucks is a paramount variable in the calculation of the grade. It can vary from load to load on account of natural (statistical) variability. In addition, environmental conditions such as the moisture content of the material can influence the void factor. Moisture particularly influences pile-up of fine grains (say less than a few millimetres in size), but for coarse-blasted material it is expected to be of minimal to negligible importance. The scanner selected in the present implementation does not have the ability to determine the size distribution of the loaded material. However, image analysis systems for this purpose do exist on the market; adding this capability to the instrument could prove helpful in the future.
The existence of a relationship whereby void factor varies with grade of material can offer an interesting second-order refinement. As shown in this work, a rough estimation of void factor as a function of grade can significantly improve the accuracy of the grade estimation. While expected and observed in this work, the relationship needs more data (via a specific investigation for example) to more firmly set the grade-void factor model specific to this mine.
Finally, the system relies on the accuracy of the truck weight scale and the 3D laser scanner. Default factory settings and calibration methods are currently used for both devices, but means of providing mass and volume standards at the 100 t scale are being sought.
Future applications
The in-truck grade estimation system is currently utilized to valorize material from a waste rock pile, the objective being to maximize the recovery of high-grade material therein and ensure appropriate blending of this material with run-of-mine ore to meet the smelter grade requirement. The methodology described in this paper allowed testing to confirm the applicability of the in-truck grade estimation system. Extending the deployment of
this system to the whole mining operation would be beneficial in allowing monitoring of the waste and ore from the current mine production. In particular, this would help in stabilizing the feed grade to the beneficiation circuit and, in turn, in ensuring optimal metallurgical performance at the Sorel smelter.
Currently, there is little data available pertaining to the grade of the waste material. The in-truck grade estimation system could bridge this knowledge gap and contribute to maximizing value recovery from higher-grade waste as well as improving the waste and ore reconciliation process.
The in-truck grade estimation system could also be implemented in support of an eventual preconcentration process whereby below cut-off grade material (say in a window from 55% to 72% grade) could be upgraded to 80% grade or better. The system would direct ore trucks to either the crusher, for direct shipping to the Sorel smelter, to the preconcentrator for upgrading, or else to the waste deposit according to estimated grade. Should a preconcentration circuit be implemented only at some distant date, for example towards the end of the life of the mine, the 55-72% grade material could be stocked in a designated pile for future processing.
Conclusion
A system for estimating the grade of onboard material in a mine truck was implemented at RTFT's haemo-ilmenite mine in Havre-Saint-Pierre, Quebec. The initial objective was to monitor the grade of waste material re-handled to recover residual value. The estimation is based on the relationship between grade and density and, by extension, apparent density, the latter being computed from onboard mass and volume measurements. The calibration carried out on site indicates a mean error of the order of ±8% on grade, with potential to significantly lower this figure by applying an effective grade vs void factor relationship. The system allows sorting out of under-grade material as final waste and optimally blending the recovered values with the ore from the mine for treatment in the beneficiation and smelting circuits. Extending the use of the system to the entire extraction operation in the mine is envisaged in the foreseeable future.
References
Bardzinski, P., Jurdziak, L., Kawalec, W., and Kro, R. 2020. Copper ore quality tracking in a belt conveyor system using simulation tools. Natural Resources Research, vol. 29, no. 2. pp. 1031-1040. [ Links ]
Bourque, Y. 2015. Density vs grade relationship. Internal report, Rio Tinto Fer et Titane, Sorel-Tracy, Quebec. [ Links ]
Caterpillar. 2016. TPMS (payload) system CAT 777D (2016). https://www.academia.edu/19668809/TPMS_Payload_System_CAT_777D [ Links ]
Charlier, B., Namur, O., Malpas, S., de Marneffe, C., Duchesne, J-C., Auwera, J.V., and Bolle, O. 2010. Origin of the giant Allard Lake ilmenite ore deposit (Canada) by fractional crystallization, multiple magma pulses and mixing. Lithos, vol. 117, no. 1-4. pp. 119-134. [ Links ]
Guéguin, M. and Cardarelli, F. 2007. Chemistry and mineralogy of titania-rich slags. Part 1-hemo-ilmenite, sulphate, and upgraded titania slags. Mineral Processing and Extractive Metallurgy Review, vol. 28, no. 1. pp. 1-58. [ Links ]
Fiscor, S. 2007. Vale Inco tracks ore with RFID tags. Engineering and Mining Journal, vol. 208, no. 10. pp. 52. [ Links ]
Loadscan. 2019. Load management system. Hamilton, New Zealand. [ Links ]
 Correspondence:
J. Giroux
Email: jean.giroux@riotinto.com
Received: 15 Aug. 2019
Revised: 11 May 2020
Accepted: 12 May 2020
Published: May 2020

