


Services on Demand
Article
 English (pdf)
 Article in xml format
 Article references
Indicators

Related links
-
 Cited by Google
 -
 Similars in Google
Share

 Permalink
Journal of the Southern African Institute of Mining and Metallurgy
On-line version ISSN 2411-9717
Print version ISSN 2225-6253
J. S. Afr. Inst. Min. Metall. vol.120 n.4 Johannesburg Apr. 2020
http://dx.doi.org/10.17159/2411-9717/938/2020
ARTICLES
Monitoring the development of artisanal mines in South Africa
P. Mhangara; L.T. Tsoeleng; W. Mapurisa
South African National Space Agency, Earth Observation Directorate, Pretoria, South Africa
SYNOPSIS
Artisanal and small-scale mining (ASM) activities have risen significantly in sub-Saharan Africa and other developing regions. ASM is increasingly being recognized as a viable pathway for sustainable livelihood building and poverty alleviation. Lack of information regarding the spatial distribution of artisanal mines and their growth over time has created significant gaps in terms of awareness in the affected communities. The systematic documentation of ASM mining is often made challenging by the seasonality and nomadic nature of these rudimentary operations. In this study, we aimed to quantify changes in vegetation cover, bare soil, and mined open pits from 2014 to 2018 due to the impacts of ASM using SPOT 6 satellite imagery. With Prieska, South Africa as a case study, morphological classification was used to delineate mined open pits and the Spectral Angle Mapper to map the changes in vegetation and bare soil. The results show a progressive increase in areas being mined for the semiprecious stone tiger's eye from 2014 to 2018. High classification accuracies of above 92% in mapping were achieved to identify artisanal open pits using morphological profiles, and classification accuracies of above 80% for mapping vegetated areas and bare areas using Spectral Angle Mapper. The results of this study also show the continuous decrease of vegetated areas and expansion of bare soil surfaces from 2014 to 2018, making the areas more vulnerable to land degradation, particularly soil erosion.
Keywords: artisanal and small-scale mining, ASM, mapping, morphological profile, Spectral Angle Mapper, remote sensing.
Introduction
The recent proliferation of illegal artisanal and small-scale mining (ASM) operations in sub-Saharan Africa and other parts of the world has attracted significant research attention globally, due to the inherent socio-economic imperatives and concomitant environmental impacts (Banchirigah, 2006; Edwards et al., 2014; Hilson and McQuilken, 2014; Siegel and Veiga, 2010; Thornton, 2014). While ASM dates back to the Stone Age, the growing concerns over ASM activities emanate largely from a regulatory, safety, health, labour, socio-economic, and environmental perspective (Hermanus, 2007; Maconachie, 2009; Maconachie and Hilson, 2011; McLoughlin and Chirico, 2013; Siegel and Veiga, 2010). The growth of ASM over the last few decades necessitates an understanding of this sector in terms of spatial distribution and evolution over time. There is growing reliance on ASM in most marginalized communities of sub-Saharan Africa and South America (Hilson, 2009; Lobo et al., 2015; Spiegel et al., 2012). It is estimated that at least 20 million people are involved in ASM globally (McLoughlin and Chirico, 2013) and this number seems to be on an upward trajectory. The systematic documentation of ASM is often challenging due to the seasonal and nomadic nature of these rudimentary operations (McLoughlin and Chirico, 2013). The illicit nature of most artisanal mining operations and the volatile prices for mineral commodities make ASM patterns and trends unpredictable. In recent years, artisanal mining and small-scale mining have become recognized as viable pathways for sustainable livelihoods and poverty alleviation (Hilson 2009; Hilson 2002; Spiegel et al., 2012).
In South Africa, the ASM sector officially gained legal recognition in 1994 and is governed by a series of mining, environmental, and safety legislative and policy prescripts (Mutemeri and Petersen, 2002; Ledwaba and Mutemeri, 2018). Legal ASM activities are regulated through the Mineral and Petroleum Resources Development Amendment Act (MPRDA), No. 49 of 2008 (Ledwaba and Nhlengetwa, 2016). The MPRDA was largely crafted to ensure equitable access to minerals, promote sustainable development, and to expand mining opportunities to previously disadvantaged persons as part of South Africa's transformation agenda (Mutemeri and Petersen, 2002; Ledwaba and Mutemeri, 2018). The 1998 White Paper on Minerals and Mining Policy of South Africa recognizes the role ASM plays in economic development. The legal framework regulating ASM in South Africa has mainly been adopted from large-scale mining. (Ledwaba, 2017; Mutemeri et al., 2016). Progress in the ASM sector has largely been constrained by the bureaucracy involved in the provision of mining permits (Ledwaba, 2017). The constraints in obtaining mining permits have given rise to a significant proportion of informal and illegal ASM activities in South Africa that operate without mining licenses and do not adhere to any mining, environmental, and safety regulations and laws (Ledwaba and Nhlengetwa, 2016). Illegal ASM has poor access to markets and is often associated with criminal syndicates. In contrast to legal ASM, which contributes revenue and foreign currency to the formal economy, illegal ASM is linked to the illicit trade in minerals and gemstones on the black market, smuggling, and money laundering (Mkhize, 2017). Legal ASM is considered as a viable means of reducing unemployment and provides business opportunities to previously disadvantaged persons (Ledwaba, 2014; Mutemeri, Sellick, and Mtegha, 2010). In recent times there have been calls to formalize ASM in South Africa and to remove bottlenecks in the issuing of mining permits.
Lack of information regarding the spatial distribution of artisanal mines and their growth over time has created significant gaps in terms of baseline demographics and spatial awareness in the affected communities (Hilson and McQuilken, 2014). ASM is a primitive and labour-intensive form of subsistence mining done by individuals and groups with rudimentary tools (Seccatore et al., 2014). Some common minerals mined at an ASM level include gold, diamonds, platinum group metal, gemstones, clay, sandstone, and coal using open pit, alluvial, and underground mining methods. In recent years, artisanal miners have been increasingly exploiting derelict underground mines and recovering residual minerals from mine dumps. In most instances, artisanal miners lack safety apparel and equipment, exposing themselves to a wide range of safety and health risks. In most parts of Africa, artisanal mining is largely informal and unregulated and faces financial, legal, trade, and technological challenges.
Although artisanal mining plays a significant economic role in poverty alleviation in marginalized communities around the globe, it is known to have more detrimental environmental impacts than mechanized mining (Telmer and Stapper, 2007). Considerable environmental damage is inflicted to sensitive ecological zones, biodiversity, and the general physical environment during the mineral exploration, exploitation, and processing, and closure stages of the artisanal mining life-cycle. Some common environmental problems induced by artisanal mining include deforestation, land degradation due to soil erosion, river siltation, solid waste disposal, landscape impairment, water pollution, acid drainage, and mercury and cyanide contamination (Elmes et al., 2014; Isidro et al., 2017; Lobo, Costa, and Novo, 2015). Air pollution due to dust and smoke from cooking fires is a common problems. Dust poses a health risk, and cases of tiger's-eye pneumoconiosis have been recorded in South Africa (White, Chetty, and Bateman, 1991). Using satellite imagery covering a 40-year period, Lobo et al. (2016) demonstrated the impact of ASM on river siltation. The impacts of artisanal mining activities are known to infringe the legislation that seeks to protect, conserve, and govern the environment in most countries. In South Africa, mining activities are regulated by a battery of environmental legislative prescripts that include the National Environmental Management Act (NEMA, Act 107 of 1998), National Water Act (NWA, Act 36 of 1998), National Environmental Management: Air Quality Act (NEM: AQA, Act 39 of 2004) and the environmental impact assessment (EIA) regulations. The recorded environmental impacts due to the intensification of artisanal mining activities in South Africa include contamination of drinking water in natural springs and rivers in Mpumalanga Province due to unregulated coal mining.
In South Africa, there is growing concern over artisanal mining (Mutemeri and Petersen, 2002; Thornton, 2014). There is an acknowledgement of the economic function that artisanal mining plays in poverty alleviation, particularly as regards the circular flow of income and its contribution to the mainstream economy. On the downside, the adverse aspects of artisanal mining have gained government and public attention due to increasing reports of environmental degradation, fatal accidents due to poor safety, poor hygiene, disease outbreaks, and other social tribulations such as crime (Edwards et al., 2014; Hermanus, 2007). In this context, there is a growing need to regularize artisanal mining to ensure it is well regulated as a formal mining activity. To achieve this, geographical information on the spatial distribution of artisanal miners and the changes over time is pertinent. Satellite-based remote sensing can play a pivotal role in providing critical geospatial information on the remote location of artisanal mines, and their growth over time (Lobo et al., 2016; Manu, Twumasi, and Coleman, 2004). Remote sensing is also a powerful tool for monitoring the environmental impact of artisanal mining over time.
Satellite images captured at medium and high spatial and spectral resolution can provide suitable visual and spatial information on surfac-related artisanal mining activities (Asner et al., 2013; Elmes et al., 2014; Lobo, Costa, and Novo., 2015). The advantages of satellite-based remote sensing include its ability to capture large swaths of land in areas that are often inaccessible and dangerous to reach. Systematic documentation of artisanal mining is often constrained by its short-term, diffuse, and unpredictable nature. Geospatial data derived from satellite imagery can provide accurate, reliable, and timely environmental information throughout the artisanal mining life-cycle to support enforcement of environmental regulations (Manu, Twumasi, and Coleman, 2004). Many remote sensing studies confirm that the surface imprints of artisanal mining such as open pits, mine dumps, dust pollution, footpaths, and informal settlements are discernible from high-resolution satellite imagery. Landsat 8 medium-resolution satellite imagery has also been used successfully to assess the environmental impacts of artisanal mining (Connette et al., 2016; Lobo, Costa, and Novo, 2015). Some common remote sensing techniques that have been used to map artisanal mining activities include unsupervised image classification techniques such as ISODATA classification and supervised classification techniques such as maximum likelihood classification.
The advent of satellite sensors with the high spatial, spectral, radiometric, and temporal resolution is increasingly making it feasible to capture and characterize small surface-based mining developments. This, coupled with the emergence of advanced land cover classification algorithms such as geographic-object-based image analysis (GEOBIA), Spectral Angle Mapper, Random-Forest Classifier, support vector machines (SVMs), decision trees, artificial neural networks, and morphological-based classifiers has potential to significantly improve the classification accuracies related to the mapping features linked to artisanal mining (Asner et al., 2013; Isidro et al., 2017; Connette et al., 2016; Lobo, Costa, and Novo, 2015; Manu, Twumasi, and Coleman, 2004). Very high spatial resolution Ikonos satellite imagery has been successfully used to identify artisanal diamond mining in Africa using object-oriented classification. Object-based change detection (OBCD) has been used to successfully map and monitor ASM sites in the Democratic Republic of Congo using optical very high-resolution data and generate digital surface models (DSMs) (Luethje, Kranz, and Schoepfer, 2014). The integrated use of high-resolution optical imagery, synthetic aperture radar( SAR) images, and DSMs has potential to accurately map artisanal mines and their changes over time (Kranz, Lang, and Schoepfer, 2017). Morphological image analysis techniques, generally referred to as mathematical morphology (MM), exploit spatial domain in images using various techniques. These techniques are developed based on concatenation of mathematical operations grounded in a set of operations such as union, intersection, complementation, and translation, and utilize set theory to estimate and measure useful geometrical features such as shape, size, and connectivity.
Spectral indices have been widely used for quantitatively and qualitatively monitoring ecosystem dynamics (Pettorelli et al., 2011; Verrelst et al, 2015; Wilson et al., 2016; Zargar et al., 2011). Vegetation indices have been utilized for assessing fractional vegetation cover, chlorophyll content, above-ground biomass, plant phenology, net primary productivity, leaf area index, and absorbed photosynthetically active radiation (Huete et al, 2010; Huete, 2012; Verrelst et al., 2015). Most vegetation indices utilize the red and near-infrared spectral bands to assess plant vigour. The accuracy of vegetation indices in ecological evaluations is affected by soil brightness, colour, and moisture, vegetation heterogeneity, and atmospheric effects.
Several studies point to the fact the most widely used vegetation index, the Normalized Difference Vegetation Index (NDVI), is affected by many environmental factors such as topography, bare soil conditions, atmospheric conditions, vegetation association, rainfall, and non-photosynthetic materials (Bannari, Morin, and Bonn., 1995; Huete, 2012; Qi et al., 1994; Verrelst et al,. 2015). Numerous vegetation indices have been develop over the last few decades to enhance vegetation response and curtail the effects of these environmental factors. To deal with these background influences a number of slope-based and distance-based vegetation indices have been developed. The Soil Adjusted Vegetation Index (SAVI) and Modified Soil Adjusted Vegetation Index (MSAVI) are aimed at correcting soil background brightness in varied vegetation cover environments (Qi, Kerr, and Chehbouni, 1994). The MSAVI and Transformed Soil Adjusted Vegetation Index (TSAVI) are particularly optimized for utility in semi-arid low vegetation density environments by minimizing the effects of background soil brightness.
Vegetation cover is an essential parameter for characterizing environmental impacts resulting from land disturbances due to artisanal mining (Lobo, Costa, and Novo, 2015; Schueler, Kuemmerie, and Schröder, 2011). Artisanal mining operations inevitably degrade areas in pristine condition. The unsystematic extraction of minerals is undertaken through clearance of the surface vegetation cover and excavation of soil surfaces. Lack of mechanization in ASM also leads to a network of footpaths around artisanal mines, leaving the land surface exposed and vulnerable to soil erosion. The anthropogenic disturbances due to artisanal mining and the subsequent transformations in land cover leave imprints that can be visibly detected by satellite imagery (Isidro et al., 2017).
Satellite imagery can provide consistent and accurate information regarding the proportions of vegetation and soil cover over time. The transformation of vegetated surfaces to bare soils is indicative of land degradation and increased human activity around artisanal mines. While remote sensing has been successfully used in mapping artisanal mining imprints, the spectral similarity of bare soil surfaces and excavated pits still remains a challenge, making the accurate mapping of artisanal open pits difficult. In this study, we used SPOT 6 satellite imagery to quantify changes in vegetation cover, bare soil, and mined open pits from 2014 to 2018 due to the impacts of artisanal mining. Using Prieska as a case study, we used morphological profiling to delineate mined open pits and the Spectral Angle Mapper to map the changes in vegetation and bare soil. The challenge in mapping excavated artisanal open pits using satellite imagery relates to the spectral confusion between open-pit mined-out areas and bare soils. In this study, we aim to bridge this gap by using a morphological profile technique to separately delineate artisanal open-pit mines. This contribution will be valuable in assessing the pattern, distribution, and growth of artisanal mines in areas of interest.
Study area
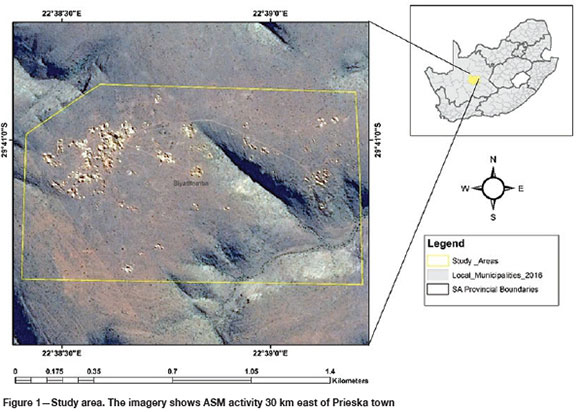
Priska is located in the Northern Cape Province in the western part of South Africa (Figure 1). The climate is arid, with a mean annual precipitation of about 244 mm. Most of the rainfall is received in summer and early autumn. Typical maximum day temperatures in summer are about 27-33°C, while average winter night temperatures are about 1°C. The region is predominately characterized by Nama Karoo biome vegetation, with low bushes of Karoo shrubland, and sparse grass and trees. The Nama Karoo biome is comprised of low dwarf shrubs intermixed with grasses, succulents, geophytes, and annual forbs growing on extensive plains (Mucina and Rutherford, 2006). Irrigated agriculture is predominant along the course of the Orange River and sheep grazing is common in the area. The surface topography of the study site is mountainous.
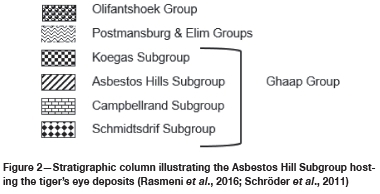
The tiger's eye deposits mined in the area are hosted in the Asbestos Hills Subgroup within the Ghaap Group, which is overlain by the Postmasburg and Elim groups, and Olifantshoek Group of the Transvaal Supergroup and underlain by the Schmidtsdrif and Campbell subgroups (Heaney and Fisher, 2003; Rasmeni et al., 2016; Schröder et al., 2011). The stratigraphy of the area is shown in Figure 2.
Tiger's eye is an attractive and popular semiprecious stone formed by the silicification of asbestos. The iron-bearing silicification leaves the fibrous appearance intact (Ledwaba, 2014). An attractive 'cat's-eye' effect is known as chatoyancy. The tiger's eye seams contain pockets of unsilicified crocidolite asbestos, which constitutes a health hazard to the miners. Three varieties of tiger's eye occur in the area, and these include blue tiger's eye (silicified crocidolite), yellow tiger's eye, and variegated tiger's eye (a mixture of yellow and blue tiger's eye) (Heaney and Fisher, 2003; Ledwaba, 2014; Qi, Kerr, and Chehbouni, 1994; Rasmeni et al., 2016).
Data-sets and data preparation
Orthorectified SPOT 6 data acquired by the South African National Space Agency (SANSA) was used to map out imprints induced by artisanal mining, including changes in vegetation, bare soil, and open pits. SPOT 6 has five spectral bands that are simultaneously captured, and these include blue (0.4500.520 μm), green (0.530-0.590 μm), red (0.625-0.695 μm), and near-infrared (0.760-0.890 μm) multispectral (MS) bands and a panchromatic band covering the 0.450-0.745 μm spectral region. With a swath of 60 km, the data is acquired at nadir at a ground sampling distance of 2.2 m for the panchromatic band and 8.8 m for multispectral bands. The panchromatic band is processed to a spatial resolution of 1.5 m and multispectral bands to 6 m, and the dynamic range is 12 bits per pixel at acquisition.
To ensure consistency and fair comparison of changes, atmospheric corrections were appliedto the multispectral SPOT 6 data-sets for 2014, 2016, and 2018. The Quick Atmospheric Correction (QUAC) atmospheric algorithm available in the ENVI software was used to implement atmospheric corrections before applying the Spectral Angle Mapper algorithm for classification. The QUAC algorithm was selected for atmospheric corrections due to simplicity of use compared to complex first-principles physical algorithms that require ancillary data. QUAC derives its atmospheric correction parameters directly from the scene reflectance spectra in the satellite image and is known to produce accurate results. The other benefits of using the QUAC method are that it is fast and accommodates a wide range of sensor viewing angles and solar elevation angles. A more elaborate description of the QUAC method is provided by Bernstein et al. (2012).
The Modified Intensity-Hue-Saturation (MIHS) pansharpening algorithm was used to fuse the low spatial resolution multispectral and the high-resolution panchromatic band to generate a high-resolution 1.5 m multispectral pansharpened (PS) image to enable identification of small artisanal open-pit features in the image. The MIHS pansharpening algorithm was selected due to its ability to ability to retain spectral content while providing good spatial enhancement (Rahmani et al., 2010; Sunuprapto, Danoedoro, and Ritohardoyo, 2016).
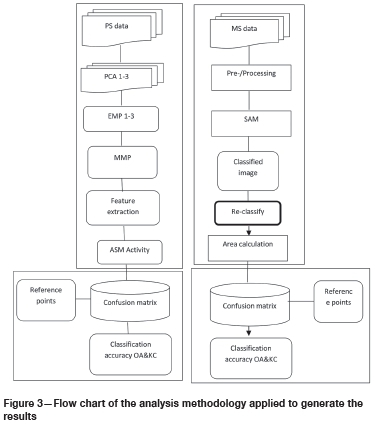
Classification methods
The classification methodology applied in this study is outlined in Figure 3. The Spectral Angle Mapper (SAM) classification method was used to map vegetated and bare areas. The SAM classification technique was chosen because it is relatively insensitive to the illumination and albedo effects common in rugged terrains that characterize our study area. SAM applies a deterministic similarity measure that uses an n-dimensional angle to compare pixels to reference spectra. The SAM method is defined as a common-distance metric that matches the unknown pixel spectrum to the reference spectra and classifies the end-member spectrum to the class with the smallest distance (Li, Ehsani., and Yang, 2012). The classification process involves matching of the end-member spectrum vector and each pixel vector in n-dimensional space, whereby smaller angles resemble better correspondence to the reference spectrum (Kruse et al., 1993).
The three classes of interest within the image are artisanal mines, bare areas, and vegetated areas. The artisanal mines and bare areas classes were merged into the bare area class. Equation [1] shows the formula for computing the spectral angle.
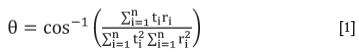
where 0 is the spectral angle, n the number of spectral bands, t the reflectance of the end-member spectrum, and r the reflectance of the reference spectrum.
The morphological profiles method was used to map open pits due to its ability to delineate edges effectively on high spatial resolution imagery. The images were analysed in a Matlab environment and the maps generated in ArcMap. The pansharpened imagery was transformed into three-component using principal component analysis. The first component PC1 was used because it contains 99% of the total variance of the data-set. Then the transformed imagery was processed using morphological filters, and opening and closing by reconstruction. Opening and closing by reconstruction were used to construct MPs. The use of a sequential combination of opening and closing suppresses narrow bright structures, and a combination of sequential closing and opening removes small darker structures in the scene. The morphological openings and closings by reconstruction were processed using a square structural element (SE) with a radius range from 2 to 9 with step 1 pixel. Increasing or changing the SE filter size also determines the extent of artisanal mining activity that is extracted; that is, features such as footpath and road networks created by miners. In this case, features such as footpaths and road networks were not extracted. The extended morphological profile (EMP) is based on the ordering of connected components that best represent an open-pit artisanal mine in the scene. By considering filters with these attributes the image was filtered according to the scale of the regions. The EMP transforms are based on the ordering of connected components that best represent each object in the scene. MMP was constructed based on the concatenation of various EMPs.
Validation data
The validation data-set was generated utilizing a random sampling method in a QGIS environment. Ideally, the training data should be collected at or near to the time of the satellite pass to accurately characterize the classes. It is often recommended that the training sample size for each class should not be less than 20-10 times the number of bands (Congalton and Green 2002; Foody and Atkinson 2003; Mather and Koch 2011). A total of 50 points were randomly generated for 2014, 2016, and 2018 for ASM activity validation and 2014, 2016, and 2018 for SAM results validation. For ASM activity the reference points were quantified from the panchromatic band using the same SPOT imagery used for the analysis. For SAM results the samples were verified through image interpretation using the Digital Globe Earth Watch system and Google Earth. The Digital Globe Earth Watch imagery acquired on 14 June 2018 was accessed through ArcMap to validate the 2018 analysis (Figure ). However, due to the unavailability of reference data for 2014 and 2016 from the Digital Globe Earth Watch system, Google Earth was used to validate the data-set for 2014 and 2018. The 2014 reference imagery was dated 18 August 2013 and for 2016 an imagery dated 14 of August 2017 was used.
Accuracy assessment
In order to validate the reliability of the SAM classification, and extracted ASM activity using MMP, automatically extracted ASM activity and visually quantified ASM activity areas for 2014, 2016, and 2019 were compared statistically. A similar approach was used for validation of SAM classification results; a statistical comparison between automatic SAM classification and visually collected points classified into bare land and vegetation. An error matrix was used to compare to the proportion of the extracted artisanal mines and other classes and the proportion of barren land and vegetated areas for 2014, 2016, and 2018. A confusion matrix was used to determine producers (PA), users, and overall accuracy (OA) of the extracted artisanal mines and SAM classification. Producers accuracy was acquired by diving the individual class classification accuracy. The accuracy was further assessed by calculating the kappa coefficients (k) between first classes of ASM activity (1) and other classes (0) for ASM feature extraction, and secondly for classes of barren land and vegetated areas (0). k is given by:
Results and discussion
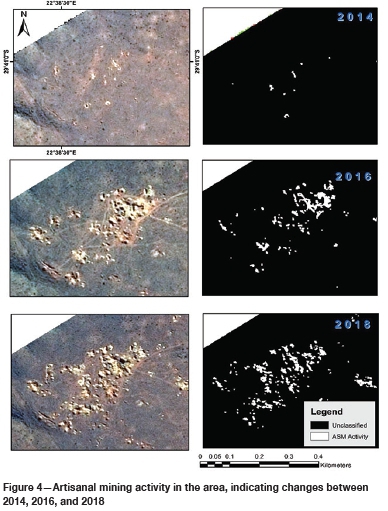
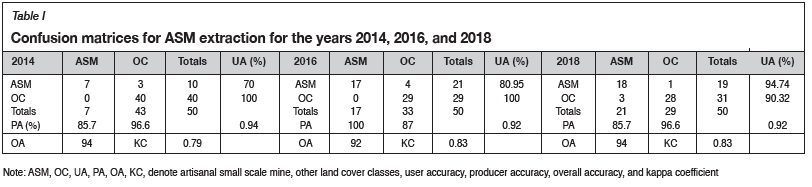
The area extracted due to artisanal mining being identified increased to 1.2 ha in 2016 from 0.2 ha in 2014, with a sharp rise to 3.2 ha in 2018. The artisanal mine class is extracted from the original panchromatic image, and is converted to a binary image where the black indicates the background and white indicates artisanal open pit mines (Figure 4). The morphological profiles techniques used to classify open-pit artisanal mines produced high accuracies of 94%, 92%, and 94% for 2014, 2016, and 2018 respectively, as shown in Table I. The success of the morphological profile could be attributed to its ability to isolate bright and dark structures in images, by exploring a range of different spatial domains as well as brightness and darkness contrast. This study exploited the brighter or darker features surrounding the open pit mines in the image to better map out such features. Elements such as image texture, shape, and edges play a critical role in the successful delineation of open pit mines.
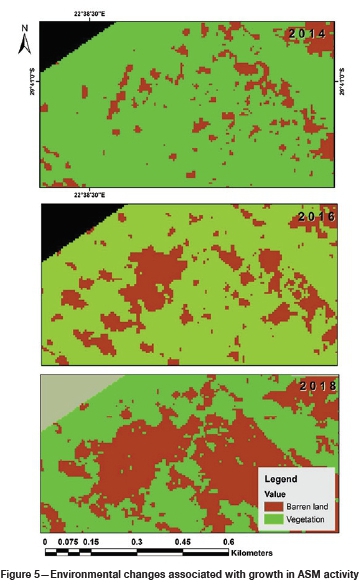
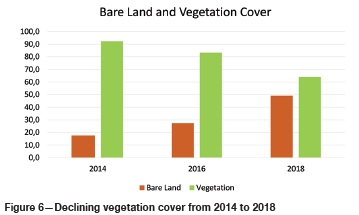
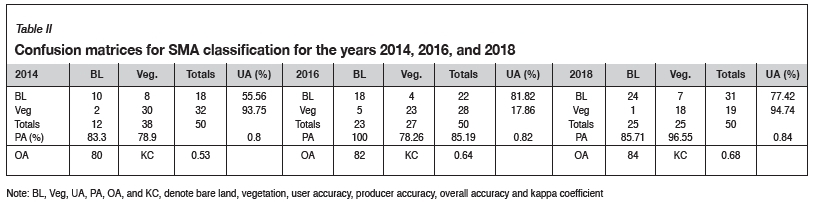
As shown in Figure 5 and Figure 6, the bare land increased from 17.5 ha in 2014 to 27.5 ha in 2016, and sharply to 49.1 ha in 2018. In contrast, vegetated areas decreased from 92.5 ha in 2014 to 83.3 ha in 2016, and to 63.8 ha in 2018. Accuracies of 80%, 82%, and 84% were achieved in the classification of bare areas and vegetated areas (Table II). The success of SAM could be attributed to its resilience to illumination conditions and soil brightness effects in semi-arid regions.
This study demonstrates the feasibility of using high-resolution satellite imagery to systematically map artisanal mines and assess their environmental impact over time. The unregulated and short-term nature of ASM activities often makes the systematic documentation of artisanal development life-cycle difficult (Isidro et al., 2017; Telmer and Stapper, 2007). The accurate assessment of environmental impacts of artisanal mining is impeded by the diffuse and remote locations of the mines. The use of SPOT 6 high-resolution satellite imagery demonstrated in this study eliminates these challenges that are inherent in traditional survey methods. The problems associated with the use of remote sensing in mapping ASM open pits are described by Isidro et al., (2017). The similarity in the spectral response of ASM open pits and other bare soil surfaces is one of the key challenges associated with the accurate mapping of small-scale mines (Elmes et al., 2014; Isidro et al., 2017). This problem was circumvented using morphological profiling based on reconstruction transformation to delineate open pits where artisanal mines are operating. The application of morphological techniques allowed us to separate bare soil surfaces that share similar spectral responses with excavated open pits, and accuracies of 92% and 94% were achieved, respectively (Table I). In this case, it was feasible to estimate the form, size, and distribution of open pit mines and their changes over time. The feasibility of using high-resolution SPOT and Pleiades-1A imagery for mapping ASM footprints has also been ascertained by Isidro et al. (2017) using an object-based support vector machine (OB-SVM) classifier, and attained classification accuracies of 87% and 89%. The successful use of the SAM to map vegetation cover changes was largely due to the fact that SMA is optimized to eliminate the impacts of soil brightness common in semi-arid areas, and is insensitive to variations in average brightness that arise from terrain and sensor gain effects.
The results of this study show the progressive decrease of vegetated areas and expansion of bare soil surfaces from 2014 to 2018. Declines in vegetation cover are a result of clearance to make way for ASM. This increases the area of exposed soil surfaces and makes the area more vulnerable to land degradation, particularly soil erosion. Lack of mechanization and motorized vehicles around the artisanal mines is also evidenced by the dense network of footpaths that are discernible from SPOT 6 imagery of the study area. The increase in the network of footpaths is indicative of increased pedestrian activity, which reduces the vegetation cover and increases the surface area of exposed soils. Footpaths are also known to accelerate soil erosion. The decrease in vegetation cover revealed in this study has the potential to threaten rare and endangered species. The results of this study also show the progressive increase in the number of open pits being mined for tiger's eye from 2014 to 2018. Our analysis indicates massive expansion of mined-out area from 2014 to 2018. This could be attributabed to the increase in the number of people resorting to ASM to sustain their livelihoods as a result of the high unemployment rate in South Africa (about 26-30%) and low economic growth rate. Reliance on ASM has also surged due to the favourable commodity prices for semiprecious stones.
Conclusions
This study demonstrates the feasibility of using satellite imagery to monitor illegal ASM activities in remote and rugged terrains that are difficult to access. Remote sensing provides a reliable and cost-effective way of detecting surface mining operations and reveals the adverse environmental impacts of ASM over time. In this study, we demonstrate the feasibility of mapping ASM open-pit mines using morphological profiles. The reliability of using the Spectral Angle Mapper techniques in mapping changes in bare land and vegetated areas in semi-arid regions has been illustrated. The results of this study reveal a progressive decline of vegetation cover and a significant expansion of exposed bare soil surfaces from 2014 to 2018. The decline in vegetation is attributable to vegetation clearance and extensive topsoil clearance to prepare the way for artisanal mining. Expansion of bare soil surfaces is also a result of increased human activity, resulting in extensive footpath networks. A reduction in vegetation cover threatens biodiversity and increases the vulnerability of the area to land degradation, particularly soil erosion. It is recommend that the government regularize illegal ASM in the affected areas and institute progressive rehabilitative programmes aimed mitigating the detrimental impacts of illegal mining on the environment and ensure recovery to pristine conditions after the cessation of mining activities.
References
Asner, G.P., Llactayo, W., Tupayachi, R., and Lunac, E.R. 2013. Elevated rates of gold mining in the Amazon revealed through high-resolution monitoring. Proceedings of the National Academy of Sciences, vol. 110, no. 46. pp. 18454-18459. [ Links ]
Banchirigah, S.M. 2006. How have reforms fuelled the expansion of artisanal mining? Evidence from sub-Saharan Africa. Resources Policy, vol. 31, no. 3. pp. 165-171. [ Links ]
Bannari, A., Morin, D., and Bonn, F. 1995. A review of vegetation indices. Remote Sensing Reviews, vol. 13, no. 1-2. https://doi.org/10.1080/02757259509532298 [ Links ]
Bernstein, L.S., Jin, X., Gregor, B., and Adler-Golden, s.M. 2012. Quick atmospheric correction code: algorithm description and recent upgrades. Optical Engineering, vol. 51, no. 11. 111719. https://doi.org/10.1117/1.OE.51.11.111719 [ Links ]
Congalton, R.G. and Green, K. 2002. Assessing the Accuracy of Remotely Sensed Data: Principles and Practices. CRC Press, Boca Raton, FL. [ Links ]
Edwards, D.P., Sloan, S., Weng, I., Dirks, P., Sayer, J., and Laurance, W.F. 2014. Mining and the African environment. Conservation Letters, vol. 7, no. 3. pp. 302-311. [ Links ]
Elmes, A., Ipanaqué, J.G.Y., RoGAN, J., Cuba, N., and Bebbington, A. 2014. Mapping licit and illicit mining activity in the Madre de Dios region of Peru. Remote Sensing Letters, vol. 5, no. 10. pp. 882-891. [ Links ]
Foody, G.M. and Atkinson, P.M. 2003. Uncertainty in Remote Sensing and GIS. Wiley. [ Links ]
Heaney, P.J. and Fisher, D.M. 2003. New interpretation of the origin of tiger's-eye. Geology, vol. 31, no. 4. pp. 323-326. [ Links ]
Hermanus, M. 2007. Occupational health and safety in mining-status, new developments, and concerns. Journal of the Southern African Institute of Mining and Metallurgy, vol. 107, no. 8. pp. 531-538. [ Links ]
Hilson, G. 2002. Small-scale mining and its socio-economic impact in developing countries. Natural Resources Forum, vol. 26, no. 1. pp. 3-13. [ Links ]
Hilson, G. 2009. Small-scale mining, poverty and economic development in sub-Saharan Africa: An overview. Resources Policy, vol. 34, no. 1-2. pp. 1-5. [ Links ]
Hilson, G. and McOuilken, J. 2014. Four decades of support for artisanal and small-scale mining in sub-Saharan Africa: a critical review. The Extractive Industries and Society, vol. 1, no. 1. pp. 104-118. [ Links ]
Huete, A., Didan, K., van Leeuwen., W.J.D., and Miura, T. 2010. MODIS vegetation indices. Land Remote Sensing and Global Environmental Change. Springer. pp. 579-602. doi: 10.1007/978-1-4419-6749-7_26 [ Links ]
Huete, A.R. 2012. Vegetation indices, remote sensing and forest monitoring. Geography Compass, vol. 6, no. 9. pp. 513-532. [ Links ]
Isidro, C., Lechner, a., McIntyre, N., and Callow, I. 2017. Applicability of earth observation for identifying small-scale mining footprints in a wet tropical region. Remote Sensing, vol. 9, no. 9. p. 945. [ Links ]
Kranz, O., Lang, S., and Schoepfer, E. 2017. 2.5 D change detection from satellite imagery to monitor small-scale mining activities in the Democratic Republic of the Congo. International Journal of Applied Earth Observation and Geoinformation, vol. 61. pp. 81-91. [ Links ]
Kruse, P.A., Lefkoff, A.B.,Boardman, J.W., Heidebrecht, K.B., Shapiro, A.T., Barloon, P.J., and Goetz, A.F.H 1993. The spectral image processing system (SIPS)-interactive visualization and analysis of imaging spectrometer data. Remote Sensing of Environment, vol. 44, no. 2-3. pp. 145-163. [ Links ]
Connette, L.K., Connette, G.M., Bernd, A., and Phyo, P. 2016. Assessment of mining extent and expansion in Myanmar based on freely-available satellite imagery. Remote Sensing, vol. 8, no. 11. p. 912. https://doi.org/10.3390/rs8110912 [ Links ]
Ledwaba, P. 2014. Tiger's eye in the Northern Cape Province - Potential for employment creation and poverty alleviation. Journal of the Southern African Institute of Mining and Metallurgy, vol. 114, no. 11. pp. 881-885. [ Links ]
Ledwaba, P.F. 2017. The status of artisanal and small-scale mining sector in South Africa: tracking progress. Journal of the Southern African Institute of Mining and Metallurgy, vol. 117, no. 1. pp. 33-40. [ Links ]
Ledwaba, P.F. and Mutemeri, N. 2018. Institutional gaps and challenges in artisanal and small-scale mining in South Africa. Resources Policy, vol. 56. pp. 141-148. [ Links ]
Ledwaba, P. and Nhlengetwa, K. 2016. When policy is not enough: prospects and challenges of artisanal and small-scale mining in South Africa. Journal of Sustainable Development Law and Policy, vol. 7, no. 1. pp. 25-42. [ Links ]
Li, H., Ehsani., R., and Yang, C-Y. 2012. Spectral angle mapper (SAM) based citrus greening disease detection using airborne hyperspectral imaging. Proceedings of the 11th International Conference on Precision Agriculture. Monticello,IL. International Society of Precision Agriculture. https://www.semanticscholar.org/paper/SPECTRAL-ANGLE-MAPPER-(-SAM-)-BASED-CITRUS-GREENING-Li-Ehsani/86a35265bfc215fd2c2d9d3340d25c454622c0fd [ Links ]
Lobo, f., Costa, M., de Moraes Novo, E.M.L., and Telmer, K. 2016. Distribution of artisanal and small-scale gold mining in the Tapajós River Basin (Brazilian Amazon) over the past 40 years and relationship with water siltation. Remote Sensing, vol. 8, no. 7. p. 579. https://doi.org/10.3390/rs8070579 [ Links ]
Lobo, F.L., Costa, M.P., and Novo, E.M. 2015. Time-series analysis of Landsat-MSS/TM/OLI images over Amazonian waters impacted by gold mining activities. Remote Sensing of Environment, vol. 157. pp. 170-184. [ Links ]
Luethje, F., Kranz, O., and Schoepfer, E. 2014. Geographic object-based image analysis using optical satellite imagery and GIS data for the detection of mining sites in the Democratic Republic of the Congo. Remote Sensing, vol. 6, no. 7. pp. 6636-6661. [ Links ]
Maconachie, R. 2009. Diamonds, governance and local development in post-conflict Sierra Leone: Lessons for artisanal and small-scale mining in sub-Saharan Africa? Resources Policy, vol. 34, no. 1-2. pp. 71-79. [ Links ]
Maconachie, R. and Hilson, G. 2011. Safeguarding livelihoods or exacerbating poverty? Artisanal mining and formalization in West Africa. Natural Resources Forum, vol. 35, no. 4. pp. 293-303. https://doi.org/10.1111/j.1477-8947.2011.01407.x [ Links ]
Mahumapelo, N. and Magaseng, C. 2014. Beneficiation of marble from Griekwastad, Northern Cape Province. Journal of the Southern African Institute of Mining and Metallurgy, vol. 114, no. 11. pp. 951-955. [ Links ]
Manu, A., Twumasi, Y.A., and Coleman, T.L 2004. Application of remote sensing and GIS technologies to assess the impact of surface mining at Tarkwa, Ghana. IGARSS2004. Proceedings of the 2004 IEEE International Geoscience and Remote Sensing Symposium. IEEE, New York. doi: 10.1109/IGARSS.2004.1369091 [ Links ]
Mather, P.M. and Koch, M. 2011. Computer Processing of Remotely-Sensed Images: An Introduction. Wiley. [ Links ]
McLoughlin, LH. and Chirico, P.G. 2013. Geospatial and statistical modeling of artisanal mining populations in Kenieba, Mali. Journal of Maps, vol. 9, no. 2. pp. 183-188. [ Links ]
Mkhize, M.C. 2017. New interventions and sustainable solutions: Reappraising illegal artisanal mining in South Africa. South African Crime Quarterly, vol. 61. pp. 67-75. [ Links ]
Mucina, I. and Rutherford, M. 2006. The vegetation of South Africa, Lesotho and Swaziland. Strelitzia, vol. 19. Memoirs of the Botanical Survey of South Africa. South African National Biodiversity Institute, Pretoria. [ Links ]
Mutemeri, N., Sellick, N., and Mtegha, H. 2010. What is the status of small-scale mining in South Africa. Centre for Sustainability in Mining and Industry, University of the WItwatersrand, Johannesburg. [ Links ]
Mutemeri, N,, Walker, J.Z., Coulson, N., and Watson, I. 2016. Capacity building for self-regulation of the Artisanal and Small-Scale Mining (ASM) sector: A policy paradigm shift aligned with development outcomes and a pro-poor approach. The Extractive Industries and Society, vol. 3, no. 3. pp. 653-658. [ Links ]
Mutemeri, N. and Petersen, F.W. 2002. Small-scale mining in South Africa: Past, present and future. Natural Resources Forum, vol. 26, no. 4. pp. 286-292. https://doi.org/10.1111/1477-8947.t01-1-00031 [ Links ]
Pettorelli, N., Ryan. S., Mueller, T., Bunnefeld, N., Jedrzejewska, B., Lima, M., and Kausrud, K. 2011. The Normalized Difference Vegetation Index (NDVI): Unforeseen successes in animal ecology. Climate Research, vol. 46, no. 1. pp. 15-27. [ Links ]
Oi, J., Chehbouni, A., Huete, A.R., Kerr, Y.H., and Sorooshian, S. 1994. A modified soil adjusted vegetation index. Remote Sensing of Environment, vol. 48, no. 2. pp. 119-126. [ Links ]
Oi, J., Kerr, Y., and Chehbouni, A. 1994. External factor consideration in vegetation index development. Proceedings of the Sixth International Colloquium on Physical Measurements and Signatures in Remote Sensing, Val d'Isere, France, 17-21 January 1994. CNES, London. pp. 723-730. [ Links ]
Rahmani, S., Strait, M., Merkurjev, D., Moeller, M., and Wittman, T. 2010. An adaptive IHS pan-sharpening method. IEEE Geoscience and Remote Sensing Letters, vol. 7, no. 4. pp. 746-750. [ Links ]
Rasmeni, S., Chetty, D., Sebola, P., and Seripe, K. 2016. Tiger's eye in the Northern Cape Province, South Africa-grading, distribution, small-scale mining, and beneficiation potential. Journal of the Southern African Institute of Mining and Metallurgy, vol. 116, no. 6. pp. 587-592. [ Links ]
Schröder, S., Bedorf, D., Beukes, N.J., and Gutzmer, J. 2011. From BIF to red beds: Sedimentology and sequence stratigraphy of the Paleoproterozoic Koegas Subgroup (South Africa). Sedimentary Geology, vol. 236, no. 1-2. pp. 25-44. [ Links ]
Schueler, V., Kuemmerle, T., and Schröder, H. 2011. Impacts of surface gold mining on land use systems in Western Ghana. Ambio, vol. 40, no. 5. pp. 528-539. [ Links ]
Seccatore, J., Veiga, M., Origliasso, E., MArin, T., and de Tomi, G. 2014. An estimation of the artisanal small-scale production of gold in the world. Science of the Total Environment, vol. 496. pp. 662-667. [ Links ]
Siegel, S. and Veiga, M.M. 2010. The myth of alternative livelihoods: artisanal mining, gold and poverty. International Journal of Environment and Pollution, vol. 41, no. 3-4. pp. 272-288. [ Links ]
Spiegel, S.J., Ribeiro, C.A.A.S., Sousa, R., and Veiga, M.M. Mapping spaces of environmental dispute: GIS, mining, and surveillance in the Amazon. Annals of the Association of American Geographers, vol. 102, no. 2. pp. 320-349. [ Links ]
Sunuprapto, H., Danoedoro, P., and Ritohardoyo, S. 2016. Evaluation of pan-sharpening method: applied to artisanal gold mining monitoring in Gunung Pani Forest area. Procedia Environmental Sciences, vol. 33. pp. 230-238. [ Links ]
Telmer, K. and Stapper, D. 2007. Evaluating and monitoring small scale gold mining and mercury use: Building a knowledge-base with satellite imagery and field work. United Nations Industrial Development Organization, Victoria, BC, Canada. [ Links ]
Thornton, R. 2014. Zamazama, illegal artisanal miners, misrepresented by the South African Press and Government. The Extractive Industries and Society, vol. 1, no. 2. pp. 127-129. [ Links ]
Verrelst, J., Camps-Valls, G., Munoz-MarI, J., Rivera, J.P., Veroustraete, f., Clevers, J.G.P.W., and Moreno, J. 2015. Optical remote sensing and the retrieval of terrestrial vegetation bio-geophysical properties-a review. ISPRS Journal of Photogrammetry and Remote Sensing, vol. 108. pp. 273-290. [ Links ]
White, N.W., Chetty, R., and Bateman, E.D. 1991. Silicosis among gemstone workers in South Africa: Tiger's-eye pneumoconiosis. American Journal of Industrial Medicine, vol. 19, no. 2. pp. 205-213. [ Links ]
Wilson, N.R., Norman, L.R., Villareal, M.L., Gass, I., Tiller, R., and Salywon, A. 2016. Comparison of remote sensing indices for monitoring of desert cienegas. Arid Land Research and Management, vol. 30, no. 4. pp. 460-478. [ Links ]
Zargar, A., Sadio, R., Naser, B., and Khan, F.I. 2011. A review of drought indices. Environmental Reviews, vol. 19. pp. 333-349. [ Links ]
 Correspondence:
P. Mhangara
paidamwoyom@yahoo.com
Received: 20 Sep. 2019
Revised: 8 Feb. 2020
Accepted: 13 Mar. 2020
Published: April 2020

