


Services on Demand
Article
 English (pdf)
 Article in xml format
 Article references
Indicators

Related links
-
 Cited by Google
 -
 Similars in Google
Share

 Permalink
Journal of the Southern African Institute of Mining and Metallurgy
On-line version ISSN 2411-9717
Print version ISSN 2225-6253
J. S. Afr. Inst. Min. Metall. vol.120 n.3 Johannesburg Mar. 2020
http://dx.doi.org/10.17159/2411-9717/698/2020
PAPERS OF GENERAL INTEREST
Au and Ag distribution in alloys produced from the smelting of printed circuit boards - an assessment using SEM-EDS, EPMA, and LA-ICP-MS analysis
C. Carelse; M. Manuel; D. Chetty; A. Corfleld
Mintek, South Africa
SYNOPSIS
Electronic waste such as printed circuit boards (PCBs) often contains important concentrations of precious metals such as Au and Ag, which are typically recovered using pyrometallurgical methods as a first step. Understanding the phase chemistry and distribution of precious metals in alloys is of value to the pyrometallurgist, as this gives information on phase partitioning in the furnace. In the present study we aimed at determining the contributions of different phases to the Au and Ag contained in the alloy, using a combination of mineralogical techniques.
Three alloy samples were first subjected to scanning electron microscopy (SEM) to distinguish the phases present. Electron probe microanalysis (EPMA) was then performed to determine the compositions of the different phases. Modal phase abundance was obtained, and laser ablation inductively coupled plasma mass spectrometry (LA-ICP-MS) was then used to quantify Au and Ag in the identified phases. The Au and Ag deportments were derived from these inputs.
The results show that Au and Ag partition into all identified alloy phases, but principally into Cu and Pb alloy phases. Cu-rich phases containing Sn are the major hosts of Au and Ag, with the Pb phase in one sample also being a major host. The study demonstrates the success of a combined mineralogical approach incorporating LA-ICP-MS as a method of choice for detecting low concentrations of precious metals in alloy phases, and contributes to our understanding of precious metal partitioning during smelting of waste PCBs.
Keywords: PCBs, e-waste, alloys, gold, SEM, LA-ICP-MS.
Introduction
With modern-day advances in technology, more electronic waste (e-waste) is being generated (Hadi et al., 2015; Kim et al., 2010) and needs to be dealt with in an environmentally safe and economical manner. E-waste is a fast-growing waste stream in South Africa, with more than 322 000 t being produced annually according to the e-Waste Association of South Africa (eWASA). A huge problem facing this country is access to e-waste, as most e-waste is not recycled and is still stored or locked up in offices, households, in landfills, etc. Proper e-waste management systems are also not in place, adding to the amount of e-waste being landfilled. Only 10% of e-waste is being recycled (DEA, 2012).
Urban mining involves the recycling of e-waste. One form of e-waste is printed circuit boards (PCBs), which are found in electrical and electronic appliances such as televisions, mobile phones and laptops (Khaliq et al., 2014). These PCBs often contain considerable amounts of valuable metals, up to 40%, (Luda, 2011) including precious metals (PM) such as Au and Ag. Recycling of these PCBs is a profitable business in developed countries (Chatterjee and Kumar, 2009). The main economic driver for PCB recycling is the recovery of PM and copper, with more than 70% of the contained value in PCBs being contributed by the PM (Cui and Zhang, 2008). Not only is metal recovery from PCBs economically attractive; it reduces the amount of hazardous waste being landfilled and results in high savings in energy consumption compared to processing metal from ores (Cayumill et al., 2016; Cui and Forssberg, 2003).
E-waste is recycled for its metal content using technologies in pyrometallurgy, hydrometallurgy, biohydrometallurgy, and mechanical processing (Kamberović et al., 2009). E-waste recycling has been dominated by pyrometallurgical routes for the past three decades (Cui and Zhang, 2008). Large recycling and e-waste co-processing facilities such as Glencore's Horne Smelter in Quebec, Canada, Boliden's Rönnskär Smelter in Skelleftehamn, Sweden, and Umicore in Belgium all make use of pyrometallurgical processing for recycling of their e-waste. Umicore uses pyrometallurgy followed by hydrometallurgy, by smelting of the e-waste and concentrating the PM into a copper bullion and the rest of the metals into a lead slag. After leaching the copper, the residue is treated for its PM at a PM refinery (Hageluken, 2006).
Hydrometallurgy is extensively used in the downstream separation and refining of pyrometallurgical products. The emphasis has shifted in the last 10 years to hydrometallurgical techniques as a primary recovery method for PM (Cui and Zhang, 2008). Few companies globally, however, make use of this technique for direct recovery of PM.
Mintek in South Africa embarked on an urban mining research project employing pyrometallurgy, and subsequent hydrometallurgy, to recover PM and other metals from PCBs. The aim of the project was to develop a smelting process through which a wide range of e-wastes can be processed in a small DC arc furnace, recovering the valuable metals into an alloy which is amenable to downstream hydrometallurgical processing.
The present study applies a combined mineralogical approach to locate and quantify low concentrations of Au and Ag in alloys produced from the smelting of PCBs, and from this, to determine their deportment in the copper (Cu), iron (Fe), and lead (Pb) alloy phases produced. An initial assessment of the phases present, and their possible Au and Ag contents, was made using scanning electron microscopy (SEM) with standardless energy-dispersive spectrometry (EDS). These precious metals, however, were found to be below the detection capabilities of SEM. For this reason, laser ablation inductively coupled plasma mass spectrometry (LA-ICP-MS) was chosen to quantify these elements, given its much lower detection limits (typically in the ppm to ppb range).
Gold and silver were targeted as these metals are usually two of the most dominant PM in electronic PCBs and they add significantly to the potential value of PCBs (Szatatkiewicz, 2014). Moreover, the deportment of Au after smelting is of importance to the pyrometallurgist from a phase partitioning perspective. Federov and Volkov (2016), Lee, Oh, and Lee (1994), Martienssen (2007), and Predel (1991) describe the Au-Fe, Au-Cu, Au-Pb, Ag-Fe, Ag-Cu, and Ag-Pb binary systems. According to these authors, Au will preferentially partition between Cu and Pb phases, whereas Ag preferentially partitions into Pb phases, on the basis of density. Empirical data from mineralogical techniques such as SEM and LA-ICP-MS has great potential to validate such theories and may contribute value to the discipline.
LA-ICP-MS was considered due its lower detection limits, compared with routine electron probe microanalysis (EPMA, with detection limits typically in hundreds of ppm), and SEM, so as to detect trace concentrations of elements in a given matrix. This technique is increasingly used for detection of trace elements in a variety of mineral matrices (Chen and Simonetti, 2013; Gilbert et al., 2014; Melcher etal., 2008) with detection limits down to ppb levels often achieved.
Trace element distribution data can in turn be used to calculate the bulk concentration of the trace element if the modal proportions of the different phases are known. This is particularly useful if bulk trace element concentrations are low, which may pose challenges for detection limits with routine bulk chemical assays. Authors such as Devos et al. (2000), Devos, Moor, and Liedeman (1999, Dussubieux et al. (2008), Dussubieux and Williams (2007), Dussubieux and Zelst (2004), Guillaume, Gratuze, and Barrandon (2007), and McCurdy, Woods, and Scrimshire (2005) have developed analytical methods for the analysis of ancient copper, gold, silver, nickel, and iron alloys using LA-ICP-MS.
Latkoczy and Ghislian (2006) used LA-ICP-MS to analyse trace element content in industrial magnesium alloys as part of corrosion studies. In a similar vein, this paper looks at trace element analysis of Au and Ag as it applies to copper- and iron-base alloys generated from PCB smelting, and considers their distribution among the alloy phases.
Materials and methods
Alloy tap samples
Three tapped alloy samples (taps A, B, and C) from three different PCB smelting campaigns were selected for Au and Ag analysis to assess the PM distribution among the alloy phases. The three smelting campaigns were conducted to develop and illustrate a flexible smelting process to recover the PM contained in electronic waste into an alloy. The three tapped alloys were chosen based on their composition (copper-rich alloys) and also on the bulk Au, Ag, and Cu concentrations. Alloys with the highest Au, Ag, and Cu concentrations were chosen for this study, as these represented the best candidates for downstream recovery by leaching.
Tap A originated from a smelting campaign whereby pre-shredded (< 50 mm in size) PCBs were smelted together with copper oxide (malachite-rich) ore and limestone to collect the valuable metals into a Cu alloy phase. The copper ore acted as a collector source. Low-grade PCBs (< 40 ppm Au) were chosen to assess the effectiveness of the collection and therefore upgrading into the alloy phase. Approximately 2000 kg of PCBs were processed. The PCBs were manually fed to the furnace in 30 kg to 90 kg batches.
After the addition of each batch of feed, the metal and slag were tapped via the furnace tap-holes into refractory-lined ladles and allowed to solidify and cool before weighing and labelling. Tapped alloys with different bulk compositions were produced: those low in iron and high in copper, and alloys high in iron and low in copper. It was noted that for alloys low in iron, the solid iron phase may be dispersed in the copper matrix and flow out of the furnace together with the copper in a semi-homogenous alloy. The appearances of the three alloys are shown in Figure 1.
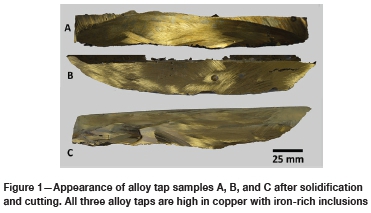
Taps B and C originated from two different smelting campaigns involving the smelting of PCBs without the addition of copper ore as a collector, since it was found in the first campaign (tap A) that the collector diluted the valuable material content in the alloy. Iron- and copper-rich alloys were produced.
Tap B was formed by the feeding of shredded PCBs to a molten metal bath produced by the melting down of a metal heel (copper alloy) together with a synthetic slag mixture (silica, limestone, and alumina). Tap C was formed by heating a heel of copper scrap and feeding the PCBs in batches together with the synthetic slag mix.
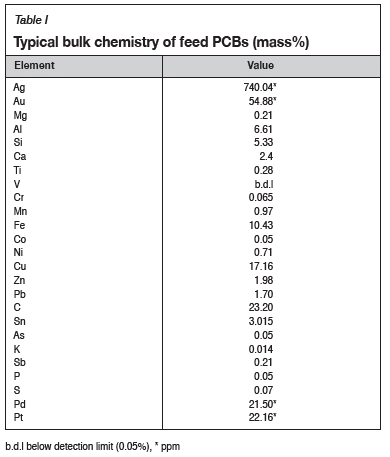
For assaying of the feed PCBs, the PCBs were shredded to < 10 mm, and crushed and milled to further reduce the particle size. PCBs were taken directly from the conveyer belt underneath the feed hopper, milled, and screened. A typical bulk chemical assay of the feed PCBs is presented in Table I. For bulk chemical analysis of the alloy, sub-samples were taken from the alloy during each tap.
Physical inspection of the three tapped alloys shows great heterogeneity (Figure 1) in the alloy components, as well as the presence of admixed slag. Small pieces showing evidence of many phases at a visual scale were cut from the large ingots and prepared as polished sections for SEM, EPMA, and LA-ICP-MS analysis.
Polished section preparation
The cut pieces of each of the three tapped alloys were embedded in resin. The sample surfaces were initially ground using a 220 grit followed by grinding on 600 and 1000 grit grinding discs. The samples were then polished using diamond suspensions with particle sizes of 6 pm, 3 pm, and 1 pm. After polishing, the samples were cleaned with water followed by ethanol. For SEM and EPMA, the polished sections were coated with carbon by using an evaporative carbon coater.
Scanning electron microscopy
A metallographic investigation was conducted on the alloy phases in each of the three tapped alloys, using a Zeiss Evo MA15 scanning electron microscope with energy-dispersive spectroscopy (EDS). A voltage of 20 kV with a beam current of 3.3 nA was used. Typical detection limits for the SEM-EDS system are in the range 0.1-0.5 wt%. The study included identification of the different phases present, their textures and associations, inclusions, etc. This step is deemed important since it gives insight into what areas to target for LA-ICP-MS analysis and whether the alloy area targeted is representative of the overall structure (Meredith et al., 2011).
Modal analysis of alloy phases
Modal proportions of alloy phases were obtained using the Olympus Stream Essentials image processing software, which integrates a detection method that uses thresholding to reliably separate objects (particles, mineral phases) from the background (resin). A series of backscattered electron (BSE) images of each tapped alloy sample was imported into the software. Thresholds were selected for each alloy phase and the background. The final threshold image was then segmented and the count and measure function applied to calculate the area of each alloy phase in the image. The modal abundance of each alloy phase was then calculated from the area of that phase and, using assigned densities for each phase, the mass abundance was calculated.
Electron probe microanalysis (EPMA)
Analyses were performed using a Cameca SX50 electron microprobe equipped with four wavelength-dispersive spectrometers (WDS) and an energy-dispersive spectrometer (EDS). An accelerating voltage of 20 kV and a beam current of 30 nA were used, with a beam spot size of 5 pm. Pure metal standards were used to calibrate the system for the analysis of the Al, Si, Ti, Mn, Fe, Ni, Cu, Zn, Sn, Sb, and Pb contents of selected phases.
EPMA was performed to not only determine the composition of the different phases identified by SEM but also to obtain the Cu, Fe, and Pb concentrations for internal standardization in the LA-ICP-MS process.
Laser ablation inductively coupled plasma mass spec-trometry (LA-ICP-MS)
Analyses were performed using a NEW WAVE 193 nm ArF excimer laser coupled to a Thermo Element XR high-resolution ICP-MS. Identical ablation conditions were used for standards and samples. Alloy phases were ablated using two ablation modes: lines and spots. Spot size was 15 pm and for lines a width of 25 pm was used. Analyses were conducted in a He atmosphere within the ablation cell and mixed with Ar gas before entering the plasma.
65Cu was used as an internal standard for the Cu-rich phases, 56Fe for the Fe-rich phases, and 208Pb for the Pb-rich phases to monitor instrument drift and to correct for differences in ablation yield. Scanned masses were 56Fe, 65Cu, 107Ag, 197Au, and 208Pb. Data reduction was performed using the GLITTER laser ablation software.
The NIST 610 glass was used as calibration material for the Cu, Fe, and Pb alloy phases. Velasquez et al. (2018), using a femtosecond laser, showed that accurate results can be obtained for copper alloys using the NIST 610 as a calibration standard. A copper alloy standard, 39X 17868 (Brammer Standard Company) was used as reference material to assess the accuracy of Au and Ag determination in the Cu-rich phases. Accuracies of between 2% and 16% were achieved for Ag, and between 13% and 34% for Au. The poorer accuracy for Au can be ascribed to the heterogeneity of the 39X 17868 standard, as it was not manufactured specifically for LA-ICP-MS analysis and does not have good homogeneity on the finer micrometre scale.
In the absence of a suitable matrix-matched Fe alloy reference material containing Au and Ag, the BCR-2G glass standard was used. The BCR-2G contains about 9.63 wt% Fe; the Fe-rich samples, in comparison, contained between 60 and 87 wt% Fe. The BCR-2G contains no Au, therefore only the accuracy of Ag determination was assessed. Accuracies of between 35 and 74% were obtained for Ag , which was expected given the non-matrix-matched character of the standards used.
A suitable matrix-matched lead alloy reference material containing Au and/or Ag could not be sourced. A tin/lead standard, NF43-2 (Brammer Standard Company) was analysed to check the accuracy for Au and Ag. Accuracies within 11% and 43 % were obtained for Ag and Au, respectively. The poorer accuracy on Au can be ascribed to the heterogeneity of this standard with respect to Au as it was also not manufactured for a microanalytical technique such as LA-ICP-MS.
The Pb phase of tap C was smaller than 5 pm, and could not be analysed with the laser, as insufficient energy reached the standards and samples at a spot size of 2 pm and 1 pm, resulting in no signal. The use of such small spot sizes (2 pm) requires further investigation.
Results
Bulk chemical assays
Table II lists the bulk chemical assay results for the three tapped alloys. Taps B and C are more enriched in Au and Ag compared to tap A. Tap C is the most enriched in Ag (2000 ppm) and tap B the most enriched in Au (190 ppm). Tap A is more enriched in Cu, Pb, and Sn than taps B and C. The lower Au and Ag contents of alloy tap A are a result of the compositional character of the feed PCBs used, which were low in Au.
Alloy phase characteristics
Phase distinction and textural characteristics
Metallographic investigation of the three tapped alloys indicated considerable heterogeneity, which is a direct result of the inherent heterogeneous nature of the feed PCBs. Table III lists the different phases present in each tapped alloy, together with their relative abundance in mass percentage. The latter was determined by means of point counting using the Olympus Stream Essentials image processing software.
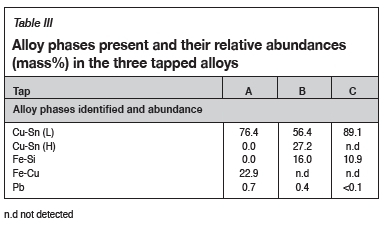
Five alloy phases were identified based on EDS analysis, namely a Pb phase, a Fe-Si phase, a Fe-Cu phase, and two Cu-Sn phases. The two Cu-Sn phases, based on their Cu and Sn concentrations, are herein referred to as Cu-Sn (H) and Cu-Sn (L), where the former indicates a high Sn content (> 6 wt%) and the latter a low Sn content (< 6 wt%). Figure 2 to Figure 4 presents images illustrating the above-mentioned phases in each of the three tapped alloys.
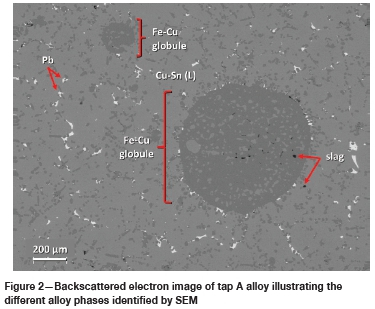
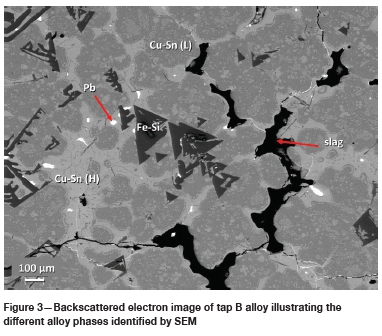
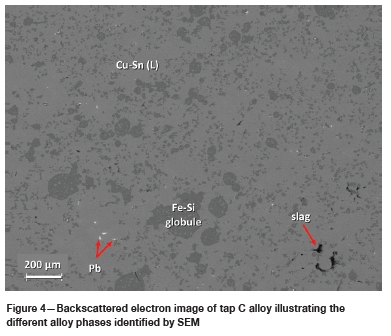
Tap A is a Cu-Sn (L) matrix alloy with generally round globules of the Fe-Cu phase. Globules range from <10 pm to >100 pm in size. The Pb phase, present as randomly distributed droplets, is quite common and coarser (up to 50 pm in diameter) than in the other two taps. Tap B consists of a Cu-Sn (H) and Cu-Sn (L) matrix with generally small (< 25 pm in diameter) bleb-shaped inclusions of Pb and an octahedral Fe-Si phase. Tap C is a Cu-Sn (L) matrix alloy with round to irregular-shaped globules of Fe-Si (Figure 4). Pb is also present and is generally < 5 pm in size.
The different textures and alloy phases observed in the three tapped alloys can be linked to the different pyrometallurgical recipes used (variables such as temperature, collectors, fluxes, cooling rate, etc.). Tap A was formed by the addition of copper oxide ore as a collector, and taps B and C without copper ore a collector. For tap B, a metal heel (copper alloy) was melted down whereas in tap C, a heel of copper scrap was heated together with the PCBs. The presence or absence of a collector can influence the different copper and iron alloy phases formed, as well as the copper and iron levels. Copper ore contains iron oxides and the raw PCBs also contain iron, resulting in iron in the formed alloys.
The varying and complex compositional characteristics of the feed PCBs also plays a significant role in the phases that can form. Although a typical composition of the feed PCB is provided (Table I), the relative enrichment in Pb of tap A relative to taps B and C (Table II) may point to compositional variability in the feed PCB batches used to generate each tap sample. Larger and more abundant Pb droplets formed in tap A compared to taps B and C (Figure 3 and Figure 4), in which much smaller and less abundant lead droplets formed. Tin and silica were also present in the feed PCBs and hence in the formed tapped alloys.
Quantitative phase chemistry
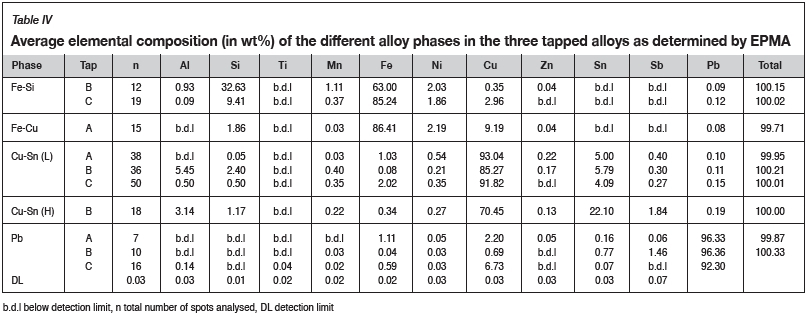
Table IV lists the average elemental compositions of the phases identified by SEM, as determined by EPMA. The full set of raw data is available on request. It is important to note that concentrations below detection were assigned a value of zero for the purpose of calculating the average concentrations, which will be underestimated as a consequence.
The Cu-Sn (L) phase, present in all three taps, has an average Cu content of between 85.27 and 93.04 wt%. Tin content is generally below 6.00 wt%. The Cu-Sn (H) phase, found only in tap B, has a Sn content of up to 22.10 wt%.
The Fe-Si phases of taps B and C have Fe contents of 63.00 wt% and 85.24 wt% respectively. The Fe-Si phase of tap B has a higher silica content of 32.63 wt% compared to tap C (9.41 wt%).
The Pb-rich phases of taps A and C contain some Cu (up to 6.73 wt%). whereas the Pb phase of tap B contains some Sb (1.46 wt%).
Gold and silver content in alloy phases
Gold and silver concentrations were quantified in the Cu-rich, Fe-rich, and Pb-rich phases of the three tapped alloys using LA-ICP-MS (Table V). As mentioned in the LA-ICP-MS method section, the Pb phase of tap C could not be analysed due to the laser providing insufficient energy at small spot sizes (< 2 pm). Full data-sets are available upon request.
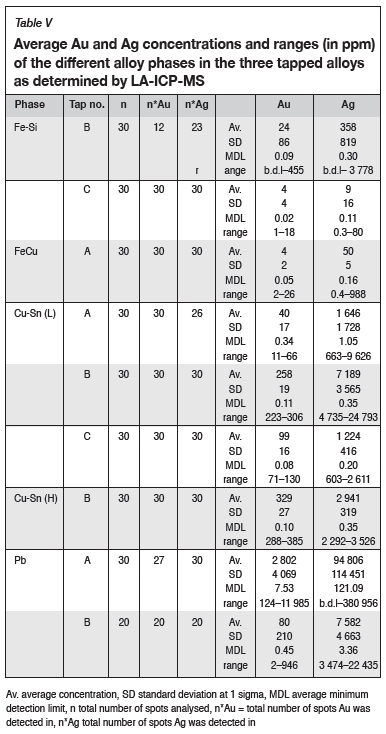
Gold and silver were found to be most enriched in the Pb phase of tap A, with average Au and Ag contents of 2 802 ppm and 10% respectively. Silver is also most enriched in the Pb phase of tap B, with an average Ag content of 7 582 ppm.
The two Cu-Sn phases, Cu-Sn (L) and Cu-Sn (H), are more enriched in Au and Ag than the Fe phases (Fe-Si and Fe-Cu). The Cu-rich phases contain average Au contents in the order of 10 to 100 ppm, whereas the Fe-rich phases contain in the order of 1 to 10 of ppm Au.
The Cu-Sn (L) phase of tap B is more enriched in Au, with an average Au concentration of 257.8 ppm, and tap A the least enriched (39.9 ppm). The Cu-Sn (H) phase is more Au-enriched than the Cu-Sn (L) phase, with the Cu-Sn (H) phase of tap B having an average Au concentration of 329.3 ppm.
Silver concentrations in the Cu-rich phases are in the order of 1000 ppm. The Cu-Sn (L) phase of tap B has the highest average Ag content of 7 189 ppm.
The Fe-rich phases are the least enriched in Au and Ag, especially the Fe-Si phase of tap C. Gold and silver contents are in the low ppm ranges in these phases (3.9-23.8 ppm for Au, 9.2-358.3 ppm for Ag).
Analysis by LA-ICP-MS revealed the presence of Ag and Au in all identified alloy phases but one (the Pb phase of tap C). Gold and silver are heterogeneously distributed across the various alloy phases, with the Pb phase being the most enriched in Au and Ag followed by the Cu-rich phases. Au and Ag are heterogeneously distributed not only across the alloy phases, but also in a given alloy phase as indicated by the large standard deviations around the averages (Table V).
The partitioning of Au and Ag into Pb, Cu, and Fe can be explained by referring to the Au-Fe, Au-Cu, Au-Pb, Ag-Fe, Ag-Cu, and Ag-Pb binary phase diagrams of Federov and Volkov (2016), Lee, Oh, and Lee (1994), Martienssen (2007), and Predel (1991). According to these authors, Au will preferentially partition between Cu and Pb phases, whereas Ag preferentially partitions into Pb phases, on the basis of density.
Au and Ag deportment in alloy phases
Gold and silver deportment was calculated, using the LA-ICP-MS results, to determine the contribution of each alloy phase in terms of Au and Ag and to determine the total Au and Ag contained in each of the three tapped alloy samples. For tap C, the Au and Ag deportment does not include the contribution from the Pb phase as it could not be analysed with the laser. Deportment calculations were done by using the average Au and Ag concentrations and the modal proportions of the different phases determined by image analysis.
Figure 5 and Figure 6 illustrate the contribution of each alloy phase, in ppm, in terms of Au and Ag for each of the three tapped alloys as well as the total Au and Ag for each alloy. Figure 7 and Figure 8 illustrate the Au and Ag deportment, in per cent, as pie charts.
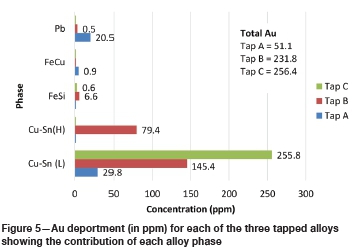
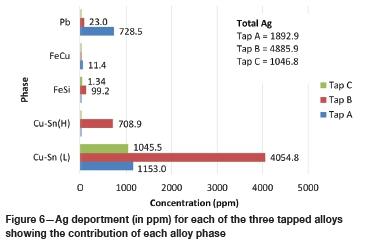
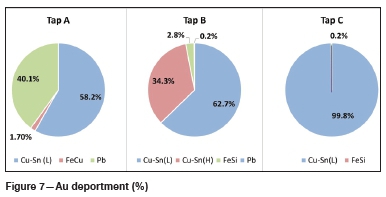
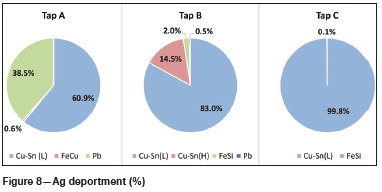
For tap A, the majority of the Au (29.8 ppm) and Ag (1 153 ppm) is contributed by the Cu-Sn (L) phase (Figure 5 and Figure 6). This corresponds to 58.2% of the total Au and 60.9% of the total Ag (Figure 7 and Figure 8). The Fe-Cu phase hosts the least Au and Ag (1.7% of the total Au and 0.6% of the Ag). Although the Pb phase contains the highest average Au and Ag concentrations (Table V), it makes up a small percentage of the total sample and hence its contribution is lower than that of the Cu-Sn (L) phase. Forty per cent of the total Au, and 38.5% of the total Ag, is contributed by the Pb phase. In total, tap A hosts 51.1 ppm of Au and 1 893 ppm of silver.
For tap B, the two Cu-Sn phases are the main hosts of gold and silver with 97.0% of the total Au and 97.5 % of the total Ag present (Figure 7 and Figure 8) in these phases. The Pb phase contributes the least Au (0.2%) and Ag (0.5%) to the total Au and Ag, owing to its low modal abundance in the alloy. The Fe-Si phase is also a minor contributor of Au and Ag with 2.8% of the total Au and 2.0% of the total Ag being hosted by this phase. In total, tap B hosts 231.8 ppm Au and 4 886 ppm Ag.
For tap C, a similar trend is visible with the Cu-Sn (L) phase hosting the majority of the Au and Ag. In terms of percentage contributions, 99.8% and 99.9% of the total Au and Ag are contributed by the Cu-Sn (L) phase respectively (Figure 7 and Figure 8). The Fe-Si phase is a minor contributor, with 0.24% and 0.13% of the total Au and Ag being contributed by this phase. The Au and Ag contribution of the Pb phase could not be determined due to this phase being too small to analyse. The modal abundance of the Pb phase is low (< 0.1 wt%) and hence its contribution will be minor. In total 256.4 ppm Au and 1 047 ppm Ag are hosted in tap C.
Deportment calculations show that the Cu-Sn (L) phase of each tapped alloy contributes the most to the total gold and silver budget. For tap B, the Cu-Sn (H) phase is also a dominant host. The Pb phase of tap A is also a major Au and Ag host. All three taps host more Ag than Au, which is as expected.
Bulk chemical assay results of the tapped alloys (Table II) show that tap A is less enriched in gold and silver than taps B and C. Gold deportment results are in agreement with the bulk chemical assay results in that taps B and C contain higher total Au than tap A. Bulk chemical assay results show that tap C contains the highest total Ag and tap A the lowest total Ag. Silver deportment, however, shows that tap B has the highest Ag and tap C the lowest. The reason for this discrepancy between bulk chemical assay results and deportment using LA-ICP-MS data is the heterogeneous nature of the tapped alloys, which in turn is due to the heterogeneous nature of the feed PCBs. Different sub-samples from the same tapped alloy were analysed by the two techniques and cross-checks of the total Au and Ag are therefore difficult.
Discussion
The results have shown that all of the alloy phases in the three tapped alloys, except the Pb phase of tap C, are hosts of Au and Ag, i.e., Au and Ag partitioned into all of the alloy phases but more dominantly into specific (Pb and Cu) alloy phases. Silver concentrations are generally higher than Au, which is to be expected since PCBs generally contain more Ag than Au (Khaliq et al., 2014).
Results further indicate that Au and Ag migrated towards and partitioned mostly into the denser lead phase, and to a lesser extent into the Cu and Fe phases. Lead is used as solder in PCBs (Jha et al., 2012) and Au and Ag were therefore not originally present in the Pb phase.
The LA-ICP-MS results confirm the Au-Fe, Au-Cu, Au-Pb, Ag-Fe, Ag-Cu, and Ag-Pb binary systems and thermodynamics identified by Federov and Volkov (2016), Lee, Oh, and Lee (1994), Martienssen (2007), and Predel (1991). The technique not only confirmed the thermodynamics of the binary diagrams; it also quantified the Au and Ag in these binary phases.
The Au and Ag deportments indicate that the Cu-Sn (L) phase of the three tapped alloys contributes the most Au and Ag to the total Au and Ag for each tapped alloy. The Pb phase of tap A is also a major contributor of Au and Ag, as well as the Cu-Sn (H) phase of tap B. For tap B, the Pb phase makes a small contribution to the total Ag, despite it having the highest Ag concentrations. This is due to its low modal abundance in the tapped alloy. The Fe phases make a minor contribution to the total Au and Ag for each tapped alloy. The Au and Ag deportment informs the pyrometallurgist on precious metals partitioning in the furnace.
Gold and silver vary in concentration in each alloy phase. The large standard deviations and wide concentrations ranges of Au and Ag further supports this heterogeneity in distribution.
Due to upgrades in the design and functions of electronic products, PCBs are constantly changing in composition (Chancerel et al., 2009). Due to the heterogeneous and complex nature of a batch of PCBs obtaining a representative sample, as well as the chemical analysis of the sample itself, is challenging (Ogunniyi, Vermaak, and Groot, 2009).
The heterogeneous nature of the tapped alloys is a result of not only the heterogeneous nature of the feed PCBs, but also the different pyrometallurgical recipes (factors such as cooling rate, temperature, fluxes, collectors added, etc.) used in the smelting process. The composition of the feed PCBs and the pyrometallurgical recipe used, in turn determine the alloy phases that form and how much of these will form.
Electrorefining and leaching tests may be performed on the copper alloy for the recovery of Cu and Au. For electrorefining, a pure Cu metal will be produced and the PM (Au, Ag, PGM) and other metals (Pb, Sn, Sb) concentrated into the insoluble anode sludge. Leaching is then performed on the anode sludge in chloride media to recover the PM. Leaching efficiency/recovery may be variable depending on the leach process, as well as host phase distribution, composition, and contribution to the PM budgets. Alloys with different compositions have different leaching behaviour/kinetics. A designed flow sheet should be flexible to accommodate the heterogeneous nature of the tapped alloys.
Conclusions and recommendations for further work
The results have shown that Au and Ag in alloys produced from the smelting of PCBs can be successfully located and quantified using a combination of SEM, EPMA, and LA-ICP-MS. Initial studies to detect and quantify gold using only SEM were unsuccessful due to the concentrations of Au being below the detection limit of the SEM. LA-ICP-MS however, with its much lower detection limits, were successful in locating and quantifying gold and silver. The data can be used to understand Au and Ag distribution in alloy phases, and the contributions of each phase to the total Au and Ag content in the alloy. Deportment studies of this type allow for improved pyrometallurgical (and subsequent hydrometallurgical) processing for precious metals recovery from PCBs. The heterogeneous nature of the alloys produced can be addressed through prudent sampling, e.g., atomization to produce smaller particle sizes from which representative samples can be taken.
For the LA-ICP-MS method, suitable reference materials containing Au and/or Ag are needed to properly assess the accuracy of Au and Ag analyses of in the alloy phases. The use of smaller spot sizes (< 5 pm) also needs to be assessed further.
Acknowledgements
The authors are grateful to Mintek for financial support and permission to publish. We thank Mintek colleagues Markus Erwee, Rodney Jones, Derek Hayman, Roxanne Mottay, Thabiso Ntloko, Sello Tsebe, and Glen Denton for their inputs on the pyrometallurgical and hydrometallurgical processing.
References
Cayümill, R., Khana, R., Rajarao, R., Mukherjee, P.S., and Sahajwalla, V. 2016. Concentration of precious metals during their recovery from electronic waste. Waste Management, vol. 57. pp. 121-130 [ Links ]
Chancerel, P., Meskers, CE., Hagelüken, C., and Rotter, V.S. 2009. Assessment of precious metal flows during preprocessing of waste electrical and electronic equipment. Journal of Industrial Ecology, vol. 13, no. 5. pp. 791-810. [ Links ]
Chatterjee, S. and Kumar, K. 2009. Effective electronic waste management and recycling process involving formal and non-formal sectors. International Journal of Physical Sciences, vol. 4, no. 13. pp. 893-905 [ Links ]
Chen, W. and Simonetti, A. 2013. In-situ determination of major and trace elements in calcite and apatite, and U-Pb ages of apatite from the Oka carbonatite complex: Insights into a complex crystallization history. Chemical Geology, vol. 353. pp. 151-172. [ Links ]
Cui, J. and Forssberg, E. 2003. Mechanical recycling of waste electric and electronic equipment: a review. Journal of Hazardous Materials, vol. 99. pp. 243-263. [ Links ]
Cui, J. and Zhang, L. 2008. Metallurgical recovery of metals from electronic waste: a review. Journal of Hazardous. Materials, vol. 158. pp. 228-256. [ Links ]
Department of Environmental Affairs. 2012. South African Environmental Outlook: A report on the state of the environment. Pretoria. [ Links ]
Devos, W., Moor, Ch., and Lienemann, P. 1999. Determination of impurities in antique silver objects for authentication by laser ablation inductively coupled plasma mass spectrometry (LA-ICP-MS). Journal of Analytical Atomic Spectrometry, vol. 14. pp. 621-626. [ Links ]
Devos, W., Senn-Luder, M., Moor, Ch., and Salter, C. 2000. Laser ablation inductively coupled plasma mass spectrometry (LA-ICP-MS) for spatially resolved trace analysis of early-medieval archaeological iron finds. Fresenius Journal of Analytical Chemistry, vol. 366. pp. 873-80. [ Links ]
Dussubieux, L. and Van Zelst, L. 2004. LA-ICP-MS analysis of platinum group elements and other elements of interest in ancient gold. Applied Physics A, Material Science and Processing, vol. A79, no. 2. pp. 353-6. [ Links ]
Dussubieux, L. and Williams, P.R. 2007. Elemental analysis of Peruvian copper-based artefacts using LA-ICP-MS. Proceedings of the 2nd International Conference -Archaeometallurgy in Europe2007, Aquileia, Italy 17-21 June. Associazione Italiana di Metallurgia, Milan. pp. 489-497. [ Links ]
Dussubieux, L., Deraisme, A., Frot, G., Stevenson, C., Creech, A., and Bienvenu, Y. 2008. LA-ICP-MS, SEM-EDS and EMPA analysis of eastern north American copper-based artefacts: Impact of corrosion and heterogeneity on the reliability of the LA-ICP-MS compositional results. Archaeometry, vol. 50, no. 4. pp. 643-657 [ Links ]
Fedorov, P.P. and Volkov, S.N. 2016. Au-Cu phase diagram. Russian Journal of Inorganic Chemistry, vol. 61. pp. 772-775. [ Links ]
Gilbert, S.E., Danyushevsky, L.V., Goemann, K., and Death, D. 2014. Fractionation of sulphur relative to iron during laser ablation ICP-MS analyses of sulphide minerals: implications for quantification. Journal of Atomic Spectrometry, vol. 29. pp. 1024-1033. [ Links ]
Guillaume, S., Gratuze, B., and Barrandon, J. 2007. Application of laser ablation inductively coupled plasma mass spectrometry (LA-ICP-MS) for the investigation of ancient silver coins. Journal of Analytical Atomic Spectrometry, vol. 22. pp. 1163-1167. [ Links ]
Hadi, P., Xu, M., Lin, C.S.K., Hui, C., and McKay.G. 2015. Waste printed circuit board recycling techniques and product utilization. Journal of Hazardous Materials, vol. 283. pp. 234-342 [ Links ]
Hagelüken, C. 2006. Recycling of electronic scrap at Umicore Precious Metals Refining. Acta Metallurgica Slovaca, vol. 12. pp. 111-120. [ Links ]
Jha, M. K., Kumari, A., Choubey, P.K., Lee, J., Kumar, V., and Jeong, J. 2012. Leaching of lead from solder material of waste printed circuit boards (PCBs). Hydrometallurgy, vol. 121-124. pp. 28-34. [ Links ]
Kamberović, Z., Korac, M., Ivsic, D., Nikoliic, V., and Ranitoviic, M. 2009. Hydrometallurgical process for extraction of metals from electronic waste. Part 1: Material characterisation and process option selection. Association of Metallurgical Engineers of Serbia, vol. 15, no. 4. pp. 231-243. [ Links ]
Khalio, A., Rhamdani, M. A., Brooks, G., and Masood, S. 2014. Metal extraction processes for electronic waste and existing industrial routes: A review and Australian perspective. Resources, vol. 3. pp. 152-179 [ Links ]
Kim, E., Kim, M., Lee, J., Yoo, K., and Jeong, J. 2010. Leaching behaviour of copper using electro-generated chlorine in hydrochloric acid solution. Hydrometallurgy, vol. 100. pp. 95-102. [ Links ]
Latkoczy, C. and Ghislain, T. 2006. Simultaneous LIBS and LA-ICP-MS analysis of industrial samples. Journal of Atomic Spectrometry, vol. 21. pp. 1152-1160. [ Links ]
Lee, B.Z, Oh, C.-S., and Lee, D.N. 1994. Ag-Pb system. Journal of Alloys & Compounds, vol. 215. pp. 293-301. [ Links ]
Luda, M.P. 2011. Recycling of printed circuit boards. Integrated Waste Management. vol. 2. Kumar, S. (ed.). Intech. pp. 286-298. [ Links ]
Martienssen, W. (ed). 2007. Landolt-Bõrnstein. Numerical Data and Functional Relationships in Science and Technology, Group IV: Physical Chemistry, Volume 19. Thermodynamic properties of Inorganic Materials compiled by SGTE Subvolume B, Part 5: Binary Systems Supplement 1. Springer. pp. 30, 33, 93. [ Links ]
McCurdy, E., Woods, G., and Scrimshire, P. 2005. Laser ablation (LA)-ICP-MS for production control of nickel alloys. Agilent Technologies, Santa Clara, CA. pp. 1-6. [ Links ]
Melcher, F., Guapner, T., Henjes-Kunst, T., Oberthür, T., Sitnikova, M., Gàbler, E., Gerdes, A., Bratz, H., Davis, D., and Dewaele, S. 2008. Analytical fingerprint of columbite-tantalite (coltan) mineralisation in pegmatites - Focus on Africa. Proceedings of the Ninth International Congressfor Applied Mineralogy, Brisbane, QLD, 8-10 September 2008. Australasian Institute of Mining and Metallurgy, Melbourne. [ Links ]
Meredith, C., Tromp, M., Peterson, D., Dudgeon, J., Gevorkyan, A., and Meliksetian, K. 2011. New standards in the analysis of archaeological metalwork using LA-ICP-MS: A case study from the South Caucasus Archaeometallurgy Project. Poster presentation, Annual Meeting of the Society for American Archaeology, Sacramento. [ Links ]
Ogunniyi, LO, Vermaak, M.K.G., and Groot. D.R. 2009. Chemical composition and liberation characterization of printed circuit board comminution fines for beneficiation investigations. Waste Management, vol. 29, no. 7. pp.2140-2146. [ Links ]
Predel, B. 1991. Landolt-Bõrnstein. Numerical Data and Functional Relationships in Science and Technology, Group IV: Physical Chemistry, vol. 5a. Phase Equilibria,, Crystallographic and Thermodynamic Data of Binary Alloys · Ac-Au - Au-Zr. Springer. [ Links ]
Szaeattjewicz, J. 2014. Metals content in printed circuit board waste. Polish Journal of Environmental Studies, vol. 23, no. 6. pp. 2365-2369. [ Links ]
Velasouez, G., Borisova, A.Y.,Baron, S., and Robbiola, L. 2018. In situ analysis of copper alloys by femtosecond laser ablation inductively coupled plasma mass spectrometry: Constrains on matrix effects. American Journal of Analytical Chemistry, vol. 9. pp. 150-161. [ Links ]
 Correspondence:
C. Carelse
candicec@mintek.co.za
Received: 3 Apr. 2019
Revised: 3 Dec. 2019
Accepted: 5 Dec. 2019
Published: March 2020

