


Services on Demand
Article
 English (pdf)
 Article in xml format
 Article references
Indicators

Related links
-
 Cited by Google
 -
 Similars in Google
Share

 Permalink
Journal of the Southern African Institute of Mining and Metallurgy
On-line version ISSN 2411-9717
Print version ISSN 2225-6253
J. S. Afr. Inst. Min. Metall. vol.120 n.3 Johannesburg Mar. 2020
http://dx.doi.org/10.17159/2411-9717/759/2020
PAPERS OF GENERAL INTEREST
Reliability and evaluation of point load index values obtained from different testing devices
D. AkbayI; R. AltindagII
IÇanakkale Onsekiz Mart University, Çan Vocational School, Çanakkale. https://orcid.org/0000-0002-7794-5278
IISüleyman Demirel University, Department of Mining Engineering, Isparta. https://orcid.org/0000-0002-5397-7312
SYNOPSIS
In some rock mass classification methods, the point load index (PLI) value is used as a parameter in the determination of the class of rock mass. The PLI value may be used as a design parameter such as uniaxial compressive strength (UCS) and tensile strength (TS), owing to its being simpler, faster, and cheaper and easier to prepare than the specimens for UCS and TS tests. It can also be carried out in both the field and the laboratory. Many researchers have investigated PLI testing and the effect of different loading configurations, sample size, and size correction factors.
Within the scope of this study, PLI tests were performed in 15 different point load index testing devices. The experiments were carried out on seven different rock types (three sedimentary, one metamorphic, three magmatic) by the same operator. The errors of the testing devices were investigated based on the experimental results, and a device was modified to avoid the errors identified. Additional experiments were carried out in the modified testing device to acquire more realistic values. The PLI values obtained from the modified device were found to be more reliable, with standard deviations lower than those obtained from other conventional testing devices.
Keywords: point load index, rock mass classification, measurement error, testing device.
Introduction
Classification of rock masses in engineering projects is important in terms of project planning and designing. There is little information about the rock mass in the feasibility and initial design phases of a project. Attempts have been made to acquire knowledge about the rock mass by using experimental, observational, and empirical methods. The experimental methods are carried out in accordance with rock mechanics standards, which are the most commonly used and most accurate methods to characterize the rock mass. It is sometimes costly and time-consuming to prepare the rock samples and to carry out the experiments. In such cases, the test methods which are simpler, faster, easier, portable, cheaper, and do not require specimen preparation are preferred. The most commonly used strength values for rock materials are the point load index (PLI) and uniaxial compressive strength (UCS). Such values are also used as input parameters in the classification of rock masses and rock excavatability for engineering structures both underground and on the surface.
PLI is used as a rated parameter as the strength value of intact rock in some rock mass classification systems. When rock mass classification systems in which PLI is directly used as a rated parameter are examined, it will be noticed that five classes are mostly formed of lower to higher strengths. Also, that the strength values in the first four classes range from zero to 4 MPa, whereas the fifth class comprises the values >4 MPa (Franklin, Broch, and Walton, 1971; Broch, Broch and Walton, 1971; Broch and Franklin, 1972; Edet and Teme, 1990; Ghosh and Srivastava, 1991; Pettifer and Fookes, 1994; Tsiambaos and Saroglou, 2010). However, UCS is the most commonly used parameter in the classification systems, whereas PLI is most commonly used in the indirect estimation of UCS. Several researchers have carried out studies to predict UCS as a function of PLI and more than 100 equations relating the two parameters have been proposed (Akbay, 2018). The PLI values of the rocks must be multiplied by a wide range of coefficients, from 3 to 71, to predict the UCS values (Akbay, 2018). However, there is no particular study which deals with the rock types and the shapes of specimen to which these coefficients apply. Although the PLI test is considered a field test, it is unclear whether the PLI data found in the literature was obtained in the laboratory or in the field. Within the context of the studies, it is understood that the tests were carried out in a laboratory. For this purpose, the current method of determining the PLI using a PLI device should be reviewed so that more accurate measurements, which are free from the current errors and associated disadvantages, can be obtained.
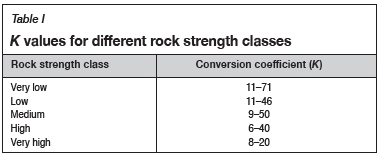
Several studies have been devoted to examining the relationship between PLI and some physical and mechanical properties of rocks. Topal (2000) studied the problems related to the PLI device and its application. Aston, MacIntyre, and Kazi (1991) investigated the effects of wear and rupture on the strength of the conical platens of the PLI testing device. Akbay and Altindag studied the errors inherent to the PLI testing device and the errors caused by the operator (2018), and Akbay (2018) modified the conventional PLI testing device to avoid the errors. In addition, several other researchers have used PLI values to determine the UCS and tensile strength of rocks, to classify rocks according to their strength in terms of material properties (Guidicini, Nieble, and De, 1973; Bieniawski, 1975) in the RMR rock classification system (Bieniawski, 1989), to estimate the speed of a tunnel boring machine (McFeat and Tarkoy, 1979), and to classify rocks in terms of excavatability (Pettifer and Fookes, 1994). Karaman, Kaya, and Kesima (2015) estimated UCS by using the PLI for RMR classification. Broch and Franklin (1972) stated that the UCS value of rocks is 24 times the PLI value. Hawkins (1998) investigated the relationship between UCS and PLI using different rock types and found that the ratio between the two (UCS/PLI) varied from 7-68. Rusnak and Mark (2000) examined the ratio between UCS and PLI and found it to be between 20 and 22. Quane and Russel (2003) carried out UCS and PLI tests on hard and soft rocks, and observed that the relationship between UCS and PLI is linear in hard rocks and nonlinear in soft rocks. Singh, Kainthola, and Venkatesh (2012) studied the ratio between UCS and PLI using similar hard and soft rocks and observed that the ratio was between 21 and 24 in hard rocks and 14 and 16 in soft rocks. It is thus seen that the conversion coefficients (K) used to predict UCS from PLI vary between 3 and 71 (Akbay, 2018). The K value depends on many factors such as rock type, shape of the specimen, test method, etc. Table I presents a simplified list of K values for different rock strength classes.
There are several companies marketing PLI testing devices around the world, but very few manufacturers. There are also more than 100 different PLI testing devices. The general principles of the measurement technique and design are very similar; however, there are minor differences such as the hydraulic system, position of the hydraulic system (horizontal or vertical), loading arm, indicator (mechanical or digital), and specimen location (fixed or free). The most widely used PLI testing device consists of a loading system, load indicator, and conical platens (Figure 1).

In this study, problems related to the PLI testing device and the common errors generated by the operators are considered. Based on the experience of the researchers and a literature review, differences in loading speed and failure time, maintenance issues, dial gauge calibration, geometry of the conical platens, axis shift of the conical platens, length of the loading arm, and different operators are identified as sources of error. PLI tests were carried in 15 different testing devices using seven different rock types (three sedimentary, one metamorphic, three magmatic) by the same operator and the errors obtained were studied and described based on the results. In this study, a conventional PLI testing device was modified to eliminate the errors and disadvantages. For each rock type, seven different specimens of the same size were tested uniformly at constant loading speed and the PLI values were recorded. The differences between the conventional PLI testing device and the modified device were demonstrated.
Materials and method
Rock samples tested in this study were obtained from stone processing plants situated in different regions in Turkey (Table II) and were prepared in compliance with the standards suggested by ISRM (1985, 2007). Studies were performed in the Natural Stone Technology and Excavation Mechanics Laboratory of the Mining Engineering Department at Suleyman Demirel University. Specimens used in the tests were classified in such a way that a low to high strength scale was formed in order to be able to represent the rocks with different strength values.

Prismatic specimens 30 χ 50 χ 50 mm in size were prepared from rock types selected as being as homogeneous and isotropic as possible. In order to avoid differences due to depth, the test samples were prepared from 30 mm thick slabs cut horizontally from the same block. The block samples were examined for macroscopic imperfections so as to ensure standard testing samples free of cracks and weathering. In order to ensure the homogeneous distribution of the samples between the 15 different testing devices in terms of structural properties, samples with the same number of visible structural defects were classified and distributed equally on each testing device. For each testing device, 10 specimens were prepared from each rock sample. Diagonal lines were drawn on the prismatic specimens so that the operator could perform the loading operation at the exact midpoint of the specimen (Figure 2). During the laboratory work, more than 1500 specimens were tested.

The tests were carried out in 15 different PLI testing devices, by the same operator, according to the standards suggested in ISRM (1985, 2007). The PLI devices were of eight different brands. Six of the devices had mechanical dial gauges and nine had digital gauges. The conical platens used in the devices were of five different geometries.
Prior to the tests, the standards (ISRM, 1985, 2007, ASTM, 1995, 2008) relating to the PLI test were scrutinized. A preliminary study was performed and some observations were made (Figure 3). The available information from the literature regarding the problems and difficulties encountered were combined with the observations from the preliminary study. Some measurements were conducted before conducting the experiments, considering the issues specified in the standards (ISRM, 1985, 2007). These were:

> Calibration (load indicator) control: a load cell and an indicator were used to control the calibration of the testing devices
> Hardness value measurement of conical platen: A micro-hardness testing device was used.
> The angle of conical platens and spherical radius of the tip: Photographs of the conical platens were taken and examined digitally using autocad software package and the radii were calculated.
> Length of the loading arm: All loading arms were measured using a length measuring device.
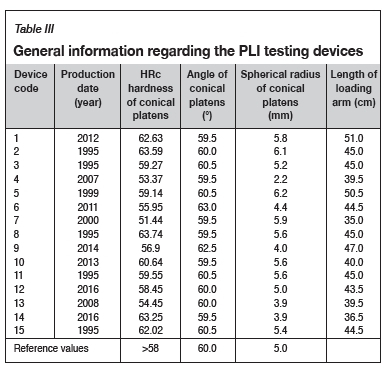
All measured parameters of the PLI devices are given in Table III. The conical platens used in the devices had a spherical radius between 2.2 and 6.2 mm, and hardness values varying between 51 and 64 HRc. The loading arm lengths ranged from 35 cm to 51 cm.
Errors in point load index test
Loading speed and discrete loading
The loading process is performed manually in PLI devices, hence the magnitude and continuity of the applied force varies according to the operator As suggested by ISRM, the load should be steadily increased such that failure occurs within 10-60 seconds (ISRM, 1985, 2007). The failure load varied in a nonuniform manner according to the loading speed. The
loading speed should be kept constant during the entire test. If the loading process is too fast, the PLI load will be higher than normal, if too slow, lower.
Failure time
Many researchers do not pay attention to the failure time. If the test process is completed in less than 10 seconds or more than 60 seconds (i.e. the loading process is too fast or too slow), the 'failure load of the rock' is measured higher or lower than it is supposed to be. As such, the test process should be completed within 10 to 60 seconds. When the loading is too fast or too slow it will cause the rock to fail at higher or lower loads, respectively, than it would otherwise.
Lack of periodical maintenance
The maintenance of the testing devices was not carried out periodically. Non-calibrated load indicators (dial gauges), worn conical platens, and oil loss affect the PLI values.
Use of different types of jacking systems
PLI testing devices are not very expensive, so the device selected by the manufacturer is chosen from among the least expensive (but workable) equipment. This will lead to the use of devices that are not long-lasting, and which also lack quality and precision. In the different brands of PLI devices that are available in the market, the manufacturers use jacking systems supplied from other companies, which leads to the use of jacks with different characteristics (e.g. different loading capacities).
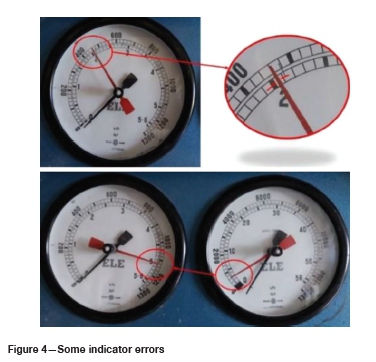
Dial gauge (indicator) errors
Precision readings of failure load cannot be performed on mechanical dial gauges. PLI testing devices with mechanical indicator have two dial gauges, one of which has a capacity of 5.5 kN and a sensitivity of 0.1 kN while the other has a capacity of 55 kN and a sensitivity of 1 kN. If the dial gauges are not calibrated to each other, they can indicate different values. Determination of the failure load may be up to the operator, e.g. the indicator is not automatically set to zero, so the two indicators may not be synchronized (Figure 4).
Conical platen geometry
According to the standards suggested by ISRM (1985, 2007), the conical platens should have an angle of a = 60° and the tip should have a sphericity of 5 mm (Figure 5). Use of non-standard conical platens will cause the results to differ from the true values. If the conical platen tip has a sphericity of more than 5 mm, the PLI load will be higher than normal, otherwise, lower.

Distortion of conical platens from axis
In the ISRM standards (1985, 2007), it is suggested that the platens should remain coaxial within ±0.2 mm throughout testing (Figure 6). In general, if this condition is not fulfilled, the test is not carried out under appropriate conditions. In this case, the test result will not be correct, and furthermore there is a risk to the operator that the specimen may be ejected from the device uncontrollably.

Penetration of the conical platens into the specimen in the case of soft or weak rocks
When testing soft or weak rocks, the conical heads are allowed to penetrate into the sample (Figure 7), and compression is initiated after the heads have penetrated a certain distance, not as soon as the contact with the sample is established. Therefore, some researchers have suggested that the distance between the conical platens at the end of the test should be taken into account when PLI is calculated, instead of the measured thickness of the specimen.

Effect of the length of loading arm (jack)
ISRM (1985, 2007) and ASTM (1995, 2008) make no suggestions as to the length of the loading arm of the PLI testing device. Loading arms of various lengths are available in different testing devices (Figure 8).and hence the moment effect will vary. The loading process will be unbalanced if the loading arm is longer or shorter than it is required to be. In this case, the tests will not yield accurate results.

Effect of different operators
Determination of the PLI requires a laboratory experiment in which physical activity is needed. In case of the PLI test, the loading process is done manually, hence the magnitude and continuity of the applied force will vary depending on the operator. This means that there will be several factors such as age, level of experience, strength of the operator, different moods (calm, hasty, nervous, sad, preoccupied etc.) that may affect the performance in a positive or negative manner). This may result in different loading speeds, different failure times, and different dynamic situations for each test.
Modified point load index testing device
As outlined above, some of the errors or disadvantages of the device will cause the testing results to indicate higher or lower values than the true values. Some PLI testing devices embody all the errors and disadvantages stated above, while others have only a few of the shortcomings. In fact, It is difficult to predict how the measured values will deviate from the true values when all of those errors and disadvantages are combined. The 'operator factor' probably constitutes the most important factor since it is difficult to calculate its influence on PLI values. When the effect of the operator on the results is added, prediction of the changes in measured values will be impossible, but the influences of other factors can be corrected if the operator factor is eliminated. Hence, the truest value of the appropriate reading can be obtained.
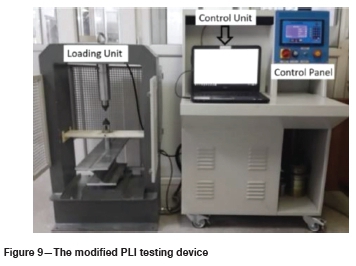
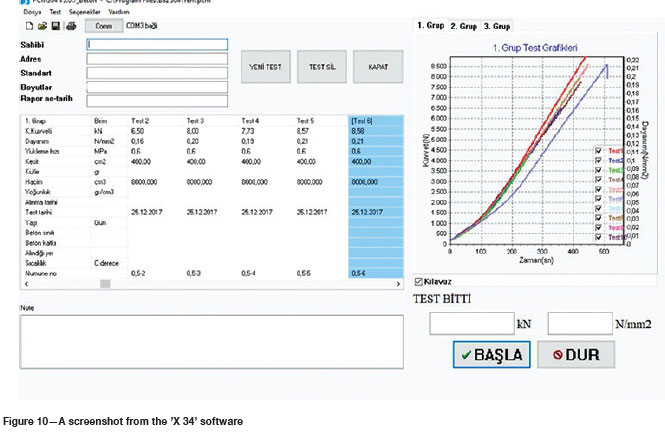
A modification to the PLI testing device was made to eliminate the errors and disadvantages caused by the device and the operator (Figure 9). The device was modified to perform computer-controlled automatic loading in accordance with the standards recommended by ISRM (1985, 2007). The modification comprises two main parts: a hydraulic loading section and a control panel. Sensitive readings are acquired by a digital gauge. The loading process is controlled by a computer using 'X 34' software (Figure 10). The loading process can also be controlled manually from the control panel on the device. With the help of the software, the maximum load and the load-time graph can be displayed on the computer screen. In addition, data from up to 30 tests can be stored and transferred to the computer. Also, an instantaneous load-time graph can be displayed and the ultimate failure load read from the screen. The modified PLI testing device has a loading capacity of 200 kN. The conical platens of the modified device conform to ISRM standard (r = 5 mm and a = 60°) (Akbay, 2018).
Results
Determination of physical and mechanical properties
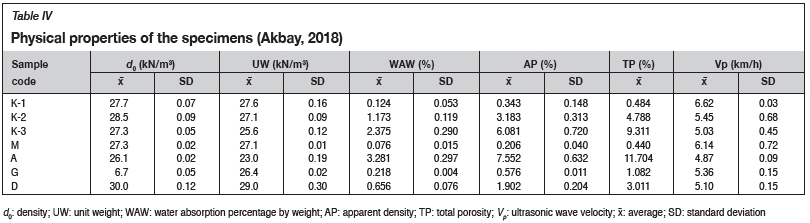
The physical and mechanical properties of the rocks tested in this study were determined according to the Turkish Standards Institution (TSE) and International Society for Rock Mechanics and Rock Engineering (ISRM). The unit volume weight (TS EN 1936, 2010), water absorption by weight and volume (TS EN 13755, 2014), apparent and total porosity (TS EN 1936, 2010), density (TS EN 1936, 2010), seismic velocity (TS EN 14579, 2006), wear resistance (TS EN 14157, 2017), Schmidt hammer (L-type) rebound number (ISRM, 2007), uniaxial compressive strength (TS EN 1926, 2013), indirect tensile strength (Brazilian tensile strength) (ISRM, 2007), modulus of rupture (TS EN 12372, 2013), and flexural strength (TS EN 13161, 2014) tests were carried out. At least ten specimens were used for each test on each rock type. The summarized data is given in Table IV and Table V.

Tests with the modified PLI testing device and justification of the results
The loading speed was set so that all the specimens were broken within the time specified in the standard (ISRM, 1985, 2007). The loading speed is adjusted by the potentiometer on the control panel. Throughout the experiments, the failure time was observed to be around 60 seconds for the strongest rock and around 30 seconds for the weakest.
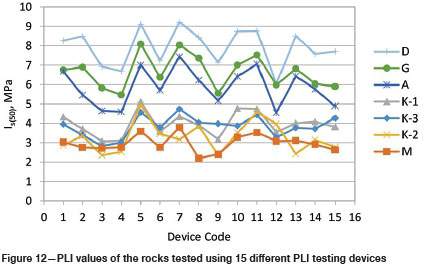
Table VI shows the average and standard deviations of the point load index values obtained using 15 different devices for seven different rock types. It can be seen that the difference between the minimum and maximum PLI values is almost 40% (Figure 11). The scatter of the PLI values appears to be high, which shows that it is not possible to determine the actual invariant PLI that represents the particular rock (Figure 11). It will be reasonable to use average PLI values obtained from 15 different PLI testing devices. Figure 12 shows that each testing device has its own characteristics, owing to the fact that higher or lower PLI values are obtained in the same device. The fluctuations in PLI values may be explained by the different HRc hardnesses of conical platens, angles of conical platens, rounding radius of conical platens, and lengths of loading arm as shown in Table III. Although all the experiments were performed by the same operator, it appears that the standard deviations will be within acceptable limits.


If the experiments were carried out by different operators, in addition to the parameters stated above, operator-induced variations in the results (due to age, gender, physical fitness, stress level, nutrition, ergonomics, health situation, fatigue etc.) would also be relevant. Although the experiments were performed by the same operator, different conditions during the day may have caused the variations in PLI values. Therefore, the relevance of all the factors, regardless of their origin, operator or the device, must be evaluated together. Hence, causes of the decrease in a PLI value for a particular specimen should not be explained by the rounding radius of the conical platens or any other factor in isolation.
It is obvious that the PLI values obtained as a result of the experiments performed on different devices by different operators on a more heterogeneous rock will have much wider range of scatter. Therefore, by using the point loading strength value, it is obvious that in the equations used in prediction of compressive strength of the rocks, very different strength values will be obtained. Likewise, it is obvious that this will lead to different values in the determination of rock mass classification systems where the PLI is used. With these considerations, as a result of the experiments carried out by different users in PLI testing devices with non-standard or different technical properties, the actual PLI of the rock cannot be determined. In this context, operator differences may cause different loading speeds. To eliminate the influence of loading speed on the PLI value, the modified testing device was designed in order to ensure uniform loading under computer control. When the same operator repeated the experiment on another PLI testing device for various testing durations between 10 and 90 seconds, the duration for failure was nearly the same (±5 seconds) as with the modified testing device. Also, standard deviations of failure loads were very small compared to other testing devices. Experiments were carried out on 10 specimens for each rock type in the modified PLI testing device. The results are given in Table VII. It can be seen that difference between minimum and maximum PLI values is almost 30%. Also, standard deviations of the PLI values from the modified testing device were significantly smaller than those from conventional devices. It is obvious that the PLI values obtained from the modified testing device are higher than those obtained from the averages of 15 different testing devices, except for 'K-2' and 'A' coded samples (Figure 13). Also, the PLI values were found to be close for both data groups. This implies that the PLI values of the rocks are represented by two data groups. In Figure 13, the standard deviations of the PLI values obtained from the modified PLI testing device are clearly lower than those obtained from a conventional PLI testing device. It is clear that the PLI values obtained from the modified device are more reliable.


Prediction of uniaxial compressive strength using point load index
Numerous studies have been conducted to estimate the UCS using the PLI value, and various equations have been proposed by means of statistical analyses and artificial intelligence (AI) methods utilizing experimental data. Researchers have determined conversion coefficients (K) and examined the problem by grouping the rocks according to geological origin, strength class, and porosity value to obtain more meaningful outcomes.
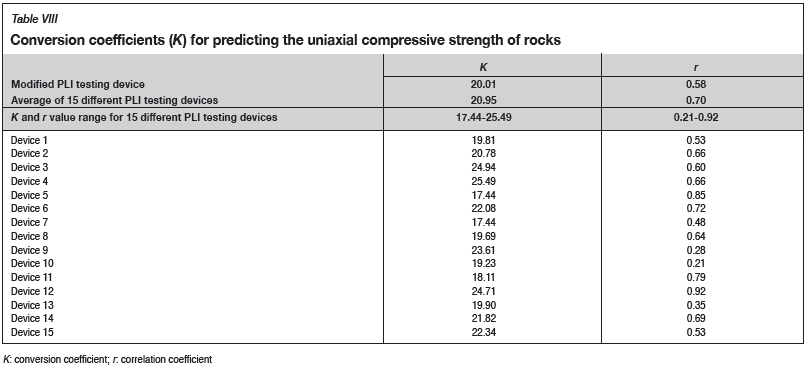
The conversion coefficients (K) were determined by graphical method (Table VIII). All the experiments were performed by the same operator on 15 different PLI testing devices, so the user effect can be eliminated. The average K values calculated from both the modified PLI testing device and the results from 15 different PLI testing devices are found to be very close. Conversion coefficients (K) obtained by averaging the results of 15 different testing devices vary between 17.44 and 25.49. Also, the correlation coefficients (r) were found to vary in a wide range (0.21-0.92). If the effects caused by different operators are taken into account, these values will spread in a wider range. The conversion coefficient (K) obtained from the modified device is 20.01 and is very close to the mean K value obtained from the average of the results of 15 different PLI testing devices. This may imply that PLI tests have to be performed on many different conventional testing devices in order to obtain a reliable result. This, however, also means that more samples must be prepared and more time spent on data acquisition. It can be seen in Table VIII that device 12 yielded the highest r value, and devices 9 and 10 the lowest. It will always be debatable as to which device should be used in the determination of the true PLI value.
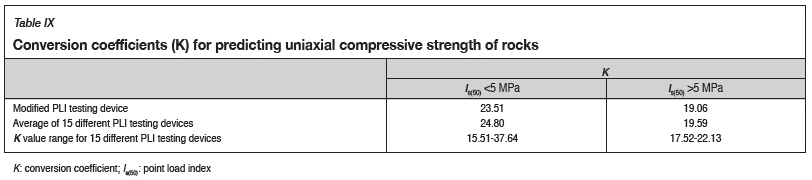
Table VIII also suggests that some PLI testing devices may not be reliable, as seen in the wide range of results. It should be noted that K values found in this study are close to those published in the literature. It can also be observed that K values should be determined separately for each rock type (Table IX).
Discussion and conclusion
PLI is known as an engineering design value that is simple, quick, cheap, and easy to determine and requires less time to prepare test specimens than other tests. Moreover, the PLI value is used to estimate the uniaxial compressive strength of intact rock. However, PLI values obtained from conventional testing devices may be questionable owing to the errors arising from different devices and operators. Hence, in order to obtain more accurate and more sensitive results, conventional testing devices need modifying in line with the ISRM suggested methods (1985, 2007) to eliminate the errors and disadvantages related to conventional devices and different operators. This is extremely important to ensure that correct values of rock strength are determined for rock engineering design purposes, and for contractual information to avoid contract disputes.
In this study, PLI tests were performed on seven different rock types using 15 different PLI testing devices. The errors arising from conventional PLI testing devices are generally due to the following:
> Loading speed and discrete loading
> Time to failure (too long or too short)
> Lack of regular maintenance
> Use of different types of jacking system
> Indicator errors
> The geometry of the conical platens
> Distortion of conical platens from axis
> In soft or weak rocks, penetration of the conical platens into the specimen
> The effect of the length of loading arm (jack)
> The effect of different operators.
Seven different rock types were classified according to the strength classification suggested by Bieniawski (1974). For M-, A-, G-, and D-coded rocks, the strength class does not change for three different strength values. However, limestones coded K-1, K-2, and K-3 have been placed in a different rock class owing to the difference of ±0.22 MPa in the value of Is(50). This emphasizes the importance of how precisely Is(50) has to be determined. If there is 10 to 15% change in the specified Is(50 value this may not necessitate any class change if the strength of the rock is not too close to the limit/transition value. However, especially in weak and very weak rocks (<2 MPa) the changes in these ratios will cause the rock to be shifted into another class.
Hence, in this study, it is emphasized that determination of Is(50) values under constant load and speed and without operator effect is of great importance, especially for very weak and weak rock groups. Although the rocks used in this study were intact and in the medium strength class, there are significant differences in the experimental method and the results. It is understood that these differences, and the effects thereof, will be more pronounced in weak or very weak rocks.
The mean PLI values obtained from 15 different PLI testing devices and the conversion coefficients (K) were very close to the values acquired from the modified PLI testing device. However, the correlation coefficients of the values obtained from 15 different devices were found to have a high degree of scatter. Although all the experiments were performed on the same samples by the same operator using the 15 different PLI devices, the standard deviations in the PLI values were higher than anticipated. The higher standard deviation values can therefore be ascribed to errors inherent in the conventional testing devices. On the other hand, standard deviations in the PLI values obtained from the modified testing device were lower, and the correlation coefficients were found to be high and very significant. Based on these facts, the modified PLI testing device can be recommended as yielding more reliable results than conventional testing devices.
PLI testing is used to estimate the strength of intact rock and can be applied in both the laboratory and in the field. As is well known, the distribution of the data obtained from laboratory and field tests may vary. The PLI testing method should be applied in a laboratory in cases where standard test specimens cannot be prepared to determine the uniaxial compressive strength of an intact rock. Hence, the PLI test becomes very useful for estimating the strength of intact rock. Several researchers have commented on the difficulties encountered in preparing specimens for the determination of UCS value in weak rocks. In such cases, the use of a PLI testing device will become invaluable for the determination of the strength of intact rocks. It has often been reported that care must be taken in the determination of the strength of weak rocks. The modified PLI testing device has the advantage of being able to appropriately test weak rocks. Conventional portable PLI testing devices can still be used to predict the strength of intact rocks, despite the known errors and disadvantages mentioned in this study.
This study has demonstrated that variations in PLI values depend on the test device and testing method. Hence, the reliability of the PLI values obtained may be questioned. In this investigation, a total of 154 scientific studies were examined in detail. Only four of the studies were seen to include the data of the PLI tests implemented in the field. In other words, only 2.5% of the studies conducted on PLI testing were actually carried out in the field.
Acknowledgment
This study was supported by the Scientific and Technological Research Council of Turkey (TUBITAK) Project 116R070 and Süleyman Demirel University OYP Coordination Unit Project OYP-05286-DR-13. The authors would like to thank TUBITAK and SDU OYP Project Coordination Unit.
References
Akbay, D. 2018. Designing a new testing apparatus for preventing the errors in point load index test. Doctoral thesis, Süleyman Demirel University, Isparta, Turkey. http://dspace.sdu.edu.tr/xmlui/handle/123456789/31140 [ Links ]
Akbay, D. and Altindag, R. 2018. Determination of the errors arising from apparatus and operator during applying the point load index. Geomechanics and Geodynamics of Rock Masses. Proceedings of the 2018 European Rock Mechanics Symposium. Taylor & Francis. pp. 181-188. [ Links ]
ASTM. 1995. Standard test method for determination of the point load strength index of rock. American Society for Testing and Materials, West Conshohocken, PA. pp. 1-9. doi: 10.1520/D5731-08.2 [ Links ]
ASTM. 2008. Standard test method for determination of the point load strength index of rock and application to rock strength classifications. American Society for Testing and Materials, West Conshohocken, PA. pp. 1-11. [ Links ]
Aston, T.R.C., MacIntyre, J.S., and Kazi, H.A. 1991. The effect of worn and chipped points on point load indices. Mining Science and Technology, vol. 13. pp. 69-74. [ Links ]
Bieniawski, Z.T. 1974. Estimating the strength of rock materials. Journal of the South African Institute of Mining and Metallurgy, March. pp. 312-320. doi: 10.1016/0148-9062(74)91782-3 [ Links ]
Bieniawski, Z.T. 1975. The point-load test in geotechnical practice. Engineering Geology, vol. 9, no. 1. pp. 1-11. doi: 10.1016/0013 [ Links ]
Bieniawski, Z.T. 1989. Engineering Rock Mass Classifications. Wiley, New York. [ Links ]
Broch, E. and Franklin, J.A. 1972. The point-load strength test. International Journal of Rock Mechanics and Mining Sciences, vol. 9. pp. 669-697. [ Links ]
Broch, J.A., Broch, E., and Walton, G. 1971. Geological Society Working Party Report. The logging of rock cores for engineering purposes. Quarterly Journal of Engineering Geology andHydrogeology, vol. 4, no. 2. pp. 131-132. https://doi.org/10.1144/GSL.QJEG.1971.004.02.04. [ Links ]
Edet, A.E. and Teme, S.C. 1990. Strength classification of some Nigerian limestones using the point load testing technique. Bulletin of the International Association of Engineering Geology, vol. 41, no. 1. pp. 97-106. doi: 10.1007/BF02590210 [ Links ]
Franklin, J.A., Broch, E., and Walton, G. 1971. Logging the mechanical character of rock. Transactions of the Institution of Mining and Metallurgy, Section A, vol. 80(A). pp. 1-9. [ Links ]
Ghosh, D.K and Srivastava, M. 1991. Point-load strength: An index for classification of rock material. Bulletin of the International Association of Engineering Geology, vol. 44. pp. 27-33. doi: 10.1007/BF02602707 [ Links ]
Guidicini, G., Nieble, CM., and De, C.A.T. 1973. Analysis of point load test as a method for preliminary geotechnical classification of rocks. Bulletin of the International Association of Engineering Geology, vol. 7, no. 1. pp. 37-52. [ Links ]
Hawkins, A.B. 1998. Aspects of rock strength. Bulletin of Engineering Geology and the Environment,vol. 57, no. 1. pp. 17-30. doi: 10.1007/s100640050017 [ Links ]
ISRM. 1985. Suggested method for determining point load strength. pp. 53-60. [ Links ]
ISRM. 2007. The complete suggested methods for rock characterization, testing and monitoring: 1974-2006. Suggested Methods Prepared by the Commission on Testing Methods. Ulusay, R, and Hudson, J.A. (eds). [ Links ]
Karaman, K., Kaya, A., and Kesimal, A. 2015. Use of the point load index in estimation of the strength rating for the RMR system. Journal of African Earth Sciences, vol. 106. pp. 40-49. doi: 10.1016/j.jafrearsci.2015.03.006 [ Links ]
McFeat-Smith, I. and Tarkoy, P.J. 1979. Assessment of tunnel boring machine performance. Tunnels and Tunnelling, vol. 11, no. 10. pp. 33-37. [ Links ]
Pettifer, G.S. and Fookes, P.G. 1994. A revision of the graphical method for assessing the excavatability of rock. Quarterly Journal of Engineering Geology, vol. 27. pp. 145-164. [ Links ]
Ouane, S.L. and Russell, J.K. 2003. Ranking welding intensity in pyroclastic deposits. European Journal of Mineralogy, vol. 15. pp. 855-864. doi: 10.1007/s00445-004-0367-5 [ Links ]
Rusnak, J. and Mark, C. 2000. Using the point load test to determine the uniaxial compressive strength of coal measure rock. Proceedings of the 19th International Conference on Ground Control in Mining, Morgantown, West Virginia, 8-10, August 2000. [ Links ]
Peng, S.S. and Mark, C. (eds). College of Engineering and Mineral Resources, West Virginia University. pp. 362-371. [ Links ]
Singh, T.N., Kainthola, A., and Venkatesh, A. 2012. Correlation between point load index and uniaxial compressive strength for different rock types. Rock Mechanics and Rock Engineering, vol. 45, no. 2. pp. 259-264. doi: 10.1007/s00603-011-0192-z [ Links ]
Topal, T. 2000. Nokta yükleme deneyi ile ilgili uygulamada karsilasilan problemler. Jeoloji Mühendisliggi, vol. 24, no. I. pp. 73-86. [ Links ]
TS EN 14579. 2006. Natural stone test methods - Determination of sound speed propagation. Turkish Standards Institution, Ankara. [ Links ]
TS EN 1926. 2013. Natural stone test methods - Determination of uniaxial compressive strength. Turkish Standards Institution, Ankara. [ Links ]
TS EN 12372. 2013. Natural stone test methods - Determination of flexural strength under concentrated load. Turkish Standards Institution, Ankara. [ Links ]
TS EN 13161. 2014. Natural stone test methods -Determination of flexural strength under constant moment. Turkish Standards Institution, Ankara. [ Links ]
TS EN 13755. 2014. Natural stone test methods - Determination of water absorption at atmospheric pressure. Turkish Standards Institution, Ankara. [ Links ]
TS EN 14157. 2017. Natural stone - Determination of the abrasion resistance. Turkish Standards Institution, Ankara. [ Links ]
TS EN 1936. 2010. Natural stone test methods - Determination of real density and apparent density and of total and open porosity. Turkish Standards Institution, Ankara. [ Links ]
Tsiambaos, G. and Saroglou, H. 2010. Excavatability assessment of rock masses using the Geological Strength Index (GSI). Bulletin of Engineering Geology and the Environment, vol. 69, no. 1. pp. 13-27. doi: 10.1007/s10064-009- 0235-9 [ Links ]
 Correspondence:
D. Akbay
denizegeakbay@hotmail.com
Received: 21 May 2019
Revised: 31 Nov. 2019
Accepted: 2 Dec. 2019
Published: March 2020

