


Services on Demand
Article
 English (pdf)
 Article in xml format
 Article references
Indicators

Related links
-
 Cited by Google
 -
 Similars in Google
Share

 Permalink
Journal of the Southern African Institute of Mining and Metallurgy
On-line version ISSN 2411-9717
Print version ISSN 2225-6253
J. S. Afr. Inst. Min. Metall. vol.120 n.3 Johannesburg Mar. 2020
http://dx.doi.org/10.17159/2411-9717/665/2020
PAPERS OF GENERAL INTEREST
Monitoring unstable slopes in an open pit lignite mine using ARIMA
H. Özşen
Konya Teknik University, Department of Mining Engineering, Konya, Turkey
SYNOPSIS
Slope stability is a widely studied area because of the significant consequences of slope failure. There are various factors affecting slope stability in open pit mines, and predicting the time of failure can be difficult due to the complex nature of the rock mass. Regression methods are often used in this prediction process, but they are limited in that they use a strict mathematical model. Therefore, possible future changes within the structure of a slope can be underestimated because once a mathematical model has been established to predict slope failure, it is then used indefinitely. For this reason, an autoregressive integrated moving average (ARIMA) model is used in this study as a time series analysis (TSA) method for the prediction of slope failure. Data obtained from the movements of tension cracks from six out of ten established stations in Ilgin open pit lignite mine of Turkish Coal Enterprises, West Lignite Enterprises (TKI-GLI) were used to predict future values. The prediction results from the ARIMA method were also compared with results from regression methods and were shown to be more successful.
Keywords: slope failure, open pit mining, time series analysis, autoregressive integrated moving average (ARIMA), regression.
Introduction
Slope stability is an important aspect in a broad range of areas, such as mining, geology, construction, and architecture. It is critical in open pit mines. Many factors such as geological structural properties, the geometry of the slope, the presence of underground water, the properties of materials used, and excavation methods affect slope stability. The consequences of a possible slope failure can be both fatal to personnel and damaging to the mine. Thus, the necessary calculations and analyses should be carried out within certain time intervals. However, this is a complex process which requires experienced professionals. For these reasons, many studies conducted to predict problems with slope stability have used methods other than the classical calculation methods. Regression-based methods are the most preferred because of their simple, explanatory structure and high suitability for measuring these kinds of problems.
Occhiena, Pirulli, and Scavia (2014) developed an analysis procedure to interpret data from a microseismic monitoring system. Gama et al. (2017) investigated small baseline subsets for measuring ground deformation and found that SBAS processing allowed the identification of a large number of widely distributed persistent scatters. Another example of a monitoring application relating to this area is from Carlà et al. (2017a), who used monitoring data from open pit mines to detect instabilities. There are other applications in which researchers have pursued the monitoring of deformations in the slopes (Fuhrmann et al., 2013; Vanneschi et al. 2017). Some researchers have gone one step further in their follow-up studies and have tried to develop methods for estimating deformations that may arise from the available data using different methods (Carlà et al., 2017b; Jibson, 2011; Song, Huang, and Cen, 2016; Khanlari, 2011).
Regression-based methods are among the most preferred modelling strategies used to predict deformation. The rationale behind using regression in predicting slope failure is that a mathematical model is constructed and parameters of that model are estimated using regression methods. However, although regression is a straightforward method, it does have drawbacks: each slope embodies its own characteristics; a mathematical model used for one slope would not fit another. Thus, the appropriate model should be selected first, and then its parameters found. Experience in model selection is, therefore, essential. The other limitation of regression lies in its dependence on strict mathematical formulae. Once a mathematical model by regression is built up to model the structure of a slope, it is used for all future estimates of slope condition. However, several factors, which are expressed as shock effects, can occur and change the structure of the slope. These include heavy rainfall and earth tremors. In that case, the modelled mathematical expressions lose their validity.
For the abovementioned reasons, researchers have started to experiment with other methods of slope stability analysis. Wu et al. (2015) successfully used an improved fractal prediction model in forecasting mine slope deformation. Tan et al. (2011) utilized artificial neural networks (ANNs) and particle swarm optimization to predict deformation in a deep open pit mine. They showed the applicability of these methods by calculating RMSE (root mean square error) and MAVE (mean average value error). These values for two measurement points were found between 3% and 6%. Lian et al. (2013) conducted a landslide prediction by using an ensemble extreme learning machine (ELM) based on TSA. They used 38 groups of data from June 2004 to July 2007 and their relative errors in seven test data were between 0.03 and 3.17%. Liu et al. (2014) compared three state-of-the-art techniques for nonlinear displacement analysis - support vector machine (SVM), relevance vector machine (RVM), and Gaussian process (GP) - using 11 observations from September 2006 to July 2007. They recorded approximate average percentage errors in these methods of between 0.4% and 0.8%. Another ANN application in this area was conducted by Chen and Zeng (2013), who used an improved back-propagation ANN and obtained relative errors between 0.05% and 3.83%.
As mentioned above, regression-based methods have some significant drawbacks. ANNs and other state-of-the-art methods also have their own disadvantages. For example, they require a greater amount of data than that collected in the cited studies for statistically meaningful results in training. Furthermore, as with the regression methods, they can be affected by shock effects. Thus, a time series method, ARIMA, is the preferred method of prediction in this study. ARIMA is based on the autoregressive moving average (AR-MA) process and predicts a new value by using 'some' previous values of a time series data group. It also relies on a mathematical model, but that model does not cover all of the data. It stands for 'some' previous data to predict a new future value. By this aspect, it can cope with shock effects. In addition to this, the only thing that should be found is the model order and not what kind of mathematical model fits the data. Therefore it is easier than regression in that less experience is needed.
Data obtained from six stations in TKI-Ilgin open pit lignite mine was used in this study to predict future deformation values. The ARIMA model was created with 50 deformation data values and six data values were used to validate the prediction capability of the model. The correlation coefficient (R2) and root mean square error (RMSE) of fits were calculated to compare different ARIMA models. RMS and predicted MSE (PMSE) in validation were also recorded to gauge the effectiveness of the models. To compare ARIMA with regression, the regression models of all six stations were also established. In addition to this, a manually created shock effect was also analysed for station-1 to show the deficiency of regression in incorporating that phenomena. The results give comparatively fewer errors in ARIMA models.
Materials and methods
Problem definition
The tension cracks on the west slope of TKI-GLI Çavuşçugöl open pit mine were observed with a tracking system (Özşen, Özkan, and Mesutoglu, 2019; Özşen and Özkan, 2013). Çavuşçugöl is located in central Anatolia, 13 km from Ilgin and 80 km from Konya. In the west slopes of the site, there were tension cracks approximately 10 m in length, 20 cm wide, and 50 cm in height as seen in Figure 1 (Özşen and Özkan, 2013). To track these cracks, 10 measurement stations were established. The measurement equipment and method are shown in Figure 2a. A plan view of the mine site and the measurement directions are shown in Figure 2b. Here, the horizontal deformations towards the pit are defined by the Y direction while deformations parallel to the pit are defined by the X direction. Vertical deformations are defined by Z direction. Readings were taken with a precision of 0.01 mm in the Z direction and 0.1 mm in the X and Y directions.


The readings were taken over a period of 56 days and the deformation values relative to the first reading were recorded in the X, Y, and Z directions. The model in this study was constructed for the Y-direction deformations. That is, the amounts of deformation towards and away from the mine were modelled and predictions of possible deformations in that direction were attempted. Also, data from six stations of the ten established stations was used in the study because of its suitability for the ARIMA model.
ARIMA as a TSA method
In TSA, the intention is to predict unobserved data by using observed data that changes with time. A time series data group can be defined as:

Here, predictions of T observed values of the data and unobserved data values in time T + k were attempted: zT+k. Let T (k) be a predictor of zT+k and be defined as:
If eT(k) is defined as the error of this prediction, it can be defined as:

The aim is to minimize error functions which depend on eT(k). The most used error function is the mean square prediction error (MSPE), which is defined as:

There are many methods in TSA, such as moving average, random walk, exponential smoothers. and ARIMA models.
Especially for stochastic modelling of time series data, ARIMA could be the best choice. Generally, moving average (MA) models can define trends in data while autoregressive (AR) models are well suited for periodicity such as seasonal variances. An AR model of a time series data group x can be defined as (Kaiser and Maravall, 2000):

Here, p is defined as the model order. In the MA model, the error is modelled as given in the following equation (Kaiser and Maravall, 2000):

If a time lag operator is defined as:


AR and MA processes can be given as in the following equations (Kaiser and Maravall, 2000):

This equation is known as the autoregressive moving average (ARMA) process and is used in many areas such as TSA. ARIMA can be thought of as a kind of ARMA process. The only difference is the differencing operation, which is an indispensable part of TSA methods to eliminate trend components. The differencing operation can be represented as:
Now the main equation for the ARIMA (p, d, q) model can be given as (Kaiser and Maravall, 2000):

The only parameters to determine in this model are p, d and q, which represent the model degree of the AR process, the degree of differencing, and the model degree of the MA process, respectively.
Analysis methodology and evaluation criteria
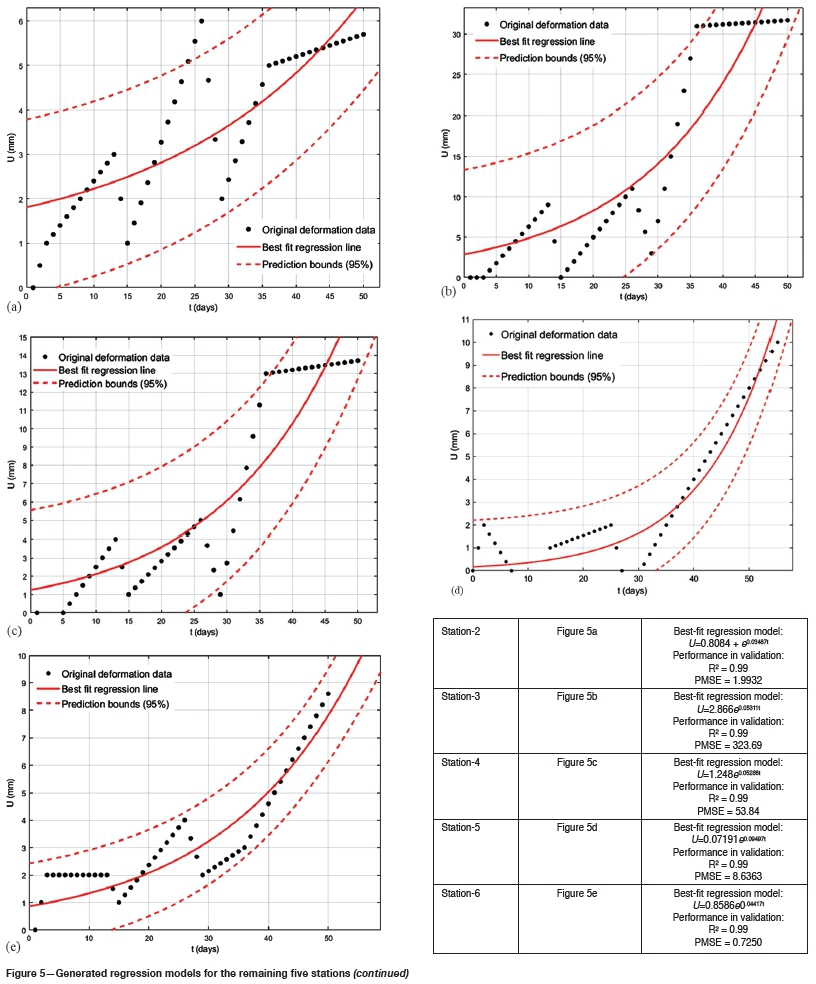
The data taken from the six stations over a period of 56 days was used for modelling by ARIMA. For each station, different ARIMA models were tested and the best-suited model was recorded. Also, for all stations, a regression process was conducted for comparison. Here again, the best-suited regression line was found. A total of 50 data values were used for model foundation while the remaining six data values were used as validation data for the founded model. The comparison between ARIMA models and the best-suited regression model was done using the correlation coefficient (R2) and predictive mean square error (PMSE: same as MSPE). The correlation coefficient can be calculated by the following equation:
Results
Results with ARIMA models
For the first station's data, which is termed data-1, five ARIMA models were tested using data from 50 days (deformation values in the Y directions). After testing the generated models with remaining six data groups, the correlation coefficient (R2) and PMSE were recorded, and are shown in Table I. As shown in Table I, the best fit model is ARIMA (3,1,1), which represents a combination of a third-order AR process, first-order MA process, and one-degree differentiation. The obtained parameters of the best fit ARIMA model are seen in Table II.


To compare the success of ARIMA in modelling data-1, a regression procedure was also conducted for data-1. After some experimentation, the best fit equation for the 50 data values in data-1 was found to be:

Here, U is the deformation value in the Y-direction in millimetres and t is time in days. The regression line is shown in Figure 3 together with the original deformation data.

When six validation data groups were predicted by the best fit ARIMA model and best fit regression model, the consequences shown in Figure 4 were found. Also, the real and predicted values of validation data are given in Table III.


As shown in Figure 4 and Table III, there is an obvious difference between real data and predicted data for the regression model. However, when it comes to the ARIMA model, the consequences are less significant. The difference between the ARIMA and regression models with respect to the correlation coefficient and PMSE for data-1 is given in Table IV. As can be seen, ARIMA presented a remarkably better performance with respect to the PMSE, which is a much more important factor in predicting unobserved data.

The same procedure was conducted for the remaining five stations. Again, several ARIMA models were tested for each station. The best fit ARIMA models are shown in Table V. Generally, except for one station, a third-order AR process was utilized in all models. This means that a new unobserved value will be predicted by using the last three data values in the current time series. When it comes to the MA process, which defines periodicity or 'seasonality' in a time series data, a first-order MA process was used in only two of the stations. This means that the deformation data in the stations has a generally non-repetitive trend component.
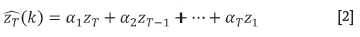
The regression models were also found for these stations. The regression lines and best fit regression equations for these five stations are shown in Figure 5. As shown, the best suited model was exponential regression equation.
Regression can be an appropriate choice for such problems, but it is a strict method because of its work strategy. Once a mathematical equation is determined from available data, all future values are predicted by that fixed equation. However, especially in mining, there can be sudden and unexpected changes and regression models cannot cope with that level of change. On the other hand, after determining model order in ARIMA, future values are predicted by previously observed data. Then, if there is a sudden change in data, subsequent future values are predicted such that they will also be affected by this change. The is also known as the 'shock effect' in TSA, and the results of regression and ARIMA incorporating this situation are given in the next subsection. The other problem in using a strict mathematical model in regression is the determination of an appropriate model. For example, an exponential model can give similar results to a power model. The real relationships between independent and dependent variables are not known, but predictions are attempted via mathematical equations. Thus, error margins for the regression can be large. In ARIMA, however, the only thing to select was the order of the model: p, d, and q. ARIMA uses the same equation for all data (Equation [10]).
Shock effect simulation of ARIMA and regression for the station-1 data
As briefly mentioned above, a shock effect in a time series data group is caused by a sudden or unexpected change in the data. In this case, because the recorded data did not include such a change, it was inserted manually for simulation. Station-1 data was used for this purpose and the value of the 51st data point, which was the first validation data, was changed manually. The prediction of regression and ARIMA for validation data including this shock effect is shown in Figure 6.

The first 50 data values were not changed and were used to find the best fit model both in ARIMA and regression. The 51st data value simulates a shock effect and the remaining five in the validation set were predicted using both methods. When the predicted data values are compared in Figure 4 (without shock effect) and Figure 6 (with shock effect); it can be seen that there is no change in the predicted data values of regression. That is, the shock effect doesn't have any influence on the regression method. However, ARIMA changed its new predicted values because it computed a new value by using previously recorded data. This situation is more suited to real cases because if an unexpected event happens, such as an earth tremor or a flood triggered by heavy rainfall, deformations could be more serious.
Conclusions
Prediction of slope failure is an important aspect in the prevention of possible accidents in open pit mines. Computational procedures have to be conducted for the safety of the area, but the prediction process is not easy and requires experienced personnel. Many methods have been used for this aim, and most of them depend on regression. Regression is the term given to methods used to find parameter values in a specific mathematical relationship between inputs and outputs. Thus, it supposes that there is a mathematical formula defining a process. However, in real life situations, this is affected by various factors such as floods, earth tremors, and landslides. Thus, there can be abrupt and unexpected changes in the likelihood of slope failure. This violates the strict mathematical definition of slope displacements. One alternative to regression-based methods is TSA. In TSA, an unobserved data event in the future is predicted by using a combination of available data.
In this study, ARIMA was used as a TSA method to predict slope failure as an alternative to regression. Deformation data from six stations at an open pit mine was used for this purpose. When ARIMA was used for the data, it was seen that ARIMA models with three AR coefficients were generally successful. This means that a new value will be predicted by the last three data values. The prediction ability of tested ARIMA models was examined using correlation coefficients and PMSE in validation data. According to the results, satisfactory values were obtained. In addition to this, to emphasize the success of ARIMA models and compare them with a general prediction method for such problems, regression methods were also applied to all data from six stations. The best regression lines were found by experimental procedures and it was noted that exponential mathematical forms gave the best results. When the correlation coefficients and PMSE values of these models obtained for validation data were compared with those from ARIMA, noticeably better results were recorded in favour of ARIMA.
The advantage of ARIMA over regression is that it has no strict mathematical formulation to define the data. In regression, a mathematical model is formulated to describe the behaviour of the data and it does not change with time, but unexpected changes may occur that violate the formed equations. In such cases, the formulation calculated with regression loses its validity. On the other hand, ARIMA uses its formulation only to predict a new value by using some previous observations. Thus, it is more suitable for the abovementioned changes. To simulate this, an artificial shock effect was applied to both the ARIMA and regression methods, and it was seen that ARIMA's performance was better than regression in coping with this shock effect.
Acknowledgements
The author is indebted to the administrative and technical personnel of TKI and the reviewers for their valuable contributions.
References
Carla, T., Farina, P., Intrieri, E., Botsialas, K., and Casagli N. 2017a. On the monitoring and early-warning of brittle slope failures in hard rock masses: Examples from an open-pit mine. Engineering Geology, vol. 228. pp. 71-81. [ Links ]
Carla, T., Intrieri, E., Farina, P., and Casagli, N. 2017b. A new method to identify impending failure in rock slopes. International Journal of Rock Mechanics and Mining Sciences, vol. 93. pp. 76-81. [ Links ]
Chen, H. and Zeng Z. 2013. Deformation prediction of landslide based on improved back-propagation neural network. Cognitive Computation, vol. 5. pp. 56-62. [ Links ]
Fuhrmann, T., Heck, B., Knõpfler, A., Masson, F., Mayer, M., Ulrich, P., Westerhaus, M., and Zippelt K. 2013. Recent surface displacements in the Upper Rhine Graben -Preliminary results from geodetic networks. Tectonophysics, vol. 602. pp. 300-315. [ Links ]
Gama, F.F., Cantone, A., Mura, J.C., Pasouali, P., Paradella, W.R., dos Santos, A.R., and Silva G.G. 2017. Monitoring subsidence of open pit iron mines at Carajás Province based on SBAS interferometric technique using TerraSAR-X data. Remote Sensing Applications: Society and Environment, vol. 8. pp. 199-211. [ Links ]
Jibson, R.W. 2011. Methods for assessing the stability of slopes during earthquakes -A retrospective. Engineering Geology, vol. 122. pp. 43-50. [ Links ]
Kaiser, R. and Maravall, A. 2000. Notes on the time series analysis ARIMA models and signal extraction. Working paper, Banco de Espana, Madrid. [ Links ]
Khanlari, G.R., Heidari, M., Mümeni, A.A., and Abdilor Y. 2011. Prediction of shear strength parameters of soils using artificial neural networks and multivariate regression methods. Engineering Geology, vol. 131-132. pp. 11-18. [ Links ]
Lian, C., Zeng, Z., Yao, W., and Tang, H. 2013. Displacement prediction model of landslide based on a modified ensemble empirical mode decomposition and extreme learning machine. Natural Hazards, vol. 66. pp. 759-771. [ Links ]
Liu, Z., Shao, J., xu, W., Chen, H., and Shi, C. 2014. Comparison on landslide nonlinear displacement analysis and prediction with computational intelligence approaches. Landslides, vol. 11, no. 5. pp. 889-896. [ Links ]
Occhiena, C., Pirulli, M., and Scavia, C. 2014. A microseismic-based procedure for the detection of rock slope instabilities. International Journal of Rock Mechanics & Mining Sciences, vol. 69. pp. 67-79. [ Links ]
Özşen, H., Ózkan, I., and Mesutoglu, M. 2019. An approach on modelling of in-situ deformations for unstable coal mine slopes. Bulletin of Engineering Geology and the Environment, vol. 78. pp. 3191-3203. [ Links ]
Özşen, H. and Özkan I. 2013. Deformation monitoring and time dependent mathematical modeling of the tension cracks at the western slopes of TKI-GLI Ilgin open lignite mine. Selcuk University Journal of Engineering, Science and Technology, vol. 1, no. 3. pp. 37-44. [ Links ]
Song, Y., Huang, D., and Cen, D. 2016. Numerical modelling of the 2008 Wenchuan earthquake-triggered Daguangbao landslide using a velocity and displacement dependent friction law. Engineering Geology, vol. 215. pp. 50-68. [ Links ]
Tan, G., Liu, H., Cheng, Y., Liu, B., and Zhang, Y. 2011. Prediction method for the deformation of deep foundation pit based on neural network algorithm optimized by particle swarm. Proceedings of the 2011 International Conference on Transportation, Mechanical, and Electrical Engineering, Changchun, China, 16-18 December 2011. IEEE, Piscataway, NJ. pp. 1407-1410. [ Links ]
Vanneschi, C., Eyre, M., Francioni, M., and Coggan, J. 2017. The use of remote sensing techniques for monitoring and characterization of slope instability. Procedia Engineering, vol. 191. pp. 150-157. [ Links ]
Wu, H., Dong, Y., Shi, W., Clarke, K.C., Miao, Z., Zhang, J., and Chen, X. 2015. An improved fractal prediction model for forecasting mine slope deformation using GM (1, 1). Structural Health Monitoring, vol. 14, no. 5. pp. 502-512. [ Links ]
 Correspondence:
H. Özşen
hozsen@ktun.edu.tr
Received: 12 Mar. 2019
Revised: 24 Sep. 2019
Accepted: 28 Nov. 2019
Published: March 2020

