


Services on Demand
Article
 English (pdf)
 Article in xml format
 Article references
Indicators

Related links
-
 Cited by Google
 -
 Similars in Google
Share

 Permalink
Journal of the Southern African Institute of Mining and Metallurgy
On-line version ISSN 2411-9717
Print version ISSN 2225-6253
J. S. Afr. Inst. Min. Metall. vol.120 n.1 Johannesburg Jan. 2020
http://dx.doi.org/10.17159/2411-9717/954/2020
DEEP MINING PAPERS
Do stopes contribute to the seismic source?
L.M. LinzerI; M.W. HildyardII; S.M. SpottiswoodeIII; J. WesselooIV
ISRK Consulting (South Africa) and University of the Witwatersrand, South Africa
IIUniversity of Leeds, United Kingdom
IIIIndependent Consultant, South Africa
IVAustralian Centre for Geomechanics, University of Western Australia
SYNOPSIS
Parameters such as source location, seismic moment, energy, source size, and stress drop are routinely calculated from mining-induced seismic data. Seismic moment tensors are inverted less routinely because their calculation is more complex and their accuracy depends on the network geometry, among a number of other factors. The models utilized in the source parameter calculations, the most well-known of which is the Brune model, were developed for the global seismicity problem and assume a solid, homogeneous Earth model. However, the tabular orebodies in South African gold and platinum mines are mined extensively and the excavations (stopes) can extend for many kilometres. The seismic source mechanisms on deep-level gold mines are generally compatible with shear failure (Hoffmann et al., 2013), whereas the source mechanisms of events at intermediate-level bord and pillar mines in the platinum district are more compatible with pillar failure and accompanying stope closure (Spottiswoode, Scheepers, and Ledwaba, 2006; Malovichko, van Aswegen, and Clark, 2012).
In this paper we investigate the influence of the stope on seismic inversions for the scalar moment, corner frequency/source radius, stress drop through numerical modelling using WAVE3D. The main objective is to determine whether the source parameters calculated from the recorded waveforms are due to a combination of the stope and shearing sources, rather than being related only to a shear source in the host rock. The modelled source is shear rupture in the footwall of a stope. The results show that the stope appears to have an appreciable effect on the seismic inversions. The seismic moment and source radius of the shear source in the stope are larger for the model with a stope compared to the model with no stope. The stress drop for the case with a stope is less than the applied stress drop, which could be an effect of the apparently larger source. This work provides a possible explanation of the second corner frequency often observed in the spectra of seismograms recorded in South Africa platinum mines. This has implications for the accurate determination of source parameters and the assessment of the intensity of shaking in stopes.
Keywords: mine seismicity, source mechanisms, numerical model, seismic inversion.
Introduction
It is widely accepted that the majority of mining-induced seismic events are shear-type events. As a result, the classical shear-slip model has been used to explain mining-induced seismicity worldwide since 1975 (Spottiswoode and McGarr, 1975). This model was originally developed for global seismic analysis and considers a planar fault surface within a solid Earth, over which instantaneous slip occurs. However, since the tabular gold and platinum deposits in South Africa are mined extensively and the excavations can extend for many kilometres, the solid Earth assumption is violated. In addition, the free surfaces created by mining enable volume changes to occur, such as the crushing or dilation of a pillar, thus violating the shear-slip approximation. A further implication of having free surfaces underground is that if a seismic event occurs near the excavation, it is possible that the stopes themselves are an integral part of the seismic source. If the event is within one source dimension, then the timing of stope convergence and ride will overlap in time with the source, affecting both the shear slip and recordings in the far field.
Previous work done by Donovan et al. (2006) attempted to investigate the effects of stopes on the seismic wavefield generated by the violent failure of a typical crush/yield pillar. Forward modelling techniques were applied using a finite-difference code called WAVE (Cundall, 1992; Hildyard, Daehnke, and Condall, 1995; Hildyard 2001; Hildyard and Young 2002), which has the unique ability to model the effect of voids (or stopes) on the seismic wavefield in three dimensions. The wave propagation can be followed from its initiation at a source through its reflection and refraction from structures in the stope vicinity.
> The P-wave displacement pulses for ray paths through solid rock are clear and unidirectional.
> The displacement spectrum is flat for frequencies lower than the corner frequency. At frequencies above the corner frequency, the displacement spectrum falls off with frequency (f according tof-2 until anelastic attenuation absorbs energy at high frequencies (Spottiswoode, 1993).
> The seismic moments estimated from P- and S-wave pulses are approximately equal.
> The seismic moment M0estimated from spectra provides an accurate 'volume of ride' for shear sources (M0 = G / R.dA
= GV where G is the shear modulus, and the integral can be seen to represent a volume of ride V = RA, where R is the mean ride (m) and A is the area of rupture surface (m2) (Ryder, 1988).
> Apparent stress (σΑ = GE/M0, where G is the shear modulus, E is energy) is used as an estimate of stress change at the source. Note that magnitude based on radiated energy (i.e. using log10 (E) = 1.5M + 4.8 where E is in joules (Gutenberg and Richter, 1956), and magnitude based on seismic moment (log10 (M0) = 1.5M + 9.1 where M0 is in Nm (Hanks and Kanamori, 1979) are identical for σΑ = 2 MPa and for G = 40 GPa. Values of σΑ are typically about 0.1 MPa for gold mine events (van Aswegen and Butler, 1993). The apparent stress varies from 0.1-10 MPa over the entire range of earthquake sizes (17 orders of M0) (Ide and Beroza, 2001).
Spottiswoode, Scheepers, and Ledwaba (2006) propose a failure model which consists of pillar crushing driven by stope closure. This model explains several characteristics of the data that cannot be explained by the classic shear-slip model:
> The corner frequency was an order of magnitude lower than that expected from failure of the pillar.
> The P-wave source pulses were bi-directional.
> The displacement spectrum falls off with frequency (f) according to f-3at frequencies above about 100 Hz.
> The P-wave moments were consistently higher than those estimated from the S-waves.
> Extremely low apparent stress of about 0.03 MPa (Spottiswoode, Scheepers, and Ledwaba, 2006).
In addition, Gibowicz (1990) notes that whenever the size and geometry of underground damage caused by rockbursts could be estimated in Polish mines, the observed source radius was considerably smaller than that predicted by the Brune model. Since the source radius r0 is proportional to the inverse of the corner frequencyf Gibowicz's observation that the calculated source radii are too large implies that the measured corner frequencies are too low.
Modelled effects from observations of simulated data Effect of high-angle fractures
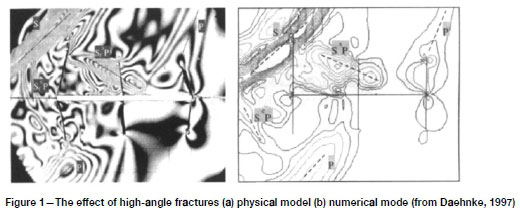
Daehnke (1997) studied the effects of seismic waves on high-angle fractures in the vicinity of stopes by means of dynamic photoelastic experiments. Photographs of the resulting fringe patterns were analysed theoretically and back-analysed using the WAVE code to validate the accuracy of the elastodynamic models.
The physical models consisted of a slot-shaped opening representing the stope, positioned in the centre of a thin composite plate made from photoelastic materials. The wave patterns emanating from a blast source in the bulk material were photographed using a high-speed camera. Figure 1 shows a comparison between the experimental and the WAVE results at a snapshot of 169 ps. It was concluded that WAVE accurately modelled the diffraction, refraction, transmission, and reflection of stress waves in these models. Similar experiments in photoelastic material have demonstrated that modelled wave behaviour can closely correspond to that observed (Daehnke, Rossmanith, and Knasmillner, 1996; Daehnke and Hildyard, 1997; Uenishi, 1997).
The effects of excavations on seismic data
This section consolidates the findings of research studies that investigated the effects of excavations on seismic waves. It is subdivided into studies based on recorded data from specialized underground networks and research where numerical modelling was applied.
Observed effects from recorded data Attenuation effects
Waves travelling through the fracture zone enveloping excavations suffer greater attenuation of the high frequencies than waves passing through solid rock. Cichowicz (2001) estimated that the quality factor of the medium, Q, was approximately 40 in the fracture zone around a stope, whereas Q values of around 400 are typical in unfractured rock away from a stope.
Churcher (1990) investigated this path effect further by comparing the signals that travelled through the solid rock mass with signals from the same event that travelled through the fracture zone. Since the corner frequency is a parameter that is controlled by the source, it should be independent of recording site position. However, it was found that the corner frequency values calculated from waveforms that propagated mainly through unfractured rock were 1.3 to 3.4 times higher than the values computed from ray paths through fractured ground. Since the source radius and stress drop are source parameters that depend on corner frequency, the effect of having reduced corner frequencies is that the source radius will appear to be too large, and the stress drop too low.
Amplification effects
Milev et al. (2002) recorded peak particle velocities (PPVs) on the surface of the excavation using instruments such as the peak velocity detector (PVD) and ground motion monitor (GMM), and compared them with PPVs recorded by the in-mine system. The geophones of the in-mine system were installed in boreholes at depths of approximately 10 m in solid rock. The PPVs recorded in solid rock were corrected for distance to compensate for geometrical spreading. Common events (events that triggered both the PVD and in-mine network) were then compared. The researchers found that the PPVs recorded on the surface of the excavation were amplified 5-6 times. Since an amplification of two times can be explained by constructive interference from reflections off the free surface, other explanations must be sought. One reason could be the propagation of surface waves along the free surface of the excavation.
Possible stope effects
It is instructive to list the characteristics of seismograms generated by shear failure before discussing those associated with non-shearing sources. Spottiswoode, Scheepers, and Ledwaba (2006) summarize these characteristics as follows.
> The dominant frequency of P-waves is noticeably higher than that of S-waves.
> The source dimensions calculated using the Brune (1970) model give realistic estimates of the size of earthquakes.
Wang and Cai (2015) investigated the effect of the wavelength to excavation span (λ/D) ratio on ground motion and PPVs using SPECFEM2D. They concluded that the λ/D ratio has a significant influence on the ground motions and PPV distribution surrounding underground openings. The study showed that higher PPVs were observed when the λ/D ratio was decreased, suggesting larger span excavations may be at increased risk of dynamic failure. When λ/D > 30, the loading is considered quasi-static, whereas for λ/D < 20 significant interaction of seismic waves takes place and the loading must be considered dynamic. For the majority of mine excavations influenced by fault slip events, λ/D < 10 (Wang and Cai, 2015).
These experiments suffer from the deficiency of being two-dimensional analyses, and no direct detailed comparisons between measured and modelled seismograms were made (Hildyard, 2007).
Effect of mine layout on seismic wave propagation
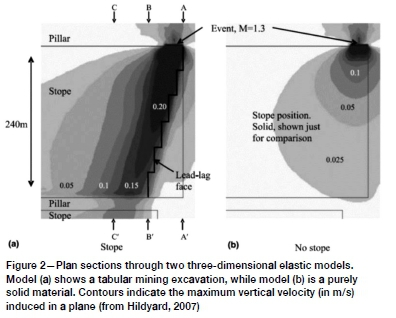
Forward modelling studies in which the effects of an excavation on wave propagation were examined are described in Hildyard, Napier, and Young (2001) and Hildyard (2007). One study used a tabular stoping geometry typical of longwall mining in deep-level mines in South Africa. The mining layout consisted of an excavation with a stoping width of 1.5 m and extending laterally for hundreds of metres. Wave propagation was simulated for a vertical slip event in the footwall of the pillar, parallel to the direction of mining advance and just behind the face position of the mining. The event had a moment of 1.2 χ 105 MNm, and a moment magnitude of 1.3. The rupture was propagated at 3000 m/s with a uniform stress drop of 9.35 MPa. The stress drop at any point occurred over 2 m, and the whole event over 6 m.
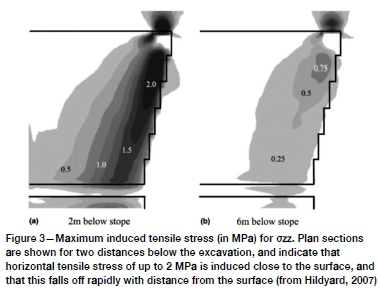
In Figure 2, the maximum vertical velocity in a plane 2 m below the stope is compared with the case if the excavation did not exist. It was found that the influence of the stope on the wave propagation is significant, affecting the amplitude and distribution of PPV. The PPVs in the model with a stope are several times those at similar distances in the solid model. The effect on the induced tensile stresses is even more marked, where the value 200 m from the event is increased from 0.06 MPa in the solid model to 1.6 MPa due to the influence of the excavation (see Figure 3).
Velocities at the far pillar are up to six times those in the solid model without the excavation. Maximum amplitudes follow the face outline, and the maximum amplitudes deep into the stope are around four times those in the solid model without the excavation. Hildyard (2007) concluded that a relatively small event (magnitude of 1.3) occurring near the edge of a stope can lead to these amplifications and induce tensile stresses 200 m from the event. This effect is caused by surface waves propagating along the free surface of the excavation.
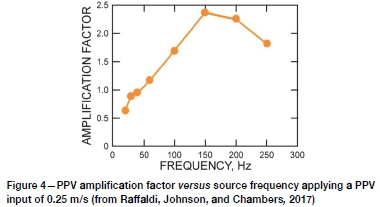
The influence of the λ/D ratio on PPV amplification was also investigated by Raffaldi, Johnson, and Chambers (2017) using UDEC. The graph in Figure 4 shows a clear relationship between PPV amplification and source frequency, with maximum amplification occurring at a frequency of 150 Hz, which represents a λ/D ratio of 3. Note that these UDEC models were two-dimensional.
McKenzie (2017) also explored the effect of λ/D ratio on PPV amplification using WAVE3D. The key difference between this study and those by Wang and Cai (2015) and Raffaldi, Johnson, and Chambers (2017) is that it incorporates the third spatial dimension. The relationship between source frequency and the PPV amplification factor is consistent with that shown by Raffaldi, Johnson, and Chambers, (2017). However, the equivalent modelling in 3D for two sets of tunnels with different dimensions (4 χ 4 m and 4 χ 8 m) did not show a clear relationship between the λ/D ratio and PPV amplification. The testing does show clearly that source frequency controls the extent of PPV amplification, but there is not a correlation between the λ/D ratio and the amplification factor between the smaller tunnels and any of the three orientations modelled for the larger tunnels. McKenzie (2017) concludes that although it was not possible to establish a clear relationship between the λ/D ratio and PPV amplification in 3D, as was achieved by Raffaldim Johnson, and Chambers (2017), the discrepancy is possibly the result of modelling a specific source mechanism in WAVE3D. Raffaldi, Johnson, and Chambers (2017) assume a plane wave interacting with a tunnel in 2D, whereas the McKenzie (2017) study models wave fronts striking in a variety of oblique orientations relative to the different excavations.
Effect of the fracture zone on seismic wave propagation
Linkov and Durrheim (1998) propose that amplification is due to the additional energy released as waves pass through the fracture zone, which is in a post-failure, strain-softening state. In a further study discussed in Hildyard, Napier, and Young (2001), the effect of fractures on the near-field and far-field PPVs was evaluated for stope-normal (vertical) and stope-parallel (horizontal) fractures. In addition to the fracture zone causing waves to attenuate due to scattering of high frequencies (see Churcher, 1990), Hildyard (2001) found that the effective elastic modulus of rock may be reduced, which could increase amplitudes for long wavelengths, leading to velocity amplifications. This study showed that the amplitudes in both the near and far field were influenced in a complex fashion by: stress drop, sense of slip, excavation surface, excavation outline, and the proximity of any part of the source (rather than the source centre) to the excavation. The stope free surface caused the near-field PPV to increase by 40%, and the far-field PPVs increased by 600%. The effect of the fracturing was to increase both near- and far-field stope velocities by up to 50%. Hildyard (2007) concluded that the damage potential from an event near an excavation cannot be readily inferred from aspects such as moment, magnitude, and the proximity to the source centre, as this ignores the effect of free surfaces and fracturing.
Durrheim (2012) suggests that the amplification of PPVs in the fracture zone could be due to velocity contrasts, trapping seismic energy from seismic waves and enhancing surface wave formation (e.g. Love and Raleigh waves). A recent study by Zhang, Swan, and Nordlund (2015) investigated the effect of fracturing on velocity amplification through universal distinct element code (UDEC) modelling. The model consisted of a one-dimensional elastic rock bar with a length of 300 m and a width of 1 m. A dynamic load was applied normal to the surface of the bar and propagated through a series of regularly spaced parallel fractures. Their results showed that multiple near-surface fractures amplify PPVs, with recorded increases of 2-3.6 times above input velocities. The dominant influencing factors were ascribed to wave frequency, fracture zone thickness, fracture spacing, and fracture stiffness. These authors suggest that the primary mechanism through which fractures caused amplification was the interaction of fractures with seismic body waves.
Effect of the stope on seismic parameter inversions
In a separate study that applied forward modelling techniques (Linzer and Hildyard, 2005), the effect of stopes on the accuracy of seismic inversions for source parameters was analysed. WAVE was used to model seismic wave propagation around a faulting source which daylights into a stope. The main objective was to determine whether the source parameters calculated from recordings (seismograms) of the radiated wavefield were influenced by the presence of the stope. Since the source mechanism is known in detail (because the source is explicitly input into the model) the accuracy of the seismic inversions could be evaluated.
The results showed significant influences due to the stope. The stope appeared to have an appreciable effect on the seismic inversion for the scalar moment since the moment computed from the seismograms was almost double the moment of the fault source, indicating that the stope could be behaving like a source and contributing to the overall wavefield. In addition, the source area calculated from the seismograms was significantly larger than the fault source area of the model. However, the conclusions of Linzer and Hildyard (2005) admitted some uncertainty, particularly as to whether the seismograms were recorded at sufficiently far distances in comparison to the source size and typical field measurements.
This paper builds on an unpublished study and takes advantage of the advances in computing capabilities. Models that previously had to be run on a cluster can now be run on a high-end desktop workstation.
WAVE3D modelling
Two models were run in WAVE3D, each having a shearing source. The control case consisted of just the shearing source to eliminate the stope effect, whereas the second model included a stope. Each model comprised an orthogonal, equispaced grid of 720 χ 720 χ 720 elements (a total of 374 million grid points) with grid spacing of 1 m. These models each required 32 GB of RAM and took 16 hours to complete when run on a high-end workstation. In 2006, similarly sized models had to be run on a cluster and ran over five days.
The shearing source consisted of a 20 m χ 20 m vertical fault positioned below and in the centre of the 60 χ 60 m stope. The fault plane daylighted into the stope (i.e. the slip plane was exposed in the stope). The slip plane was explicitly included in the model. The rupture was initiated at a central point at the top of the slip plane and propagated downwards along the plane at a rate of 90% of the S-wave velocity. The P-wave velocity used was 6610 m/s and the S-wave velocity was 3865 m/s. The source geometry for the shearing source is shown in Figure 5. Twenty-four triaxial geophones with axes oriented parallel to the x-, y-, and z-axes of the model were placed around the source centre at a distance of 320 m from the source so as to provide complete coverage of the focal sphere in three dimensions.
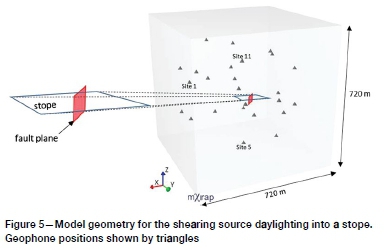
The hypocentral distance for all geophones was 320 m, 32 times the source radius of the slip plane. Consequently, the recordings related to slip of the fault plane should be in the far field and the near-field terms should be negligibly small. If coseismic convergence of the 60 m2 χ 60 m2 stope occurs when the fault slips, the stope could radiate elastic waves contributing to the total wavefield. The hypocentral distance of 320 m is just over 10 times the source radius of the stope, and therefore the near-field contribution of the stope should also be negligible.
Results and discussion
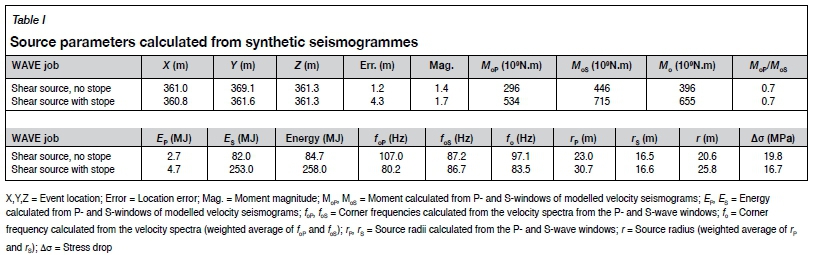
The synthetic seismograms recorded by the spherically arranged geophones were converted into PRISM format and imported into AURA, the seismogram processing tool written by CSIR. An AURA database was set up using the network geometry specified in the WAVE3D job files, and the converted seismograms were imported into AURA. The P- and S-wave phases of the synthetic seismograms were picked and the events located. Source parameters (moment, magnitude, source radius, and stress drop) were also computed from the windowed P- and S-wave phases. The source parameter results are given in Table I.
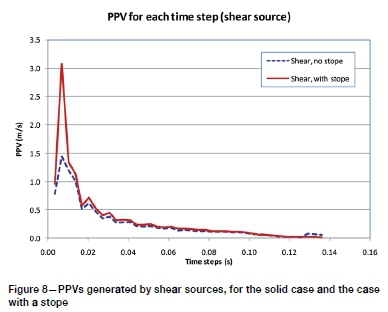
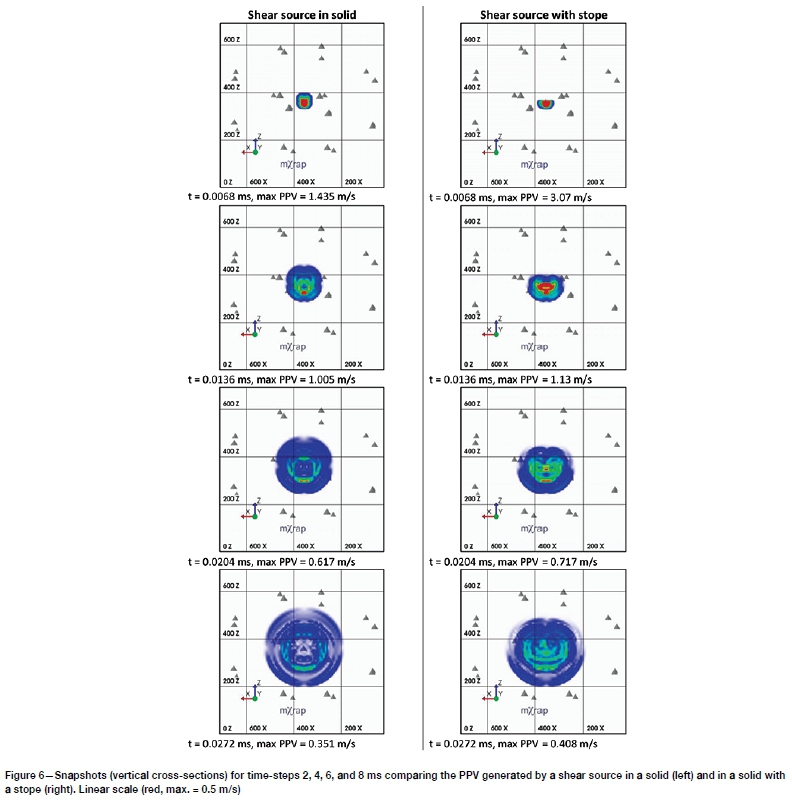
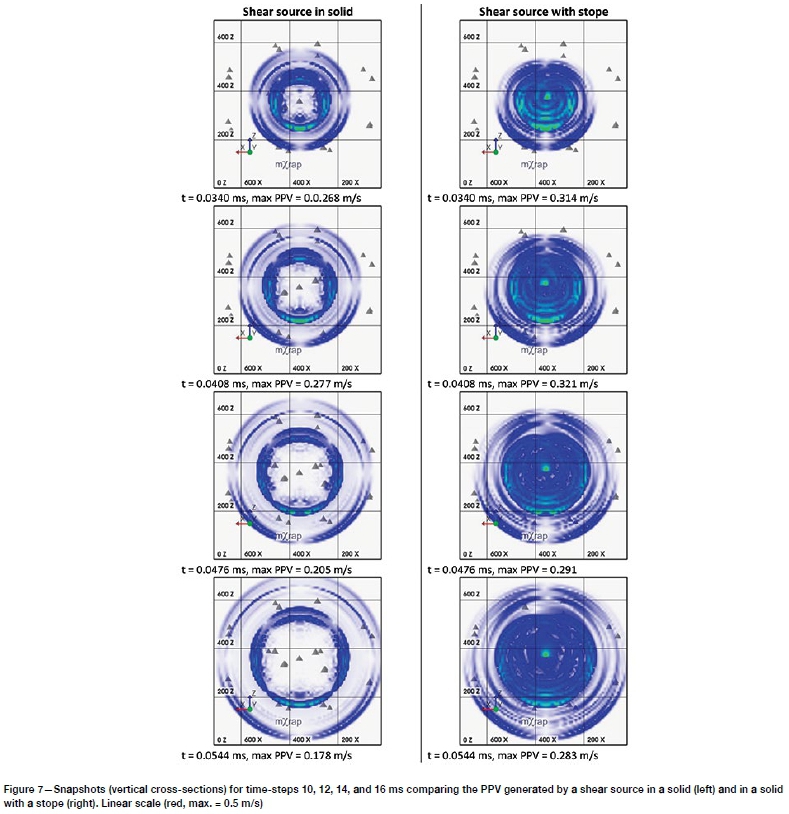
Snapshots for the two models consisting of contoured values of PPV in the x-y plane (vertical cross-section through the source centre) for six discrete time intervals (from 3.4 ms to 67.32 ms after event initiation) are shown in Figure 6 and Figure 7. To enable comparison between the two models, the same colour scale is used for all cases, where red represents PPV values of 0.5 m/s and above. The maximum PPV for each time-step is also indicated on the figures. The effect of the propagating source is to compress the wavefield below the source, causing a Doppler shift to the higher frequencies. The presence of the stope disturbs the radiation pattern generated by the shear source and prevents wave propagation through the stope while causing the wavefield to diffract around the edges of the stope. The PPVs generated by the shear source below the stope are significantly higher than those for the case with no stope, reaching maxima of 3.1 m/s (stope case) and 1.4 m/s (solid case) some 6.8 ps after source initiation. Not only are the PPVs higher for the stope case (see Figure 8), but the areas having PPVs > 0.5 m/s are significantly larger.
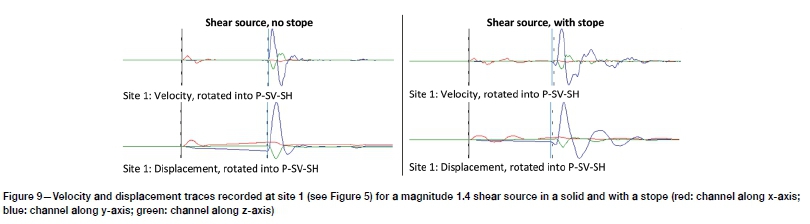
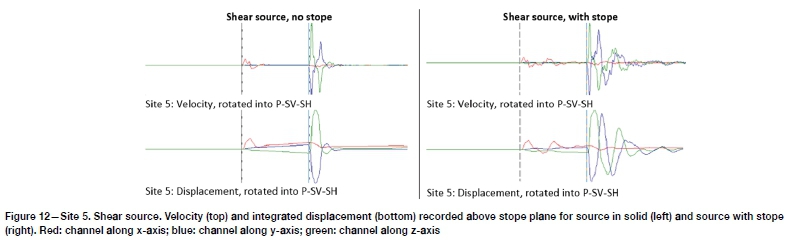
Examples of the synthetic seismograms recorded by site 1 (see Figure 5) of the 24 geophone sites, for the two models are given in Figure 9 and Figure 10. The red, blue, and green traces are the seismograms recorded by three channels of a triaxial geophone, where the sensors are oriented orthogonal to one another (red: channel along x-axis; blue: channel along y-axis, and green: channel along z-axis). In all the figures showing seismograms the waveforms are rotated towards the source to maximize the P-wave in the radial direction (while minimizing the S-waves) and maximize the S-waves in the transverse directions (while minimizing the P-wave). Velocity seismograms are given, as well as the integrated velocity traces (i.e. displacements).
The P-S wave separation is excellent for all the traces, enabling the onset of the wave phases to be picked. The traces generated by the shear sources (in a solid, and with a stope) show well-developed S-waves, indicative of a source dominated by shearing. This is consistent with the P-S moment ratios of approximately 0.7 given in Table I.
The velocity and displacement traces for the shear source in the solid are nearly perfect textbook examples of signals generated by a shear source (see Figure 9). There is a small amount of overshoot (e..g., blue displacement trace), but it is not clear what the cause is. Comparison of the integrated displacements recorded at site 1 (see Figure 5) for the shear model with a stope with that in the solid shows that longer wavelengths are present in the wavefield, evidently a result of the presence of the stope.
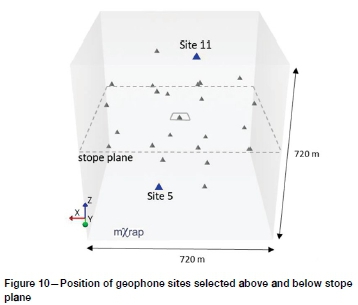
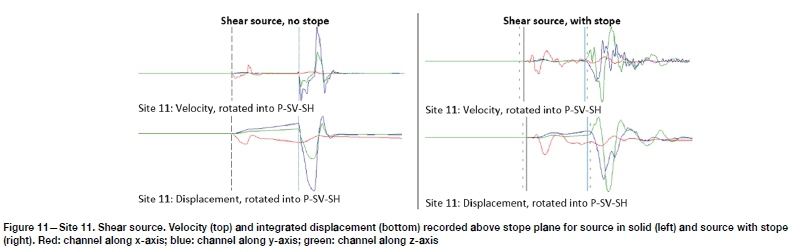
It is instructive to compare signals recorded above and below the stope plane for the shearing source. Site 11 is located in the hangingwall above the stope plane, and site 5 is in the footwall below the stope plane (see Figure 10). Velocity and integrated displacement traces recorded above and below the stope plane for a shear source in a solid, and in the presence of a stope, are shown in Figure 11 and Figure 12. The stope significantly increases the complexity of the velocity and displacement traces recorded above the plane of the stope. The recordings made in the footwall, below the plane of the stope, show slightly less complexity, probably because the shear source is also in the footwall. However, the waveforms differ significantly from those for the model of the shear source in the solid.
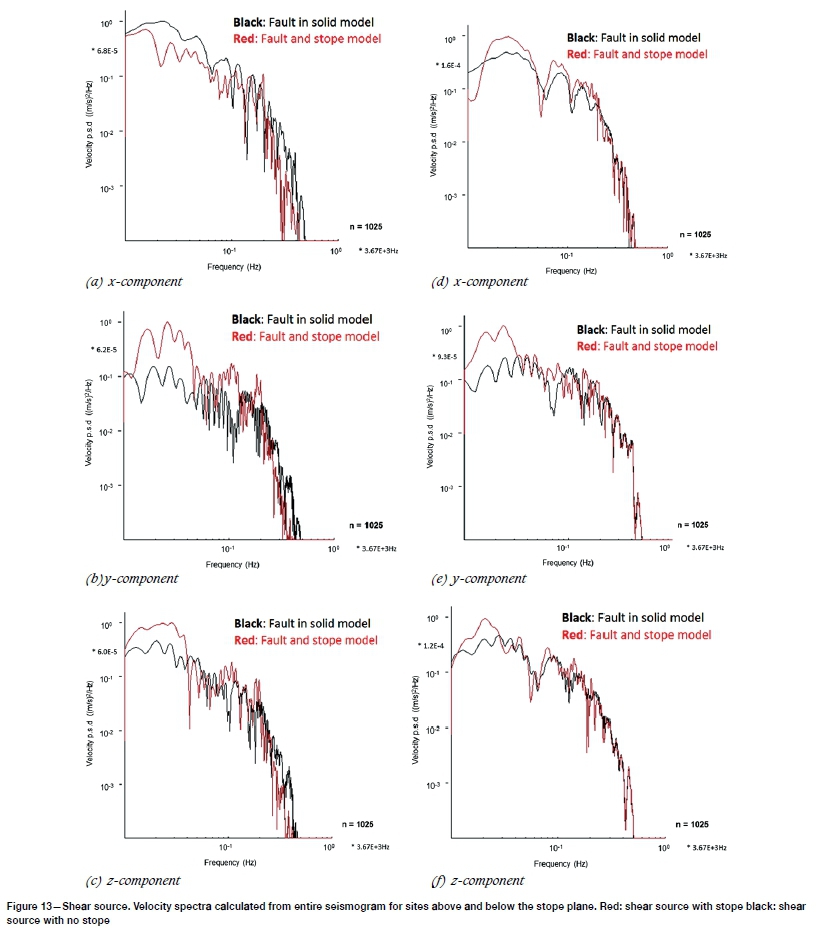
The velocity spectra for sites above and below the stope are shown in Figure 13. The spectra are compared with the modelled cases where no stope is present. The stope has an obvious effect and causes low-frequency components to be added to all the traces in the range 1 Hz to 200 Hz, with a peak at about 100 Hz.
The modelled source of shear failure in a pillar where the fault daylights into the stope is likely to be a worst-case scenario. Preliminary investigation shows that with non-daylighting faults the waveforms are affected in a similar way and differ considerably from the waveforms without a stope present. In the case where the fault does not intersect the stope the stope convergence is less, resulting in a lower stope contribution to the wavefield.
It is expected that the properties of the stope will influence the overall behaviour of the system. Preliminary investigations, however, show that the effect of backfill is very limited and noticeable only with a very high stiffness. The effect of in-stope pillars has not been modelled as part of this investigation. Due to the high stiffness of the pillars it is expected that their influence will be more considerable. It is also expected that the presence of in-stope pillars would limit the span, which limits the lower frequency contribution in favour of higher frequencies.
Future work will attempt to model more realistic scenarios by including a fracture zone around the stope, in-stope pillars, an actual bord and pillar geometry, and a comparison of synthetic waveforms with recorded seismograms.
Summary of observations
The main observations can be summarized as follows.
> The PPVs generated by the shear source below a stope are significantly higher than those for the case with no stope, reaching maxima of 3.1 m/s (stope case) and 1.4 m/s (solid case) some 6.8 m/s after source initiation.
> The shear sources in the presence of a stope show that longer wavelengths are present in the wavefield, evidently a result of the presence of the stope.
> The stope increases the complexity of the traces.
> The stope has an obvious effect and causes low-frequency components to be added to all the traces, in the range 1-200 Hz, with a peak at about 100 Hz.
The following observations refer to the source parameters listed in Table I. > The magnitudes (calculated from the integrated square of the energy) for the shear model in the presence of a stope are larger than those computed from the solid models. It therefore appears that the stope is adding to the overall size of the event.
> The moments calculated from the spectra mirror the
magnitude trends. The moment of the fault source explicitly included in the model is 292 χ 109 N.m and that of the stope is 382 χ 109 N.m. Adding the two moments together give a total moment of 674 χ 109 N.m. For the shear source with no stope, the moment computed from spectra of the synthetic seismograms is 396 χ 109 N.m for the case in the solid, and 655 χ 109 N.m for the case with the stope. Since the moments computed from the seismograms are all larger than the fault moment calculated directly from the model, the stope is clearly contributing to the moment.
> The shear source models had an area of 400 m2 for the fault, and 3600 m2 for the stope. The source areas computed from the source radii, which are computed from the spectra, are 1333 m2 for the shear source in the solid and 2091 m2 for the shear source with the stope.
> The actual stress drop applied in the model was 50 MPa. The stress drops computed from the source radii for the shear sources in a solid and near the stope, are lower:
20 MPa and 17 MPa, respectively. This could be the effect of the apparently larger source, i.e. the stress of the model is applied only over the fault source area, but since the stope is part of the effective source, the average stress drop is much lower than 50 MPa.
Conclusions
The programme WAVE3D was used to simulate the complex wavefield that could result from the combination of stope and faulting sources. It was found that the source parameters calculated from synthetic seismograms generated by a shearing source below a stope were significantly influenced by the stope. The seismic moment computed from the seismograms exceeded that of the moment of the fault by itself, indicating that the stope is contributing to the overall radiated wavefield.
Other effects were an increase in the PPVs in the vicinity of the stope; the introduction of longer wavelengths into the wavefield; an increase in the source radius and reduction of the stress drop; and an increase in the complexity of the waveforms.
This work provides a possible explanation of the second corner frequency often observed in the spectra of seismograms recorded in South Africa platinum mines. This has implications for the accurate determination of source parameters and the assessment of the intensity of shaking in stopes.
References
Brüne, J.N. 1970. Tectonic stress and the spectra of seismic shear waves from earthquakes. Journal of Geophysical Research, vol. 75. pp. 4997-5009. [Correction: Journal of Geophysical Research, 1971, vol. 76. p. 5002). [ Links ]
Chürcher, J.M. 1990. The effect of propagation path on the measurement of seismic parameters. Proceedings of the 2nd International Symposium on Rockbursts and Seismicity in Mines, Minneapolis, Minnesota. Fairhurst, C. (ed). Balkema, Rotterdam, The Netherlands. pp. 205-209. [ Links ]
Cichowicz, A. 2001. The meaningful use of peak particle velocity at excavation surface for the optimisation of the rockburst support criteria for tunnels and stopes. Final report GAP709b. Safety in Mines Research Advisory Committee, Johannesburg. 33 pp. [ Links ]
Cündall, P.A. 1992. Theoretical basis of the program WAVE. Unpublished internal report, COMRO (now CSIR Natural Resources and the Environment), Pretoria, South Africa. pp. 1-12. [ Links ]
Daehnke, A. 1997. Stress wave and fracture propagation in rock. PhD thesis, Institute of Mechanics of the Vienna University of Technology. 409 pp. [ Links ]
Daehnke, A. and Hildyard, M.W. 1997. Dynamic fracture propagation due to stress waves interacting with stopes. Proceedings of the 1st Southern African Rock Engineering Symposium (SARES), Johannesburg, South Africa. South African National Institute of Rock Engineering. pp. 97-108. [ Links ]
Daehnke, A., Rossmanith, H.P., and Knasmillner, R.E. 1996. Using dynamic photoelasticity to evaluate the influence of parting planes on stress waves interacting with stopes. InternationalJournalfor Numerical and Analytical Methods in Geomechanics, vol. 20, no. 2. pp. 101-117. [ Links ]
Donovan, S.J., Hildyard, M.W., Linzer, L.M., Roberts, D., and vogt, D. 2006. Collaborative modelling and analysis technology: Modelling and analysis activities for the geoscience applications. CSIR internal report. Pretoria. pp. 1-122. [ Links ]
Durrheim, R.J. 2012. Functional specifications for in-stope support based on seismic and rockburst observations in South African mines. Proceedings of the Sixth International Seminar on Deep and High Stress Mining. Potvin, Y. (ed). Australian Centre for Geomechanics, Perth. pp. 41-55. [ Links ]
Gibowicz, S.J. 1990. Seismicity induced by mining. Advances in Geophysics, vol. 32. pp. 1-74. [ Links ]
Gutenberg, B. and Richter, C.F. 1956. Earthquake magnitude, intensity, energy and acceleration. Bulletin of the Seismological Society of America, vol. 46. pp. 105-146. [ Links ]
Hanks, T.C. and Kanamori, H. 1979. A moment magnitude scale. Journal of Geophysical Research, vol. 84. pp. 2348-2350. [ Links ]
Hildyard, M.W. 2001. Wave interaction with underground openings in fractured rock. PhD thesis, University of Liverpool. 283 pp. [ Links ]
Hildyard, M.W. 2007. Rocha Manuel Rocha Medal Recipient: Wave interaction with underground openings in fractured rock. Rock Mechanics and Rock Engineering, vol. 40. pp. 531-561. [ Links ]
Hildyard, M.W., Daehnke, A., and Cundall, P.A. 1995. WAVE: A computer program for investigating elastodynamic issues in mining. Proceedings of the 35th US Symposium on Rock Mechanics. Balkema, Rotterdam. pp. 519-524. [ Links ]
Hildyard, M.W., Napier, J.A.L., and Young, R.P. 2001. The influence of an excavation on ground motion. Proceedings of the 5th Symposium on Rockbursts and Seismicity in Mines (RaSiM 5), Johannesburg, September 2001. Southern African Institute of Mining and Metallurgy, Johannesburg. pp. 443-452. [ Links ]
Hildyard, M.W. and Young, R.P. 2002. Modelling wave propagation around underground openings in fractured rock. Pure and Applied Geophysics, vol. 159. Special Issue on Induced Seismicity. Trifu, C. (ed.). pp. 247-276. [ Links ]
Hoffmann, G., Murphy, S., Scheepers, L., and van Aswegen, G. 2013. Surface stress modelling of some shear slip seismic events that occurred in AngloGold Ashanti's tabular mines. Proceedings of the 8th International Symposium on Rockbursts and Seismicity in Mines, St Petersburg and Moscow, 1-7 September 2013. Geophysical Survey of Russian Academy of Sciences. pp. 219-231. [ Links ]
Ide, S. and Beroza, G.C. 2001. Does apparent stress vary with earthquake size? Geophysical Research Letters, vol. 28, no. 17. pp. 3349-3352. [ Links ]
Linkov, A.M. and Durrheim, R.J. 1998. Velocity amplification considered as a phenomenon of elastic energy release due to softening. Proceedings of the 3rd International Conference on Mechanics of Jointed and Faulted Rock, Vienna, Austria, 6-9 April. Rossmanith, H.P. (ed.). Balkema, Rotterdam. pp. 243-248. [ Links ]
Linzer, L.M. and Hildyard, M.W. 2005. New criteria for rockmass stability and control using integration of seismicity and numerical modelling. SIMRAC Final Project Report: SIM 02 03 01. Hildyard, M.W., Napier, J.A.L., Spottiswoode, S.M., Sellers, E., Linzer, L.M. and Kataka, M.O. (eds). Safety in Mines Researh Advisory Committee, Johannesburg, South Africa. 185 pp. [ Links ]
Malovichko, D., van Aswegen, G., and Clark, R. 2012. Mechanisms of large seismic events in platinum mines of the Bushveld Complex (South Africa). Journal of the Southern African Institute ofMining and Metallurgy, vol. 112, no. 6. pp. 419-429. [ Links ]
McKenzie, C. 2017. PPV to PPV: Towards estimating the site effect due to surface waves generated along surface excavations. MSc dissertation, University of Leeds. 118 pp. [ Links ]
Milev, A.M., Spottiswoode, S.M., Noble, B.R., Linzer, L.M., van Zyl, M., Daehnke, A., and Acheampong, E. 2002. GAP709: The meaningful use of peak particle velocities at excavation surfaces for the optimisation of the rockburst criteria for tunnels and stopes. SIMRAC Final Project Report no: 2002 - 0305 (a). Safety in Mines Research Advisory Committee, Johannesburg, South Africa. [ Links ]
Raffaldi, M., Johnson, J.C., and Chambers, D. 2017. Numerical study of the relationship between seismic wave parameters and remotely triggered rockburst damage in hard rock tunnels. Deep Mining 2017: Proceedings of the Eighth International Conference on Deep and High Stress Mining. Wesseloo, J. (ed.). Australian Centre for Geomechanics, Perth. pp. 373-386 [ Links ]
Ryder, J.A. 1988. Excess shear stress in the assessment of geologically hazardous situations. Journal of the Southern African Institute ofMining and Metallurgy, vol. 88, no. 1. pp. 27-39. [ Links ]
Spottiswoode, S.M. 1993. Seismic attenuation in deep-level mines. Proceedings of the 3rd International Symposium on Rockbursts and Seismicity in Mines, Balkema, Rotterdam. pp. 409-414. [ Links ]
Spottiswoode, S.M. and McGarr, A. 1975. Source parameters of tremors in a deep level gold mine. Bulletin of the Seismological Society of America, vol. 65. pp. 93-112. [ Links ]
Spottiswoode. S.M., Scheepers, J.B., and Ledwaba, L. 2006. Pillar seismicity in the Bushveld Complex. Journal of the Southern African Institute ofMining and Metallurgy, vol. 114. pp. 801-809. http://www.scielo.org.za/pdf/jsaimm/v114n10/08.pdf [ Links ]
Uenishi, K. 1997. Rayleigh pulse dynamic triggering of interface slip. PhD thesis, Vienna University of Technology. 178 pp. [ Links ]
Van Aswegen, G. and Butler, A.G. 1993. Application of quantitative seismology in South African gold mines. Proceedings of the 3rd International Symposium on Rockbursts and Seismicity in Mines. Balkema, Rotterdam. pp. 261-266. [ Links ]
Wang, X. and Cai, M. 2015. Influence of wavelength-to-excavation span ratio on ground motion around deep underground excavations. Tunnelling and Underground Space Technology, vol. 49, June 2015. pp. 438-453. [ Links ]
Zhang, P., Swan, G., and Nordlund, E. 2015. 1-D numerical simulation of velocity amplification of P-waves travelling through fractured rock near a free surface. Journal of the Southern African Institute ofMining and Metallurgy, vol. 115, no. 11. pp. 1121-1126. [ Links ]
 Correspondence:
L. M. Linzer
LLinzer@srk.co.za
Received: 30 Oct. 2019
Revised: 9 Dec. 2019
Accepted: 22 Jan. 2020
Published: January 2020

