


Services on Demand
Article
 English (pdf)
 Article in xml format
 Article references
Indicators

Related links
-
 Cited by Google
 -
 Similars in Google
Share

 Permalink
Journal of the Southern African Institute of Mining and Metallurgy
On-line version ISSN 2411-9717
Print version ISSN 2225-6253
J. S. Afr. Inst. Min. Metall. vol.120 n.1 Johannesburg Jan. 2020
http://dx.doi.org/10.17159/2411-9717/863/2020
DEEP MINING PAPERS
Anisotropic rock mass behaviour in high-displacement ground at CSA mine
G.B. SharrockI; B. ChapulaII
IItasca Australia Pty Ltd, Brisbane, Australia
IICSA Mine, Cobar Management Pty, Cobar, Australia
SYNOPSIS
This paper summarizes key findings from a 39-month study at CSA mine on factors controlling anisotropic ground behaviour in sublevel open stope access tunnels at depths of 1500-1700 m. The aim was to understand factors controlling high-displacement ground behaviour through numerical and empirical back-analysis at 45 damage sites over a 39-month period. Excavation orientation, rock mass matrix and foliation strength, and stress path were identified as the key parameters influencing tunnel damage and convergence. Tunnels driven parallel to foliation (i.e., along strike) experienced much higher levels of damage than those driven perpendicular to foliation. Drives at intermediate angles experience varying levels of damage, depending on the rock mass strength and stress. The stress path induced by mining was found to significantly affect the initiation and progression of damage in both tunnels and raises.
Keywords: stoping, tunnelling, squeezing, bedding, high stress.
Introduction
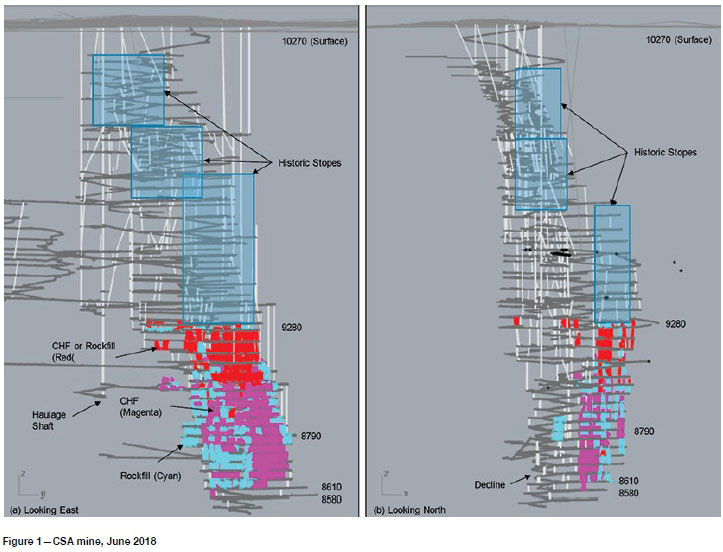
CSA mine is an underground copper mine located near Cobar, NSW, Australia, that currently produces around 1.2 Mt/a at 4% Cu. The CSA copper-lead-zinc orebodies consist of several steeply dipping parallel lenses that strike north-south. The orebodies occur within steeply dipping north-south trending shear zones which cut across the sedimentary rocks of the Upper Silurian-Lower Devonian Cobar Group (Tavakoli, 1994). The dominant historical and current mining method at CSA is sublevel open stoping (SLOS), currently implemented to 1700 metres below surface (mbs). The life of mine (LOM) plan has workings extending to at least 2100 mbs. Historically, above 9280 m below reference level (mRL) or 920 mbs, open stopes were relatively small (HR < 4 m, span < 15 m) to prevent crown and sidewall instabilities. The current mining method relies on single lift stopes 25 m in height (the sublevel interval is 25 m, transitioning to 30 m below 8610 mRL or 1590 mbs) mined under cemented backfill (10% Portland cement, UCS = 1.2 MPa) The crown and backfill spans are around 20 m or less. The stope sequence is centre in, top down, with hangingwall stopes leading to stress shadow footwall stopes and tunnels (Figure 1). This method has worked well to date, although increasing levels of buckling damage in the sidewalls and brittle damage in the backs are being experienced inside the closure pillar on the lower abutment and in perimeter drives driven parallel to the foliation.
Geology, stress, and rock mass strength
Geology and rock mass classification
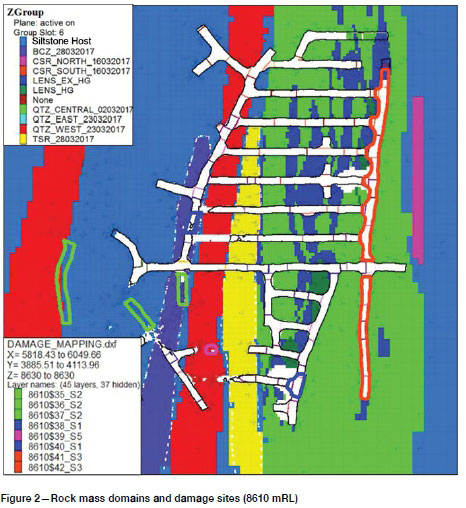
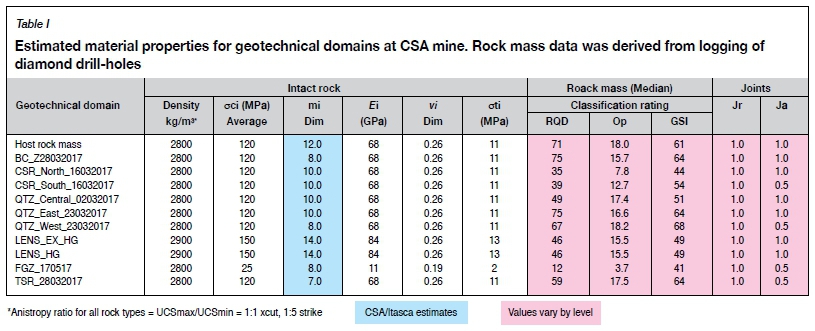
The host rock mass at CSA comprises predominantly steeply dipping, thinly bedded siltstone. The bedding strikes north-northwest and dips west at 80°. The host rock mass also has a northerly trending axial planar cleavage that dips steeply east (80°). Within the siltstone unit, both bedding and cleavage are the dominant structures, with their intensity varying throughout the mine (Hosken Haren, and Winchester, 2006). A shear zone exists in the orebody (QTZ domains, Figure 2), and footwall (TSR domain, Figure 2). The modified tunnelling quality index (Q') is used to classify the rock mass (Table I). The presence of shear zones affects rock mass quality (Q' = 0.05-7.5), especially the joint alteration component of Q'. Most of the rock mass where there is no shear influence has Q' > 4. In the ore zone, inside the shear zone, drives aligned with foliation and disturbed by the stoping stress abutment experience buckling failure and high deformation. High deformation is also experienced at lower stress states in footwall drives aligned with the foliation. The intensity of the shear zone in the footwall drive is overshadowed by bedding. CSA has developed methods to identify, support, and measure ground conditions and deformation in these domains. The mine is generally dry and aseismic.
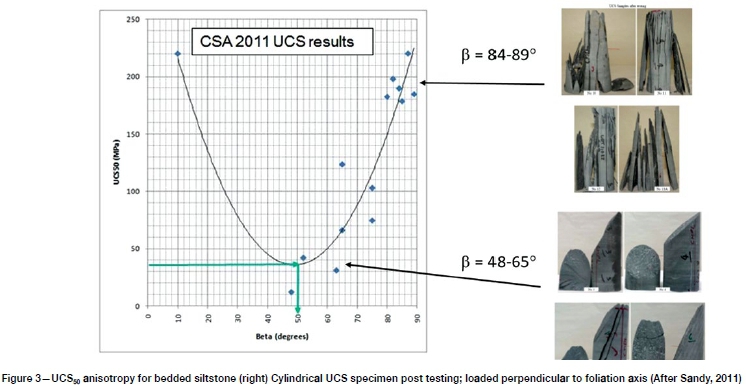
Mechanical response at core scale
The intact rock strength is generally greater than 100 MPa (Table II), but even at the core scale the rock mass is highly anisotropic. The bedding spacing varies both within and across domains and needs to be accounted for in accessing the mechanical response of the rock mass at both tunnel and stope scales. An example of the anisotropic response at UCS50 scale for bedded siltstone is shown in Figure 3. Estimates of the anisotropic intact UCS strength ratio for each domain are presented in the footnote to Table I. The anisotropic ratio at drive scale is unknown, but observations and back-analysis suggests that the ratio may reduce significantly at the 1 m scale to around 2:1, rather than 5:1 as measured in UCS tests core.
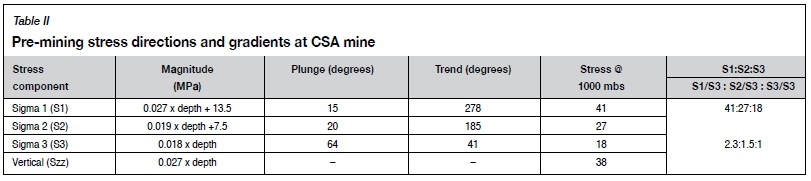
Pre-mining stress state
CSA has a rich history of stress measurements going back to the inception of the CSIRO HI stress cell, but the highly bedded nature of the rock mass makes obtaining valid stress measurements challenging. The accepted major principal stress direction is approximately east-west (see Table I), which agrees with the regional or stress province direction (Lachlan Orogen) documented in Lee et al. (2010). However, the depth-stress gradient of S1 at CSA mine is somewhat lower than the stress province average (i.e., at 1000 mbs, S1 = 41 MPa at CSA compared with S1 = 55 MPa for the stress province average). The stress province average is around 20% higher than the CSA measurements.
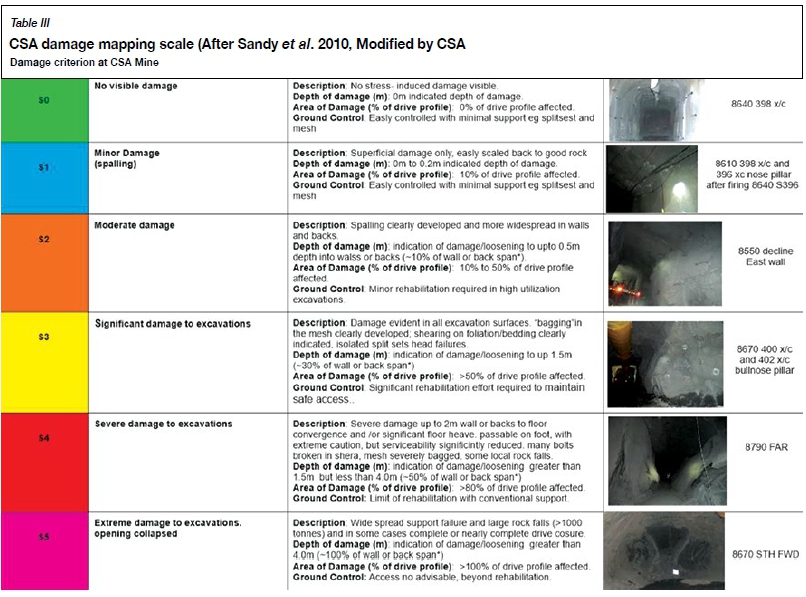
CSA damage scale
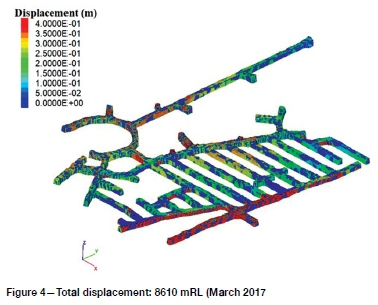
Extensive observational data for damage was collected at 45 sites across the eight levels (8790 to 8580 mRL) to help to understand the key drivers for damage. The first type of data is damage mapping as categorized in Table II, in conjunction with a damage mapping history for each site. The second is lidar laser scanner data, which was used to quantify tunnel convergence at selected tunnels on the lower levels of the mine (see Figure 4).
Observed failure mechanisms and controls
Mining sequence
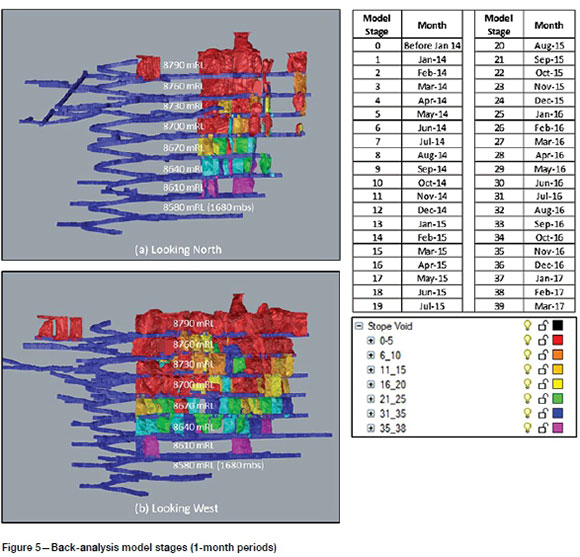
A detailed empirical and numerical back-analysis of tunnel deformation was undertaken for the lower five levels, between 8790 mRL and 8580 mRL, over a 39-month period between January 2014 and March 2017 (see Figure 5). Within the back-analysis volume, stope spans and heights are around 20 m and 25 m respectively. Stopes were filled with cemented hydraulic fill or cemented paste fill. The mining sequence is a central pillar retreat, top down (see Figure 5). The stopes in the hangingwall are mined first, leading to stress shadow footwall stopes and tunnels in the footwall.
Observed damage and failure mechanisms
The back-analysis was performed by firstly decomposing the 45 damage sites into damage domains across the eight levels of interest. A range of model and site investigation parameters within each domain was tabulated and both elastic and inelastic models were run using monthly mining stages to examine the key drivers for damage and to calibrate modelled-to-observed damage.
Initial calibrations attempted to match material properties for each geotechnical domain to damage without consideration of RQD variations within each domain. Using this approach, it was found that damage variations within domains could not be matched. This led to further consideration of the site investigation data and underground mapping. It was discovered that decomposition of each domain by RQD improved the match to observational data. As a result, damage partitions and associated material properties were developed for each domain. A key outcome of the back-analysis was a new appreciation of the importance of regular damage mapping and assessment of failure mechanisms, preferably each month or at least each quarter.
A number of failure configurations or behaviours can be observed in the site investigation data at damage sites. The damage mechanisms are categorized and described used the terminology of Hadjigeorgiou and Karampinos (2017) and Sandy, Gibson, and Gaudreau (2007).
Damage configuration 1: Perimeter drives and ventilation shafts in shear zones
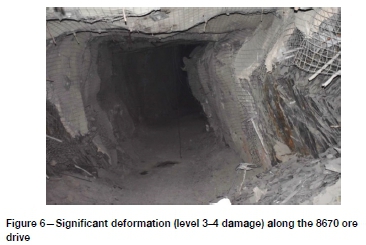
The most commonly observed damage mechanism is buckling in the sidewalls of tunnels driven near-parallel to bedding (e.g., perimeter drives and ore-zone strike drives). These tunnels experience much higher levels of buckling damage than those driven perpendicular to bedding (such as crosscuts). A typical scenario involves the formation of a hinge line or tensile fracture zone as seen in the right sidewall in Figure 6. The authors have observed hinge lines up to 8 m in length in exposures in crosscut sidewalls. Scanline mapping on the 8670 ore drive indicates Q' values of 0.833-3.33 (RQD = 10, Jn = 3, Jr = 0.5, Ja = 2) and sidewall elastic vertical stress states in the order of 60 MPa. By contrast, scanline mapping on the 402 crosscut on 8670 level, which is not in a shear zone, indicates Q' = 12.5 - 25 (RQD = 50, Jn = 3, Jr = 1.5, Ja = 2). No damage was record at this location.
For more purely bucking failures, the onset and intensity of buckling was found to vary with mining-induced stress and rock mass strength (defined by rock quality designation (RQD) and joint alteration). In particular, the mechanical response observed in perimeter and ore zone strike drives occurs at different stress thresholds (and stress paths) and seems to be confined to moderate to poor strength rock masses affected by shears, with very little failure of the backs.
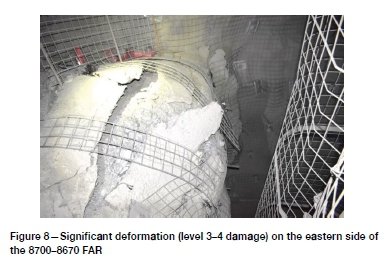
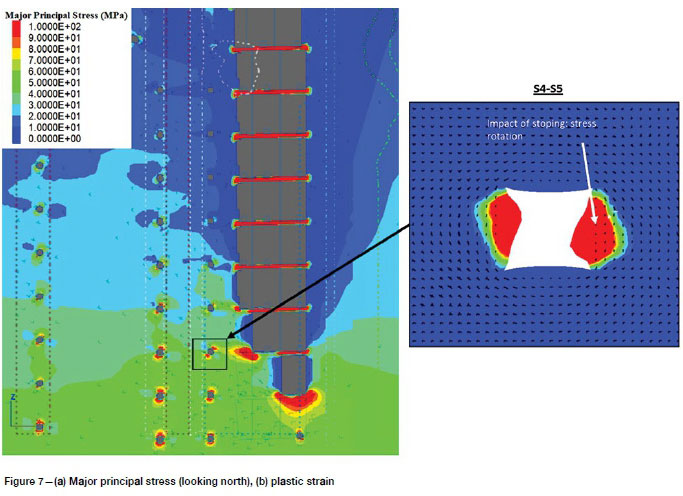
Perimeter tunnels aligned with foliation in moderate stress locations experience buckling on foliation. This is a consideration for access drives in moderate to poor quality rock masses or shear zones (e.g., the TSR domain, Figure 2). In these domains significant deformations occur due to stress changes (stress rotation and changes in shear stress) induced by the stope mining front (see Figure 7a). The typical stress path for a perimeter tunnel starts with high concentrations of stress in the excavation back (and to a lesser extent the sidewalls) that occurs when the isolated excavation is first formed. As the mining abutment approaches, shear stress around the excavation rotates and increases, inducing shear and tensile failure in bedding in the excavation sidewalls and corners (see Figure 7a). Stress rotation (Figure 7a) in particular is thought play a key role in the extension of the zone of damage in tunnel sidewalls, as evidenced by the cessation of deformation after the mining front has past (at least in moderate to poor quality rock masses). After the mining front has passed, deformations are locked in, and shear stress reduces significantly. Deformation typically ceases if the excavations are adequately supported. In badly damaged ground, destressing can accompany increased support loads. Similar deformation responses to stress and strength occur in ventilation raises located in the footwall, which are typically supported heavily with bolts and fibre-reinforced shotcrete (FRS) (Figure 8).
More rarely, some perimeter drives are excavated in very poor quality rock masses that deform regardless of excavation orientation (see Figure 9a), even from the isolated stress state ( e.g. TSR, BCZ, QZT_West domains). These domains typically have RQD < 25 in addition to substantial alteration (such as talc).
The authors assessed the mechanical response of the tunnel to foliation, using the Itasca Model for Advanced Strain Softening (IMASS) constitutive model available in FLAC3D, which was developed by Itasca to simulate rock mass softening, and strength anisotropy due to embedded planes of weakness within a continuum model (Ghazvinian et al.). Within the IMASS model, zone-based matrix and joint properties are specified. Each of these property sets (matrix and ubiquitous joints) can fail in tension and shear independently of one another. It is noted that the ubiquitous joints provide a weakness orientation in each model zone. These joints however are not an explicit representation of individual discontinuities, such as those included in 3DEC. The shear and tensile strength of the ubiquitous joints can be specified, but stiffness properties are not assigned. For the CSA analyses, parameters in this constitutive model were calibrated to damage observations. The application of IMASS allows the effect of tunnel trend and foliation direction on damage to be captured. At CSA, the matrix strength is most relevant to drive backs (especially on the mining abutment) or the side walls of tunnels driven perpendicular to foliation or where foliation is clamped. By contrast, the joint strength is most relevant to tunnels driven parallel to foliation. Both the matrix and joint strength was calibrated for each geotechnical domain or ROD domain.
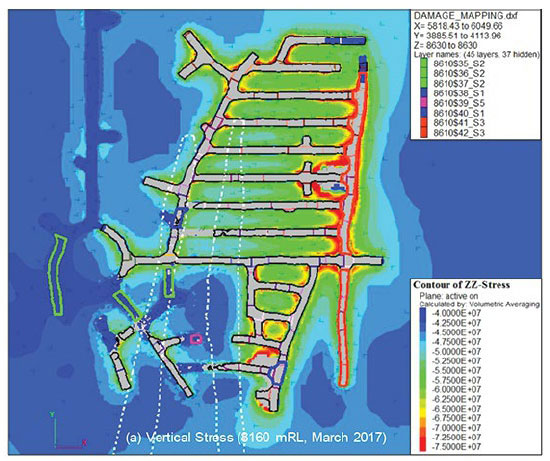
The two key drivers for damage in perimeter drives, found to have good correlation with damage, were the strength of the joints (Figure 9b), and the vertical stress state in the excavation sidewall (Figure 9a), (normalized to drive orientation). The impact of excavation direction for typical footwall drives in a very poor quality rock mass in north- and east-trending drives is shown in Figures 10 and 12 respectively.
It is noteworthy that the elastic vertical stress in the excavation sidewalls (see Figure 10a) is approximately 60 MPa and the major principal stress in the excavation backs is around 100 MPa (see Figure 10c). In contrast, plastic strain (matrix damage) in the excavation backs is not significant (Figure 10b) and joint plus matrix damage (Figure 10d) in the excavation sidewalls leads to sidewall failure and bulking.
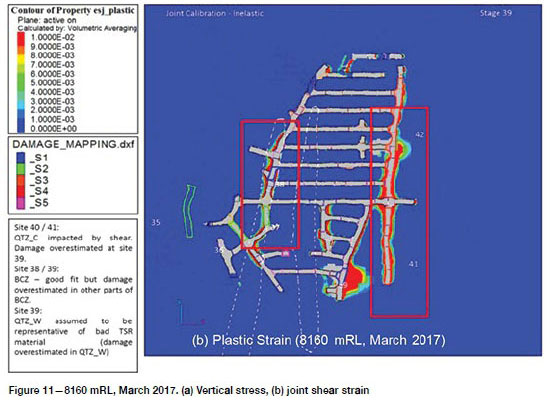
Damage configuration 2: Ore zone drives
In contrast with perimeter drives, damage in strike drives in the ore zone is more strongly influenced by the mining stress abutment and shear zones (see Figures 11a and 11b). For example, scanline mapping on the 8540 level, which is not in a shear zone, indicates Q' = 13-200. It is noteworthy that on the abutment, high stress states exist not only in the backs of tunnels, but also in the sidewalls, leading to two modes of damage. The first is buckling of excavation sidewalls (and pillar noses) due to overstressing of the foliation. As with the perimeter strike drives, the intensity of buckling damage was found to vary with rock mass quality and vertical stress, rather than with major principal stress. A good example of this mode of deformation is shown in Figure 6, where significant deformation along the ore drive in 8670 level (1530 mbs) is observed. This drive squeezed from 5 m to 3 m (40% convergence), necessitating rehabilitation of the drive with ground support and reinforcement installed floor-to-floor. Before deformation, the drive had 50 mm fibrecrete, 2.4 m resin bolts (1.1 m χ 1.4 m spacing) and 5.6 mm welded wire mesh as primary support and 6 m single strand cable bolts (2.2 m χ 2.2 m spacing) as secondary support.
The second damage mode is brittle failure and block rotation in the excavation backs (across the foliation) near brows in high-stress locations. This mode of damage has historically been rare but is becoming more common as the mining depth increases, especially inside the closure pillar. The closure pillar is established when two stope fronts approach each other. To date, very little mining-induced seismicity has been recorded, and it is noteworthy that the rock mass is generally weak and no rockbursts or significant fault slip events have been recorded. Strike ore drives are typically in ore lenses (CSR_N or CSR_S domains). The rock mass compressive strength is generally higher than for perimeter drives in shear zones, and numerical back-analysis suggests it is well approximated by the global strength of Marinos and Hoek (2000).
Comparison with empirical data-sets
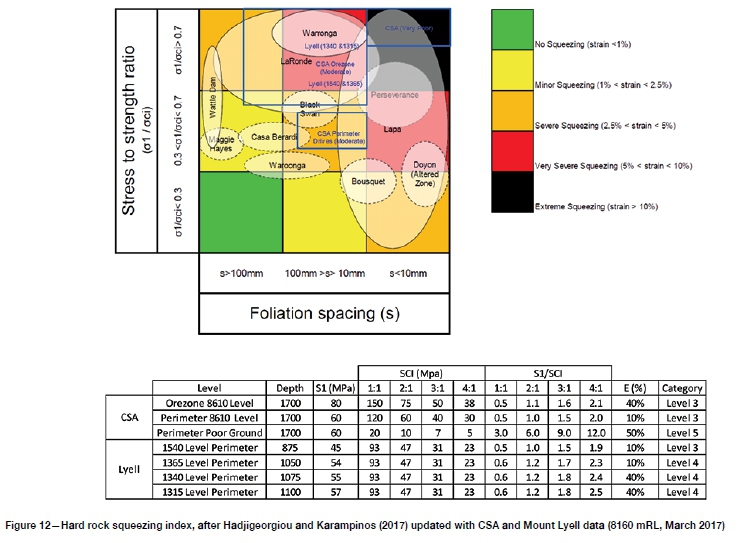
Mercier-Langevin and Hadjigeorgiou (2011) presented a Hard Rock Squeezing Index for underground mines based on case studies from mining operations in Australia and Canada. Hadjigeorgiou and Karampinos (2017) note that this index can provide a first indication of the potential for squeezing and the long-term strain level based on ranges for the foliation spacing and the stress-to-strength ratio.
Seven case studies from CSA and Mount Lyell (after Sharrock and Cuello, 2016) have been added to the chart (see Figure 12). In general, the magnitude of damage estimated from the chart is in broad agreement with underground observations. However, a key observation at CSA is the importance and impact of joint alteration, which is not accounted for in the chart. Future work at CSA will seek to better understand the effects of alteration.
Conclusions
Excavation orientation, rock mass matrix and foliation strength, and stress path are key parameters influencing tunnel damage and convergence at CSA mine. Tunnels driven parallel to foliation (i.e. along strike) experience much higher levels of damage than those perpendicular to foliation. Drives at intermediate angles experience varying levels of damage depending on rock mass strength and stress.
In most of the damage sites, high deformations correlate with shear zones and/or high-stress states or stress rotation and deconfinement. However, more work needs to be done to understand the variability within domains, the role of alteration, and the impact of stress path and stress rotation. A key finding from back-analysis of squeezing and buckling ground behaviour at CSA is the need to look beyond RQD as a stand-alone metric for identifying high-deformation ground conditions. In particular, better observational data from scanlines and damage sites is required to build an understanding of the conditions and mechanisms controlling anisotropic ground behaviour. This work is ongoing and is explored further in Chapula and Sharifzadeh (2019).
Acknowledgements
The authors acknowledge the contributions of Jan Jacobs, Tim Brettell, Cameron Tucker, and Patrick Mukwindidza, who contributed substantially to the collection, analysis, and interpretation of observational data at CSA mine.
References
Chapüla B. and Sharifzadeh M. 2019. Strategies for managing large deformation at CSA Underground Mine. Proceedings of the 14th International Congress of Rock Mechanics, Foz do Iguaçu, Brazil, 13-18 September 2019. [ Links ]
CMPL. 2017. CSA mine, ground control management plan, May 2017. Cobar Management Pty Ltd, Cobar, NSW. [ Links ]
Ghazwnian, E., Garza-Cruz, T., Füenzalida, M., Boüzeran, L., Cancino, C., Cheng, Z., and Pierce, μ. 2020. Theory and Implementation of the Itasca Constitutive Model for Advanced Strain Softening (IMASS), In prep: MassMin 2020, Santiago, Chile. [ Links ]
Hadjigeorgiou, J. and Karampinos, E. 2017. Design tools for squeezing ground conditions in hard rock mines. Deep Mining 2017: Proceedings of the Eighth International Conference on Deep and High Stress Mining. Wesseloo, J. (ed.). Australian Centre for Geomechanics, Perth. pp. 693-706. [ Links ]
Hosken, J., Haren, E., and Winchester, A. 2006. Resource modelling in an evolving mine - CSA Mine, Cobar, New South Wales. Proceedings of the Sixth International Mining Geology Conference, Darwin, NT. 21-23 August 2006. [ Links ]
Dominy, S. (ed.). Australasian Institute of Mining and Metallurgy, Melbourne. pp. 153-166. [ Links ]
Lee, M., Mollison, L., Campbell, A., and Litterbach, N. 2010. Rock stresses in the Australian continental tectonic plate - Variability and controls. Proceedings of the 11th IAEG Congress - Geologically Active New Zealand, Auckland, September 2010. Chin, C.Y., Massey, C.I., McMorran, T.J., Pinches, .G.M., and Williams, A.L. (eds.). CRC Press, Boca Raton, FL. [ Links ]
Marinos, P. and Hoek, E. 2000. Predicting tunnel squeezing problems in weak heterogeneous rock masses. Tunnels and Tunnelling International., Part 1, November, Part 2, December. https://www.rocscience.com/assets/resources/learning/hoek/Predicting-Tunnel-Squeezing-Problems-in-Weak-Heterogeneous-Rock-Masses-2000.pdf [ Links ]
Mercier-Langevin, F. and Hadjigeorgiou, J. 2011. Towards a better understanding of squeezing potential in hard rock mines. Mining Technology, vol. 120, no. 1. pp. 36-44. [ Links ]
Sandy, M. 2011. Strength Anisotropy in Foliated Rocks, Unpublished AMC Consultants Presentation to CSA. [ Links ]
Sandy, M.P., Gibson, W., and Gaudreau, D. 2007 Canadian and Australian ground support practices in high deformation environments. Challenges in Deep and High Stress Mining. Potvin, Y., Hadjigeorgiou, J., and Stacey, D. (eds). , Australian Centre for Geomechanics, Perth. pp. 297-311. [ Links ]
Sandy, M., Sharrock, G., Albrecht, j., and Vakili, A. 2010. Managing the Transition from Low Stress to High Stress Conditions, Proc 2nd Australasian Ground Control Conference in Mining, Sydney 2010. [ Links ]
Singh, B., Jethwa, J.L., Dube, A.K., and Singh, B. 1992. Correlation between observed support pressure and rock mass quality. Tunnelling and Underground Space Technology, vol. 7, no. 1. pp. 59-74. [ Links ]
Sharrock, G.B. and Cuello, D. 2016. Geotechnical milestones at Mount Lyell Mine. Massmin 2016. Proceedings of the Seventh International Conference and Exhibition on Mass Mining, Sydney, Australia, 9-11 May 9-11. Australasian Institute of Mining and Metallurgy, Melbourne. pp 427-438 [ Links ]
Tavakoli, M. 1994. Underground metal mine crown pillar stability analysis. PhD thesis, University of Wollongong, NSW. [ Links ] ♦
 Correspondence:
G.B. Sharrock
gsharrock@itasca.com.au
Received: 31 Jul. 2019
Accepted: 18 Sep. 2019
Published: January 2020

