


Services on Demand
Article
 English (pdf)
 Article in xml format
 Article references
Indicators

Related links
-
 Cited by Google
 -
 Similars in Google
Share

 Permalink
Journal of the Southern African Institute of Mining and Metallurgy
On-line version ISSN 2411-9717
Print version ISSN 2225-6253
J. S. Afr. Inst. Min. Metall. vol.120 n.1 Johannesburg Jan. 2020
http://dx.doi.org/10.17159/2411-9717/862/2020
DEEP MINING PAPERS
Applications for the Hovermap autonomous drone system in underground mining operations
E. JonesI; J. SofoniaII; C. CanalesIII; S. HrabarII; F. KendoulII
IBHP, Adelaide, SA, Australia
IIEmesent, Brisbane, QLD, Australia
IIIUniversidad de Concepción, Chile
SYNOPSIS
The development and application of the Hovermap autonomous flight system are discussed in relation to underground mining, with examples from its early adoption. The current performance of the system and subsequent data interpretation suggest some scenarios in which Hovermap deployment is appropriate. The examples discussed focus principally on improving the detail of observational data from inaccessible areas commonly encountered in underground mines. These insights can then be used in design review and management processes. Recent and future developments in the hardware, software platforms, and the associated data analytics are outlined.
Keywords: LiDAR; automation; drone; underground mining.
Introduction
Mining in deep and high-stress conditions inherently involves risks to both personnel safety and the mining operation. Operating in extreme conditions requires an understanding of the rock mass response to mining-induced stress changes. Mobile scanning data-acquisition methods and interpretations in underground mines have emerged since 2014 (Mining Magazine, 2014). They have been shown to improve the safety, design, and decision-making processes by mining and geotechnical engineers (Beck and Campbell, 2019). More recently, semi- and fully-autonomous drones have facilitated data acquisition for geotechnical rock mass observation and analysis. Just as handheld mobile scanning platforms have provided data within human-accessible areas, drones are now acquiring data from otherwise inaccessible areas.
Overview of the study development of hovermap
Underground mining presents many accessibility challenges. For mines with added challenges such as seismicity, the management of these hazards further increases areas of exclusion. The willingness of companies to permit workers' exposure to such hazards has decreased over recent decades, yet has decreased over recent decades focus on safety has often been associated with increases in the labour, time and cost required to undertake additional inspections. The development of an autonomous drone-based mobile mapping platform provides a viable solution by enabling the remote acquisition of data from excluded and hazardous areas, allowing inspection and analysis without compromising the safety of personnel. The solution presented is a payload that allows commercially available drones to fly in GPS-denied environments.
Over the past two decades, the Australian Commonwealth Scientific and Industrial Research Organisation (CSIRO) has been at the forefront of research into industrial robotics and the development of 3D simultaneous localization and mapping (SLAM) algorithms (Zlot and Bosse, 2012). A specialized group within CSIRO was formed to combine these two internal specialties, enabling the autonomous flight of drones in GPS-denied environments. The SLAM-based autonomous drones were the original prototypes for what is now known as Hovermap. Emesent, a spin-out of CSIRO, has commercialized autonomous drone technology, utilizing real-time processing of 3D SLAM algorithms and further advanced the drone autonomy technologies. The real-time point cloud solution used for drone autonomy can be reprocessed to create a high-resolution point cloud of the environment along the flight path for the purpose of analytics and inspections.
Design and engineering of an autonomous drone system
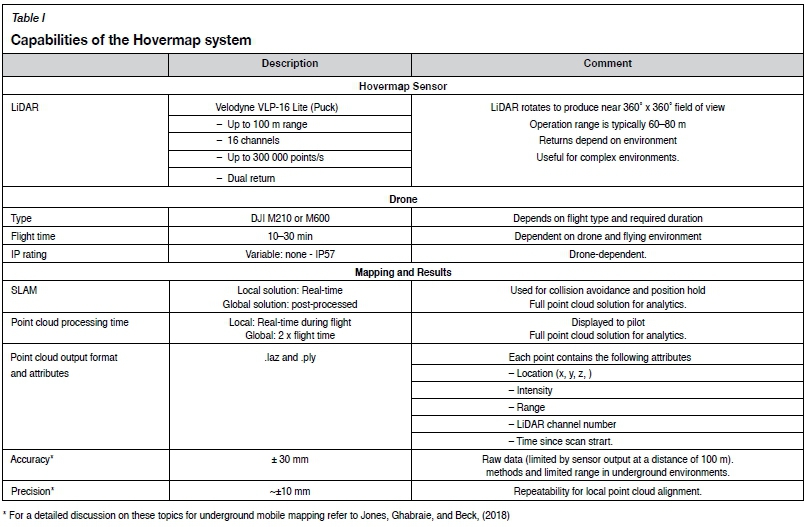
Hovermap is a mobile LiDAR scanner system that can be mounted as a payload beneath a drone, enabling autonomy in GPS-denied environments. It is comprised of a multi-channel LiDAR, an inertial measurement unit (IMU), and an onboard computer. The LiDAR sensor mechanically rotates, changing the intended output from a 360° planar field of view into a 360° χ 360° spherical field of view. For position recognition and sensing, the LiDAR is coupled with a low-grade microelectrical-mechanical system (MEMS) IMU. The IMU data and LiDAR results are processed onboard in real time within the SLAM algorithms to generate the point cloud of the scanned environment. This SLAM solution can interface with the flight controller of compatible drones to provide omnidirectional collision avoidance, position hold, and programmed flights in the GPS-denied and dark environments associated with underground mining operations. Table I summarizes the capabilities of the Hovermap system.
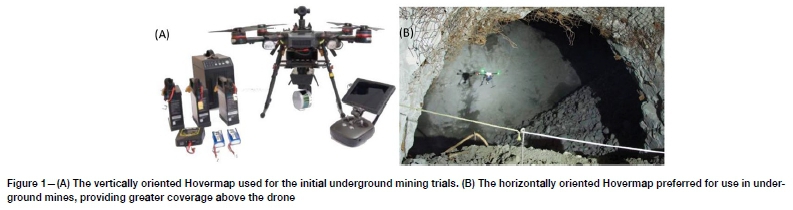
Two LiDAR orientations were developed for the trials and made available commercially. Initially, the LiDAR sensor was located beneath the housing such that is was vertically oriented (Figure 1A). The results showed a region of low point density above the drone due to the shadowing of the aircraft platform. This shadowing coincides with areas that did not have good scan coverage and as such, proved problematic for applications such as drawpoint hangups and coverage of stope crowns. Subsequently, a forward-facing, horizontal orientation was developed (Figure 1B), relocating the shadow to behind the drone in areas previously scanned and with good coverage. This horizontal orientation, therefore, demonstrated as the optimal configuration for underground mining applications.
Methods for obtaining results
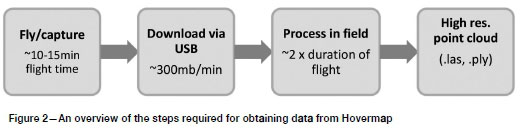
The process of obtaining point cloud data with Hovermap for further analysis can be summarized by four steps, outlined in Figure 2.
Hovermap provides various levels of automation to a drone. In this study, three methods of flight automation were demonstrated in mining environments:
> Autonomy Level 1 - Pilot-assisted mode
- Omnidirectional collision avoidance (virtual bubble surrounding the drone)
- GPS-denied position hold and flight
- Enables safe flight close to structures in GPS-denied environments
> Autonomy Level 2 a - Waypoint mode
- Set waypoints in an existing map for routine preprogrammed GPS-denied flight
- Enables beyond-line-of-sight flight with almost no input from pilot
> Autonomy Level 2b - Tap-to-fly interactive waypoint mode in live stream map
- Set waypoints in a map streamed directly from Hovermap during a flight
- Includes collision avoidance
- Enables beyond-line-of-sight flight with minimal input form pilot.
The required duration of a scan is governed by the mission requirements, including factors such as:
> The area of data capture
> Required point cloud density
> Complexity of features within the scan area
> The battery life of the drone
> Access restrictions.
Flight speeds in underground environments vary depending on the purpose of the flight, air flow speed, and complexity of the environment. Typical underground flight speeds along drives and crosscuts are currently 1-2 m/s. The sensor has also been mounted to a light vehicle and driven at speeds up to 5.5 m/s.
For applications such as flying within a narrow-vein or sublevel open stope, the required flight duration is approximately 5 minutes. This depends on the size of the stope, distance to the stope access, and the required point density within the stope. Although the two stoping methods vary, the flight time is consistent due to flight speeds and proximity to the stope walls. In both cases the resulting point cloud has a higher point density and coverage than conventional stope scanning methods.
Onboard data storage is 480 GB, while the data acquisition rate is approximately 300 MB/min, allowing for full day of data capture. Following a scan, data is transferred from the onboard computer to a secondary processing computer for computation of the global SLAM solution.
SLAM processing is conducted in two stages. The first stage occurs during the scan, providing a fixed time-period local solution. This local solution provides the relative placement of each new datum relative to prior known data-points and features. It is this local 'image' of the current environment that, when coupled with a drone flight controller, provides collision avoidance, position hold, and allows for the placement of waypoints to aid navigation in the GPS-denied environment. The second stage of SLAM processing is conducted after scanning, on a separate computer, providing the global SLAM solution and final point cloud. This global solution uses a range of data from the local SLAM solution, IMU, flight path, and feature recognition throughout the entire scan to produce a correctly scaled and locally referenced solution. If multiple flights have a region of overlap, the processing software accurately merges the multiple scans during processing of the global SLAM solution.
The final output from the post-processing is a high-resolution point cloud containing each of the returns, as well as the trajectory of the scanner. The data format is exported as a non-proprietary, open source format (eg. .laz, .ply, .dxf). Each data-set contains multiple 'attributes' as outlined in Table I.
Each attribute can be analysed and appropriately filtered to ensure that only the most accurate data-sets are used in further analysis. As the data is in standard point cloud format, subsequent analysis can be conducted using many commercially available or open-source software packages.
Georeferencing point cloud results
The registration of point clouds into the mine's local coordinate system can benefit the interpretation for many mining applications. This allows scans to be interpreted with additional local information such a lithology, structure, void, or numerical modelling parameters such as stress. There are multiple methods of georeferencing 3D point clouds, including the use of survey spheres and iterative closest point (ICP) methods.
Survey spheres
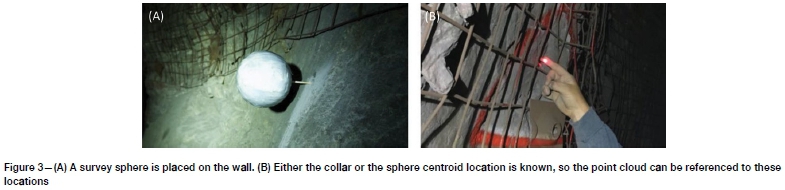
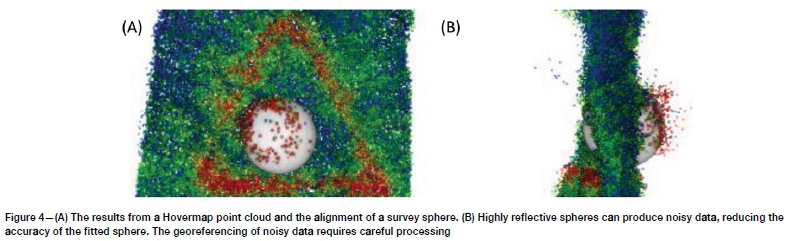
Survey spheres have been used successfully for the purpose of georeferencing a point cloud to a mine's coordinates, yet the approach is more time-consuming than ICP methods. The method involves the placement of three or more survey prisms on the wall (Figure 3). The coordinates of the survey sphere are surveyed using a total station or similar device. During the 3D scan additional time is spent scanning the survey sphere, creating a high-density point cloud and allowing for easy recognition during the post-processing alignment. For the post-processing alignment, a spherical object of the same size as the survey target is created and located at the surveyed location. The high-density spherical point cloud is then fitted to the corresponding spherical object (Figure 4).
The final accuracy of the georeferenced 3D scan relies on ensuring the fitted spherical object is located at the surveyed location, as well as the accuracy of the 3D scan alignment to the spherical object. The alignment of the high-density point cloud to the spherical object can prove difficult if the scan contains a high level of noise, as shown in Figure 4. In this instance, it was found that the high reflectivity of the survey sphere caused the LiDAR sensor to saturate and scatter the resulting data-points. Under these circumstances, the placement of four or more spheres throughout the scan can constrain the degrees of freedom of the global alignment, and with careful processing can improve the accuracy of the point cloud registration. Although georeferencing using survey spheres is a manual alignment process, the advantage is that the survey spheres are at known locations within the mine's coordinate system and the global accuracy of the 3D scan can be calculated.
Iterative closest point registration (point cloud to point cloud or point cloud to mesh)
ICP registration is an iterative method for aligning a point cloud to either a known solid shape, such as a 3D mesh, or to another point cloud. The algorithm is essentially a 3D residual mean square method in the sense that a predetermined allowable error is set and the algorithm will continue to reduce the residual error until either the threshold is met or a maximum number of iterations have been conducted. This method works very well in an underground mining environment as each excavation has a number of features and adjoining intersections. These intersections constrain the final alignment of point cloud registration, improving the accuracy of the final alignment to mine coordinates.
This method works particularly well with Hovermap data, as the LiDAR sensor and SLAM algorithms currently used have proven to produce point clouds with far fewer drift errors than the earlier mobile LiDAR systems used by Jones, Ghabraie, and Beck (2018). This means the use of ICP alignment methods can align Hovermap results into the mine grid very rapidly when another known shape, or pre-existing point cloud, is available.
Summary of georeferencing
There are applications where georeferencing 3D point cloud data into the mine's coordinate system can improve the interpretation of the data. Two methods for georeferencing have been presented, both of which require manual steps within the alignment process. The accuracy of the final georeferenced point cloud can be affected by factors such as the reflectivity of the surface material and hardware errors. The best method to use depends partly on the available information and on the required accuracy of the final alignment.
Case studies for improving mining safety, productivity, and efficiency
Increasing workplace safety is a requirement in underground mines globally. Elimination of people from hazardous environments is one of the benefits of remotely operated autonomous systems. Furthermore, the additional coverage within hazardous environments allows for improved and more in-depth analytics for decision-making. Underground case studies are presented in the following sections, providing an overview of applications where Hovermap data is improving safety and mining insights.
Stope analysis
Initial applications of Hovermap have focused on stope inspections and analysis, the benefits being from a safety and efficiency perspective during data capture, and an analytics and operational perspective from the results.
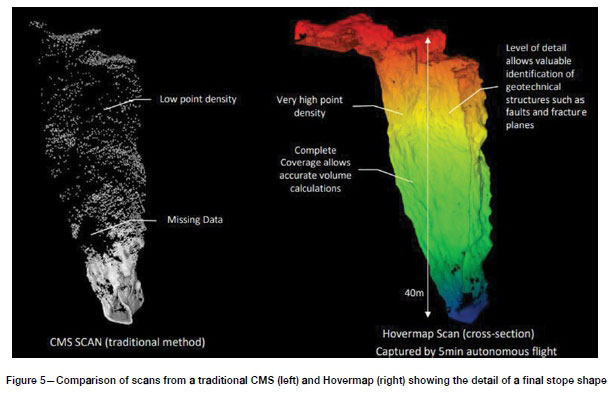
During data capture in a stope, safety is improved by reducing the exposure (in terms of both proximity and duration) of the surveyors undertaking the inspection near the stope's edge or brow. Current cavity monitoring systems (CMS) require surveyors to access the stope as close as possible to the drawpoint or edge of the stope so that the CMS scanner can be positioned as far into the stope as possible. At the drawpoints this can expose the surveyors to sudden rockfall hazards within the stope. Access to the upper levels of an open stope can expose them to any unknown undercutting if it has occurred. At the completion of a CMS scan the surveyors must then retrieve the device, exposing them a second time. A major advantage of the drone from a risk perspective is that it can be operated from a safe distance from the stope, completely removing the risk involved in current CMS methods. The efficiency of data capture is improved as the duration to set up, fly into the stope, and return is typically less than 10 minutes. The results can then be used for an in-depth review of the stope conditions.
Improved data analytics is possible as the drone can fly beyond visual line of sight (BVLOS), past the brow of the stope or hung-up drawpoint. This unprecedented access provides a detailed view of brow conditions and other occluded areas within the stope. The mobile scan significantly reduces shadowing within the results compared to conventional scanning methods, in that current CMS methods use a rotating laser positioned at a static location within a stope. The distribution of measurements is such that there is a high density of data near to the scanner, diminishing with distance. The spatial resolution of CMS data varies from thousands of points to single points per square metre. In comparison, Hovermap data is consistently in this upper range throughout the regions of the stope. A comparison between current CMS and Hovermap results for the same stope is shown in Figure 5.
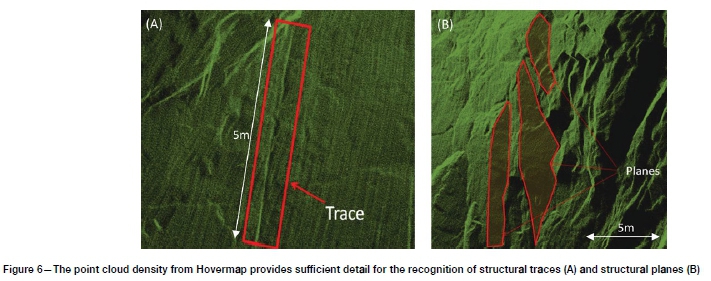
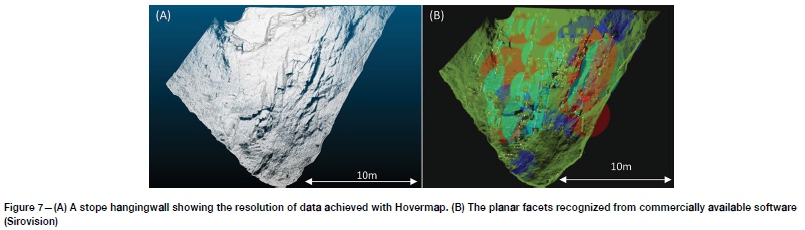
The high-resolution point cloud produced by Hovermap can provide analytics such as stope volume to be reconciled with greater confidence for an indication of production tons and required backfill (where applicable). The precision and density of the Hovermap point clouds allow for the recognition of structural traces and planes (Figure 6), providing geotechnical engineers with insight into the mechanisms responsible for over- and underbreak. The structural characteristics such as dip and azimuth, persistence, roughness, and spacing of features can be extracted and used for rock mass characterization and design purposes. Figure 7 shows an example where over 80 individual geological structures were identified.
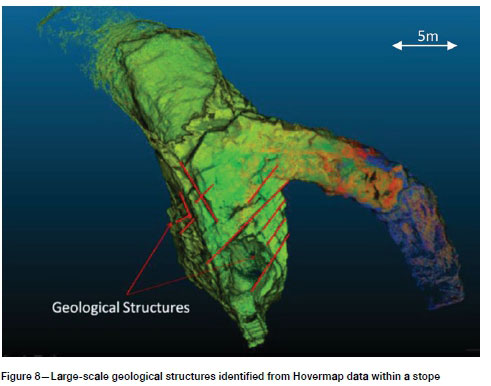
Larger scale structures identified from the high-resolution point clouds can provide geologists and geotechnical engineers with insights for defining the structural model of the mine (Figure 8). These structures also aid in the rock mass classification and domaining parameters used for excavation stability assessments for both development and stopes. Meanwhile, mining engineers can adjust stope dimensions and blast patterns to accommodate the increased knowledge of and confidence in the structures and rock mass characteristics.
The rapid acquisition of detailed point clouds from within stopes is assisting the trial sites and sites that have adopted the technology with improved scheduling and control on stopes. Sites are able to more regularly monitor stope volumes, providing greater insights into the remaining production stocks, fragmentation, and the recognition of instabilities such as chimneying or caving.
Backfill Monitoring
The use of backfill in stopes is largely attributed to the requirement for achieving regional ground control within a mining area. The mode of in-stope support is related to a combination of the rock mass characteristics, the mode of deformation, and the engineered material properties of the fill, as discussed by Brady and Brown (2004, p. 408). In many high-stress mining environments where a high extraction ratio is planned, backfill is used a support element to control unravelling and consequent dilution, and to assist in global stability, acting similarly to a pillar controlling hangingwall and footwall closure.
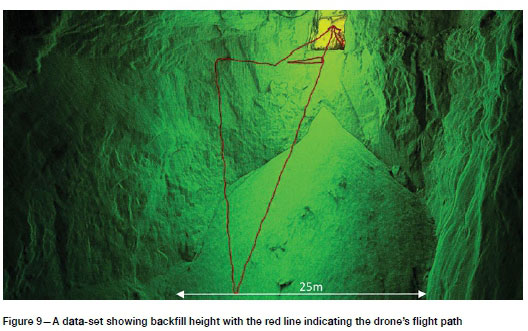
In cases where backfill is used for engineering purposes, the monitoring of the material in high detail can be used to ensure the correct design is being followed. Where a higher strength plug is formed, the accurate measurement of the fill can be used to confirm the correct placement of the material in all areas of the stope. This same confirmation of design can be applied to sites where it is planned to develop back through a backfilled stope, reducing the risk of breaking through to a lower strength material. An example of a stope in the process of backfilling is shown in Figure 9.
In cases where the backfill is not used as an engineered material, regular inspections of backfill height can show the remaining volume available for waste. This knowledge can directly feed into the scheduling requirements for the mine.
Hangup inspections
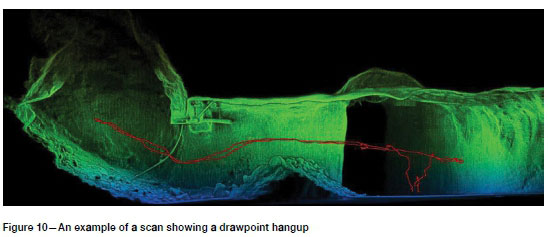
Drawpoint hangups in both stoping mines and caving mines pose a safety hazard to those attempting to clear them and come at a great cost in lost production. Current methods for clearing include blasting and hosing in an attempt to generate movement around the blockage, eventually dislodging the material blocking the drawpoint. Using Hovermap results, mining professionals can capture a better perspective of the blockage for a more targeted approach to its removal. The example shown in Figure 10 is from a block cave where the drone pilot was located in the extraction drive, away from the drawpoint and safely removed from any potential movement. In this example, the Hovermap payload was in the vertical-facing alignment, hence areas directly above the drone were occluded. This highlights the importance of selecting the correct sensor orientation for the task. A horizontal, forward-facing orientation would have achieved a higher point density in the backs, delivering a clearer image of the hangup.
Deformation monitoring and ground support analysis
Most rock mass hazards that personnel are exposed to in underground mines are within development drives. Mining professionals place great importance on ground support for providing a safe working environment, particularly in deep and high-stress mines that are typically subject to dynamic deformation. Jones and Beck (2017) describe mobile scanning hardware and methods for deformation monitoring in underground mines. The accuracy of mobile scanning devices such as Hovermap is sufficient for the recognition of convergence trends and for indicating areas of change in the backs and sidewalls greater than 10 mm. For some stiff rock masses that exhibit rapid, brittle failure, these trends may not be observed using this method. However, in most cases where mobile scanning has been implemented, the change detection has provided greater insights than broad-scale observational mapping, and greater coverage than the sub-millimetre extensometer monitoring the sites had previously conducted.
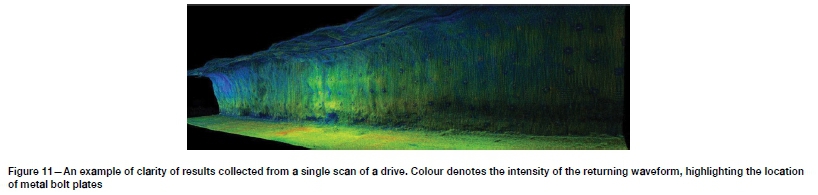
The results from mobile LiDAR provide a range of benefits for deformation monitoring. The trends created from multiple scans indicate closure rates, which in turn provide guidance for the residual capacity, and scheduling for rehabilitation. The displacements provide quantitative data for administrative controls such as Trigger, Action, Response Plans (TARPs). With the inclusion of intensity as a point cloud parameter, the distinction between rock and metal is evident (Figure 11), allowing for improved methods of QA/QC and insights into whether the ground support is acting as a system or as individual elements. New and exciting analytical methods are being developed to better understand rock mass deformation now that near-spatially-continuous, accurate data-sets are collected mine-wide with mobile scanning systems.
Summary of case studies
The applications for the data collected by Hovermap are extensive, improving safety, efficiency, and productivity in underground mines. The case studies outlined above demonstrate just some of the many ways the data may be used by mining and geotechnical engineers, surveyors, and geologists. The enhanced data-sets obtained from the use of Hovermap in underground operations is leading to ongoing research, allowing for the continuous advancement of applications in mining.
The future of automated drones in underground mining
Research to further improve the capabilities of autonomous drones continues. Research outcomes that will soon be deployed include:
> Autonomy Level 3 - Autonomous exploration
- Single-click mission execution
- No waypoints, just point - click - explore - return
> SLAM-based auto-registration
- SLAM-based auto-registration utilizes the metadata collected by hardware to join multiple scans and create a single result, as though it were a single scan
- Quick turnaround on results requiring change detection
> Colourization of point clouds
- Provides additional data for classification
- Photographic-like imagery for further interpretation
> Additional sensors
- Gas detection
- Thermal imaging cameras
- Hyperspectral cameras
> Remote deployment
- Search-and- rescue missions
- Remote re-entry following blasting or seismic events.
The analytics derived from these hardware improvements will result in greater insights into many aspects of a mining operation. However, this requires the development of both IT infrastructure and software capable of storing, analysing, and visualizing the detailed data-sets.
The application of drones and mobile sensor technology in underground mines is in its infancy. During the two years of trials of the Hovermap system and 12 months since commercialization, the number of applications and sites adopting the technology have steadily increased.
Discussion and conclusion
The adoption of mobile mapping techniques has been increasing since the commercial release of the Zeb-1 mobile handheld LiDAR scanner in 2014. The results from this method of data acquisition have shown to provide valuable insights for mining engineering design. Systems previously available either required to be operated by hand or vehicle mounted. These methods have not allowed for any additional information to be acquired in access-restricted environments.
Hovermap has been developed as a drone-mounted payload, providing collision avoidance and drone autonomy, while the resulting 3D point clouds can be georeferenced for analytics. This system addresses the issue of remote access into areas that were previously inaccessible or were deemed too hazardous for mining personnel to enter. The unique combination of autonomy, advanced data acquisition, and high-resolution 3D mobile mapping is providing new insights into underground mine engineering, thus improving safety and mine design.
The site trials mentioned in this article, and commercial deployment since, have produced results that have directly improved safety, efficiency, and productivity in the adopting mines. The examples provided above are some of the more obvious examples of the applications of the data collected. Research and development into additional applications and the automation of processes are ongoing and constitute a major part of the future development of Hovermap and the data it produces.
As drone technology improves, longer flights, and thus scanning times, will be possible. The hardware will be reduced in size, allowing access into tighter spaces, and will become more robust, allowing operation in difficult environments. Advances in sensor technology will generate more accurate and precise point clouds, with longer ranges and a higher resolution. Streamlining the data analytics will get results into the hands of engineers faster, speeding up the decision-making processes. In the end, these outcomes will assist mining companies to achieve their aim of removing personnel from hazardous underground environments, while improving the knowledge of the rock mass and its behaviour.
Acknowledgements
Emesent is grateful to Barrick and Northern Star Resources for their continual assistance during the site trials period.
References
Beck, D. and Campbell, A. 2019. Operations management in seismically active mines. Proceedings of the 53rd US Rock Mechanics/Geomechanics Symposium,, New York, 23-26 June. American Rock Mechanics Association, Alexandria, VA. [ Links ]
Brady, B. and Brown, E. 2004. Rock Mechanics for Underground Mining (3rd edn). Kluwer Academic Publishers, Dordrecht, The Netherlands. [ Links ]
Jones, E. and Beck, D. 2017. The use of three-dimensional laser scanning for deformation monitoring in underground mines. Proceedings of the 13th AusMM Underground Operators Conference, Gold Coast, Australia. Australasian Institute of Mining and Metallurgy, Melbourne. pp. 267-270. [ Links ]
Jones, E., Ghabraie, B., and Beck, D. 2018. A method for determining the field accuracy of mobile laser scanning devices for geomechanics. Proceedings of the 10th Asian Rock Mechanics Symposium, Singapore, 29 October-3 November. International Society for Rock Mechanics and Rock Engineering, Lisbon. [ Links ]
Mining Magazine. 2014. Laser scanner put through paces in SA. https://www.miningmagazine.com/equipment/news/1258218/laser-scanner-paces-sa [accessed 16 December 2019]. [ Links ]
Zlot, R. and Bosse, M. 2012. Efficient large-scale 3D mobile mapping and surface reconstruction of an underground mine. Journal of Field Robotics, vol. 31, no. 5. pp. 758-779. [ Links ] ♦
 Correspondence:
E. Jones
evan.jones1@bhp.com
Received: 1 Aug. 2019
Revised:5 Dec. 2019
Accepted: 22 Jan. 2020
Published: January 2020

