


Services on Demand
Article
 English (pdf)
 Article in xml format
 Article references
Indicators

Related links
-
 Cited by Google
 -
 Similars in Google
Share

 Permalink
Journal of the Southern African Institute of Mining and Metallurgy
On-line version ISSN 2411-9717
Print version ISSN 2225-6253
J. S. Afr. Inst. Min. Metall. vol.119 n.12 Johannesburg Dec. 2019
http://dx.doi.org/10.17159/2411-9717/708/2019
GENERAL PAPERS
Quantification of rock mass weathering using spectral imaging
J. Park; K. Kim
Department of Mining and Geological Engineering University of Arizona, USA
SYNOPSIS
The degree of weathering, a key parameter for evaluating rock mass strength, has traditionally been assessed based on visual inspection by engineers. In an effort to reduce the human bias associated with this approach, a study was conducted to investigate the potential for using spectral imaging to quantify weathering. This entailed developing a portable, rapid method for narrow-band multispectral (NBMS) remote sensing using a spectral index classification algorithm, applying this algorithm to detect weathered features, and then quantifying the degree of weathering based on the percentages of weathered and aperture areas. A case study was conducted on Mt. Lemmon in southern Arizona and spectral images were collected from rock slopes using a visible and near-infrared (VNIR) hyperspectral camera. A two-band ratio approach was used to delineate key areas. Wavelength ratios of 601 nm to 550 nm and 993 nm to 450 nm, were used to delineate weathered and aperture areas respectively on the rock mass. The weathering degree at the test site was then quantified using thematic images. This entailed assessing the percentages of the weathered (22.5%) and aperture (12.5%) areas in the thematic image and using them in a modified Geological Strength Index (GSI) evaluation. The weathering rating (Rw) was classified as 'slight' and scored as '5' based on the percentage of weathered and aperture areas, and the GSI was determined to be 43. This study successfully demonstrated the potential for using spectral information to quantify rock mass weathering, as well as for using the calculated weathering degree to estimate the GSI.
Keywords: remote sensing, hyperspectral imaging, narrow-band multispectral (NBMS) imaging, rock mass weathering, GSI.
Introduction
Rock mass strength - the maximum resistance to external stresses - can be measured via Rock Mass Rating (RMR), the Q-system, and the Geological Strength Index (GSI), among other systems. However, these systems often present challenges for quantifying rock mass conditions, which are used to evaluate slope stability. In the mining industry, these challenges are related to the pit-slope scale, accessibility, and the human bias that is introduced by conventional scanline surveys (or cell mapping), which rely on visual inspection.
Potential sources of error
The degree of weathering, a key parameter in rock mass estimation, introduces a major source of potential error since it relies mainly on visual inspection and subjective evaluation by geological engineers. Weathering typically reduces the strength of the rock mass and accelerates its disintegration (Viles, 2013). For geotechnical applications, visual observations of weathering focus on the disintegration and decomposition of the rock, discolouration, and the presence of decomposed and discoloured rock along discontinuities (Rocha, 1981; Shang et al, 2017). For example, highly weathered granite generally shows separation of mineral grains, discolouration due to iron oxides, increased friability, and the formation of clay minerals (Murphy, 1985). Some researchers have shown that the shape and size of the discoloured areas on the rock mass surface can indicate the relative age of fractures, as well as groundwater infiltration and flow processes (Spreafico et at, 2017; Vilder, Rosser, and Brain, 2017).
To eliminate the human bias in estimation of the degree of weathering, state-of-the-art image processing technologies can be applied. These technologies include spectral imaging and 3D LIDAR (light intensity distance and ranging) imaging. Spectral imaging is especially useful because it can mimic human visual observation but mitigate the limitations related to resolution, colour sensitivity, and bias. In recent decades, images that have been acquired remotely through spectral sensors have demonstrated their utility in geotechnical and geological inspections. They have been used to delineate weathered rock mass surfaces by detecting the diagnostic spectral absorption features of altered minerals (Clark et al., 1990). Likewise, close-range spectral image sensors have been used successfully to detect the delicate changes in mineralogy on a highwall and in the weathering of rock masses (Nieto, Monteiro, and Viejo, 2010; Fraser et al., 2006; Park et al., 2016).
Spectral imaging types and features
Spectral imaging can be classified into two main types -hyperspectral and multispectral - based on the continuity of information in the wavelength domain. Hyperspectral sensors employ over 100 contiguous bands to obtain a continuous reflectance spectrum for a given material, whereas multispectral sensors typically use fewer than ten discrete bands that can be selected to delineate material characteristics. Each pixel of a hyperspectral image contains a full spectrum, whereas each pixel of a multispectral image contains a set of isolated data from separate wavebands.
Therefore, hyperspectral sensors may be better suited to the detailed classification of spectral features (Ferrato and Forsythe, 2013). However, the large number of bands (higher spectral dimensionality) could cause an imbalance between classifiers and the training sample size, known as the Hughes phenomenon (Hughes, 1968), during data analysis. The Hughes phenomenon refers to the decrease in classification accuracy that occurs as the dimensionality of the classifier increases beyond a certain threshold (Bellman, 2015; Hughes, 1968). Furthermore, since scanning each pixel with the full spectral data-set is time- and energy-consuming, hyperspectral imaging is not feasible for field applications, which require fast and portable image acquisition. Thus, lowering the dimensionality is important for practical applications of hyperspectral imaging.
On the other hand, multispectral imaging has fewer, but wider, spectral bands for classifying features. This characteristic supports real-time and online image acquisition without large power or computational load requirements, allowing for sustainable, viable data acquisition for various field applications such as those involving unmanned aerial vehicles (UAVs) (Qin et al., 2013). Therefore, the benefits of multispectral imaging (flexibility and mobility) outweigh the higher analytical capability of hyperspectral imaging in practice.
Fortunately, narrow-band multispectral (NBMS) imaging leverages the advantages of both technologies for feature classification. NBMS was developed as a result of recent advances in optics technology (Surface Optics, 2018). It uses bandpass filters with a narrow bandwidth (approximately 10 nm) to provide more delicate spectral information in real time and thereby improve classification ability and efficiency (Qin et al., 2013).
Study goal and scope
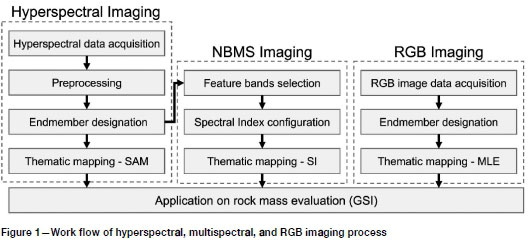
The ultimate goal of this study is to develop an automated rock-mass classification system that will overcome accessibility and human bias issues using advanced image processing technologies. To achieve this goal, a quantitative approach for evaluating the degree of weathering using NBMS imaging was investigated. In the following sections we detail the processes for developing thematic maps using hyperspectral, NBMS, and RGB imaging, and discuss how the quantified weathering degree information was integrated into GSI (rock mass strength) estimates for the study site.
Spectral image acquisition and processing
Spectral image processing was conducted to extract and classify the features of interest from raw hyperspectral data. The geological features of interest (weathered, non-weathered, and aperture areas) were extracted via computational and statistical approaches, using ENVI software and the OpenCV3-Python library. The work flow for the spectral imaging processes is shown in Figure 1.
Data acquisition and study area
Spectral images were acquired using the Surface Optics SOC710-VP hyperspectral camera (SurfaceOptics, 2018). This visible and near-infrared (VNIR) camera has a spectral range of 4001000 nm, which corresponds to wavelengths in the visible light to near-infrared range. Its sensor has a spatial resolution of 696 x 520 pixels and spectral resolution of 128 pixels (bands). Historically, the short-wave near-infrared (SWIR) wavelength range has been applied for mineral identification; however, in this study, the VNIR range was selected for practical reasons such as portability, cost, and fast image acquisition. This range can still mimic an engineer's visual inspection (typically 400-700 nm) for geological surveys.
The study area was an exposed road cut (rock slope) located near Thimble Peak Vista on Mt. Lemmon in southern Arizona, USA. Figure 2 shows an image of the study area. Hyperspectral images were obtained from two subsections, A and B. As shown in Figure 2, the area consisted mainly of granite, with heavily fractured and weathered zones. Several rock chips were also observed. Rock samples, weathered and relatively unweathered, were collected, and the uniaxial compressive strength (UCS) was estimated using a Schmidt hammer and a point load tester.
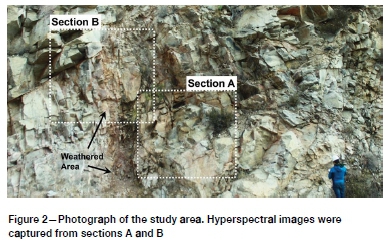
The average estimated strengths of weathered and unweathered samples were approximately 40 MPa and 120 MPa respectively, indicating a significant reduction in strength due to the weathering, multiple fissure systems, and oxidation observed in Figure 3.
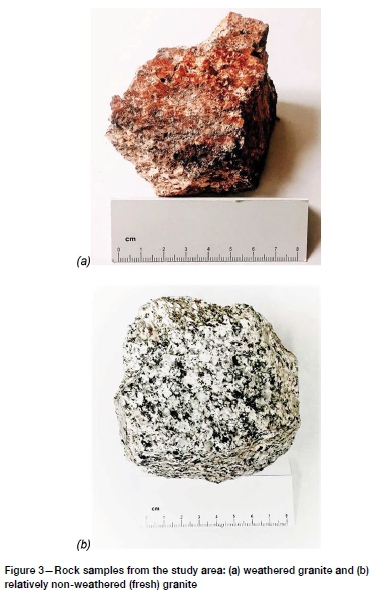
Granite is a competent rock with low porosity and permeability. However, once water infiltrates into the rock mass, areas adjacent to fractures become altered and degraded. The contrast between the weathered and relatively non-weathered (fresh) areas can become more distinct because of the fracture pattern, discolouration, and formation of clay minerals (Riaza et al., 2001).
Pre-processing
Images were pre-processed using raw hyperspectral cubes. This pre-processing included camera calibration, atmospheric correction, and noise reduction.
Camera calibration
Raw data from the hyperspectral camera contains only a digital number (DN) that corresponds to the pixel intensity. Because light conditions affect pixel intensity, data must be calibrated. In this study, the DNs in each element of the hyperspectral cube were normalized and converted to reflectance values based on Munsell (18% reflectance) grey (Munsell, 2019).
Atmospheric correction
Reflectance values were also corrected to compensate for the effects of the atmosphere. This entailed removing the dependence on atmospheric conditions (absorption by molecules, gas, and aerosol) on the surface of the rock mass to improve spectral classification.
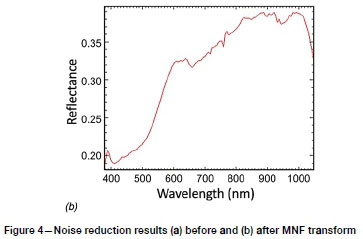
Noise reduction
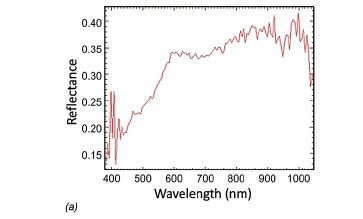
Noise reduction is essential for improving the quality of hyperspectral analyses. The radiance received by the spectral sensor is generally degraded by instrumental noise (thermal, quantization, and photon) (Rasti etal, 2018). Two methods have been commonly used to reduce noise in hyperspectral imagery (Green etal, 1988; Luo etal, 2016): the maximum noise fraction (MNF) and principal component analysis (PCA). For this study, the MNF method was applied as shown in Figure 4. The raw spectral profile of a pixel is shown in Figure 4a. After noise reduction, the small spikes, which are considered minor components of the profile, were eliminated to produce the smoother curve that is shown in Figure 4b.
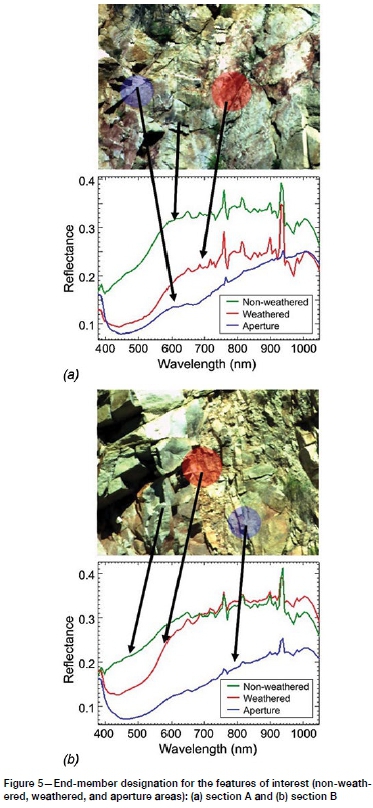
End-member designation
Hyperspectral images can be classified based on a representative spectral profile of each feature that mimics an engineer's visual inspection. The process of designating the spectrally pure constituent that corresponds to each feature of interest is referred to as 'end-member designation'. Three designated areas -weathered, relatively non-weathered (background), and aperture - were identified for this study site. The representative spectral profiles for each end-member were derived by averaging pixel reflectance across wavelengths. Hundreds of spectra from each end-member were manually selected from these three areas. The profiles for each end-member are shown in Figure 5.
Feature band selection and spectral index
Detecting features of interest from raw images is difficult using single-band methods. First, the contrast between the weathered/ aperture areas and non-weathered areas (background) may be insufficient. In addition, single-band methods pose a higher risk of encountering misclassified pixels that have similar intensity values to feature areas (Sun etal, 2018). To intensify this contrast and show a uniform response across the entire rock mass, a spectral index (or 'band ratio') can be used. An example of a band ratio is the well-known normalized difference vegetation index (NDVI). Configured with red and NIR bands, NDVI has been widely used to identify vegetation areas.
In this study, a band ratio was used to identify weathered and aperture areas. This ratio was developed by selecting a couple of bands at specific wavelengths based on the spectral profile of the end-members shown in Figure 5. The most effective band ratios (those with the highest contrast between reflectances) were identified for weathered and non-weathered areas and for aperture and non-weathered areas.
Weathered index (Wl)
On weathered areas of the rock mass surface, the granite was discoloured, indicating biotite and feldspar alteration that occurs when water flows through fractures and forms reddish-brown iron oxides (Riaza et al., 2001). This discolouration was assumed to be a good indicator of weathering; consequently, this study mostly focused on the discoloured and aperture areas, as suggested by the work of other researchers (Shang et al, 2017; Spreafico et al.., 2017; Vilder, Rosser, and Brain, 2017). To evaluate the weathered area, a weathered index (WI) was determined as the ratio of two wavelengths - 550 nm (green) and 601 nm (orange):
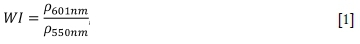
where p is the reflectance value at a specific wavelength.
Aperture index (Al)
An aperture is an open discontinuity on the rock mass that is filled with air or water. Once the rock wall is subjected to high tensile stress or the existing fracture is eroded by weathering, the aperture density increases (Singhal and Gupta, 2010). As shown in Figure 5, the spectral reflectance of an aperture at a short wavelength is almost zero, but reflectance increases at longer wavelengths. Thus, the ratio between the blue (450 nm) and NIR (993 nm) bands provided good contrast for aperture detection. Aperture index (AI) was determined as the ratio of these two wavelengths as follows:
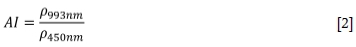
where p is the reflectance value at a specific wavelength.
Occlusion index (01)
Shaded ('occluded') areas, which have low reflectance and intensity values, disrupted digital image processing. To evaluate the effectiveness of hyperspectral classification across these areas, an image mask was created using an occlusion index (01) and applied during thematic mapping. The 01 was defined as a combination of the NIR band (993 nm) and two blue bands (400 nm and 450 nm) as follows:
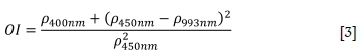
where p is the reflectance value at a specific wavelength.
Thematic mapping and quantification
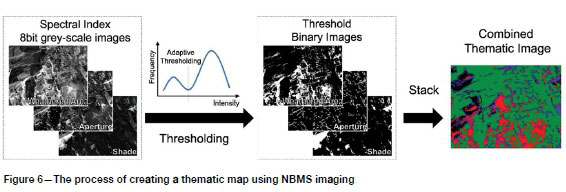
Thematic mapping shows the spatial distribution of the features of interest on the image. It involves mapping the spectral index values in image pixels to a 16-bit grey scale. To classify features on the map in a binary way, a threshold was then defined to distinguish weathered and aperture areas from non-weathered (background) areas. This process was automated using the adaptive threshold technique (Otsu, 1979) instead of using a fixed (absolute and specific) threshold value. It determines the thresholding values based on the relative difference between the intensity of the featured object and background, mitigating the misclassification caused by the global intensity gradient. The binary images of each spectral index were all combined to create a thematic map. The overall process of thematic mapping and image processing is described in Figure 6. Non-weathered, weathered, aperture, and shaded areas are shown in Figures 7c and 7d as green, red, blue, and black respectively.
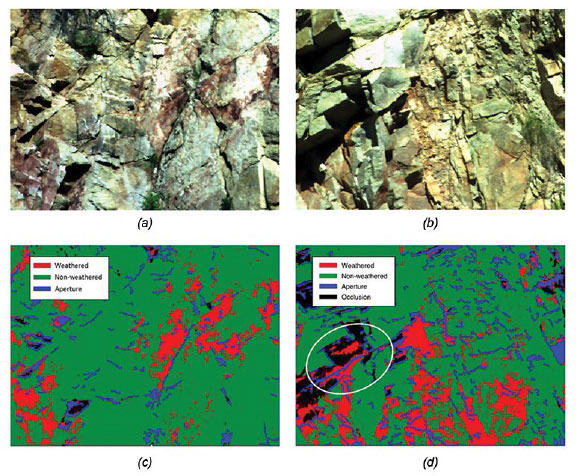
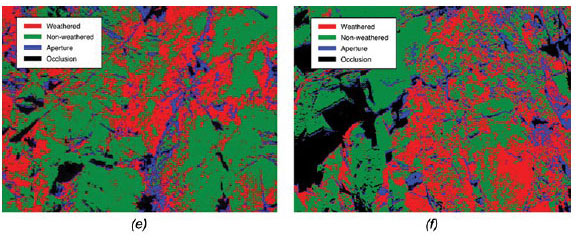
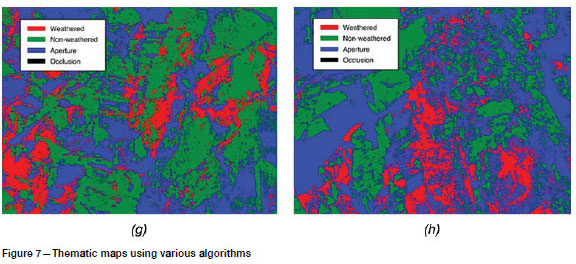
Other approaches - the use of Spectral Angle Mapper (SAM) and RGB analysis - were also applied for comparison with hyperspectral full-band analysis via NBMS. SAM uses the similarity between spectral vectors to classify target features. It offers a key advantage: the ability to classify target features under different sunlight conditions since it depends only on the directions of spectral vectors, not their magnitudes (De Carvalho and Meneses, 2000). In this study, the spectral vector of each image pixel was compared to that of each end-member. Note that the reference spectral information of each end-member for SAM was the same as the designated end-members shown in Figure 5. If a spectral vector at the arbitrary pixel showed the best similarity with the reference spectral vector of the 'weathered' end-member, then the pixel was classified as 'weathered', since the best similarity produces the smallest spectral angle. The thematic images developed using SAM are shown in Figures 7e and 7f. RGB analysis of normal digital images, a relatively simple and cost-efficient method, was also used to evaluate the relative capability of weathering classification. This method has been used to detect rock weathering by other researchers (Spreafico etal, 2017; Vilder, Rosser, and Brain, 2017). In this study, a maximum likelihood estimation algorithm was applied to classify the weathered and aperture areas. The thematic maps using RGB analysis are shown in Figures 7g and 7h.
Compared to other approaches, the spectral index images (Figures 7c and 7d) analysed using NBMS showed the most reasonable results. The NBMS algorithm never misclassified non-weathered points as weathered; it also produced better results for shaded areas and for weathering/aperture classification. The shaded areas (the black, masked areas on the left side of section B) did not influence the spectral classification of the aperture and weathered areas from the non-weathered areas in the spectral index images. In addition, NBMS successfully delineated the hidden aperture under the shaded area, shown in the white circle in Figure 7d, whereas the SAM and RGB images failed to even detect this aperture line. For weathering classification, the RGB analysis yielded similar results to the spectral index image; however, this method could not discriminate between the aperture area and occlusion and it overestimated the size of the aperture. In addition, because the RGB colour space uses only three bands, this method is susceptible to changes in illumination conditions (for example, during sunset) (Angelopoulou, 2000).
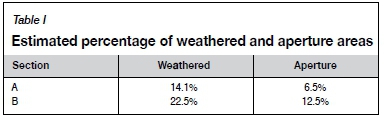
Calculation of percentages of weathered, aperture, and background areas
Weathering was then quantified by calculating the percentage of classified pixels in the weathered and aperture areas over the entire image. Table I shows the percentage of weathered and aperture areas for sections A and B. The weathered areas comprise 14.1% and 22.5% and the aperture areas comprise 6.5% and 12.5% of sections A and B, respectively.
Application to GSI system
Spectral indexes from two-band ratios were calculated and used to delineate the discoloured and aperture areas. The quantified weathering in section B at the study site was used to evaluate the rock mass via the GSI system (Hoek and Brown, 1997).
The GSI system estimates the condition of the rock mass or slope based on its structure and surface conditions. The structure rating (SR) considers block size and the interlocking of rock blocks; the surface condition rating (SCR) considers weathering, persistence, and the condition of discontinuities. GSI scores can range from 10 to 85. Higher values represent good/intact rock mass conditions, whereas lower values represent poor/fractured conditions. A key challenge for GSI estimation is that joint surface conditions are based on qualitative guidelines, which induce human bias, rather than quantitative calculations.
Sonmez and Ulusay (1999) proposed a modified version of the GSI system, also known as the Turkish GSI. The SR parameter describes the geometric characteristics of joints (joint space and density) and can be calculated as follows:

where Jv, is the volumetric joint count (joints per m3).
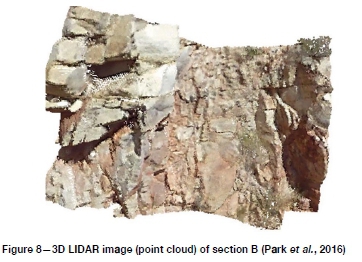
Traditionally,Jv, has been assessed using a conventional scanline survey (or cell mapping). In this study, a 3D L1DAR image was used to estimate Jv in section B, as shown in Figure 8. The overall process of data acquisition and manipulation, demonstrated in a previous publication by the authors (Park et al., 2016) entailed obtaining the 3D point-cloud data using a FARO X330 scanner with 2 mm resolution and analysing the data using Split FX software (Version 2.3, Split Engineering, Tucson, AZ). The analysis identified joint orientations and the virtual planes of rock mass discontinuities. The joint number was counted using virtual scanlines from the 3D model.
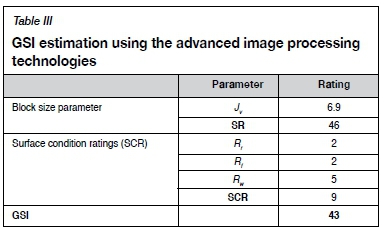
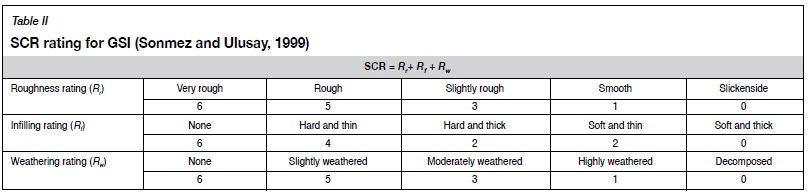
The SCR parameter can be obtained simply by summing the roughness (Rr), filling (Rf, and weathering (Rwratings, which range from 0 to 6, as shown in Table II. In this study, Rrand Rf were obtained using the 3D LIDAR image from Park et al. (Park et al., 2016; Mansfield and Kemeny, 2009). These values are shown in Table III. Rrwas calculated from the Fisher K of each triangulated unit mesh surface (Park et al., 2016), and R was determined by visual inspection of section B.
Traditionally, Rwis determined by visually inspecting the degree of weathering in the rock mass in accordance with the International Society for Rock Mechanics (ISRM) guideline (Rocha, 1981). Consequently, to estimate Rwfor this study the percentages of the weathered and aperture areas were calculated as previously noted and Rwwas tentatively quantified by assuming a linear correlation with the average percentage of these areas. Since Rwranges from 0 (very weathered) to 6 (not weathered/intact), the average percentages were converted to Rw using Equation [5].
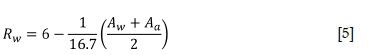
where Awis the percentage of the weathered area, Aais the percentage of the aperture area, and the constant 16.7 is the coefficient that was derived to convert these values from a percentage (0 to 100) to the Rwrange of 0 to 6.
For section B, the estimated values of the constituent parameters and GSI are summarized in Table III. The Rwat section B was classified as 'slight', with a score of 5, and the GSI was 43 according to the chart in Sonmez and Ulusay's study (Sonmez and Ulusay, 1999). The other parameters were obtained from the authors' previous study (Park et al., 2016).
To assess the validity of this approach, a traditional visual inspection was conducted to determined Rw. (Rocha, 1981). Based on this inspection, section B scored '3', indicating moderate weathering. Further studies are required to understand why this result differs from the Rwof 5 obtained using the spectral imaging methods described in this paper. These studies are recommended in the following section.
Conclusions and future work
In this study we proposed a quantitative approach for measuring the degree of rock mass weathering using a simple spectral index classification algorithm, referred to as NBMS imaging. A simple two-band ratio was applied to delineate weathered and aperture areas. The weathered area was delineated using the wavelength ratio of 601:550 nm, the aperture area using the wavelength ratio of 993:450 nm. Compared to a full-band hyperspectral imaging analysis, NBMS imaging successfully demonstrated the potential for quantifying the degree of weathering. This quantified weathering was also applied to estimate the (modified) Turkish GSI by converting the percentage of weathered and aperture areas into the weathering parameter, Rw, in the GSI system. The study results also showed the potential for applying the quantified weathering degree using NBMS imaging to estimate rock mass strength. However, using the weathered area percentage as input for GSI determination has several limitations that require additional study, as noted below.
It was assumed that the relationship between Rwand the percentage of the weathered area is linear; however, it could be nonlinear. This relationship should be verified.
The weathering parameter, Rw, depended largely on the threshold level in the thematic map - for example, a higher threshold level would underestimate the weathered areas, resulting in higher values. The threshold value should be site-specific for the GSI application and consider the rock type, climate, and engineering purpose {e.g., mining industry, civil industry), etc.
The Rwwas influenced by uneven illumination conditions at the test site. This problem was alleviated by applying the adaptive threshold method and using an occlusion image mask; however, further studies are required for various lighting conditions.
Rock mass weathering was quantified only from image processing technologies and therefore captured only surface conditions; it did not consider the thickness of the weathered zone.
To detect the specific features of clay minerals and delineate their distribution, SWIR spectrometry is required. In this study, VNIR-range spectrometry was applied for practical reasons, and the presence of clay minerals - a major factor in rock weathering - was not considered.
ORCiD ID:
J. Park: https://orcid.org/0000-0002-8046-8716
K. Kim: https://orcid.org/0000-0002-3996-7150
References
Angelopoulou, E, 2000, June, Objective colour from multispectral imaging. Proceedings of the European Conference on Computer Vision, Springer, Berlin, Heidelberg. pp. 359-374. [ Links ]
Bellman, R.E. 2015, Adaptive Control Processes: A Guided Tour, vol, 2045, Princeton University Press. pp. 203-216. [ Links ]
Clark, R.N., King, T.V., Klejwa, M,, Swayze, G.A., and Vergo, N, 1990, High spectral resolution reflectance spectroscopy of minerals, fournal of Geophysical Research:SolidEarth, vol. 95(B8). pp. 12653-12680. [ Links ]
De Carvalho, OA, and Meneses, PR, 2000, Spectral correlation mapper (SCM): an improvement on the spectral angle mapper (SAM), Summaries qf the 9th fPL Airborne Earth Science Workshop, 23-25 February 2000, JPL Publication 00-18, Jet Propulsion Laboratory, National Aeronautics and Space Administration, La Canada Flintridge, CA. [ Links ]
Ferrato, L.J. and Forsythe, K.W. 2013, Comparing hyperspectral and multispectral imagery for land classification of the Lower Don River, Toronto, fournal of Geography and Geology, vol. 5, no. 1, pp. 92-107. [ Links ]
Fraser, S.J., Whitbourn, L., Yang, K., Ramanaidou, E., Connor, P., Poropat, G., Soole, R., Mason, P., Coward, D., and Phillips, R. 2006, Mineralogical face-mapping using hyperspectral scanning for mine mapping and control. Proceedings of the 6th International Mining Geology Conference, Darwin, NT, Australia, Australasian Institute of Mining and Metallurgy, Melbourne. pp. 21-23. [ Links ]
Green, A.A., Berman, M., Swttzer, P., and Craig, M.D. 1988, A transformation for ordering multispectral data in terms of image quality with implications for noise removal, IEEE Transactions on Geoscience and Remote Sensing, vol. 26, no. 1 pp. 65-74. [ Links ]
Hoek, E, and Brown, E.T. 1997, Practical estimates of rock mass strength. International fournal of Rock Mechanics and Mining Sciences, vol. 34. no. 8. pp. 1165-86. [ Links ]
Hughes, G. 1968, On the mean accuracy of statistical pattern recognizers, IEEE Transactions on Information Theory, vol. 14. no. 1, pp. 55-63. [ Links ]
Luo, G., Chen, G., Tian, L., Qin, K., and Qian, S.E. 2016, Minimum noise fraction versus principal component analysis as a preprocessing step for hyperspectral imagery denoising, Canadian fournal of Remote Sensing, vol. 42. no. 2. pp. 106-116. [ Links ]
Mansfield, CH, and Kemeny, J, 2009, The use of terrestrial LIDAR in determining directional joint dilation angle values. Proceedings of the 43rd US Rock Mechanics Symposium and 4th US-Canada Rock Mechanics Symposium. Asheville, NC, 38June- 1 July, America Rock Mechanics Association, Alexandria, VA. [ Links ]
Munsell. 2019, Munsell neutral value gray scale, https://munsell,com/color-products/color-standards/munsell-neutral-value-gray-scales/ [accessed 12 May 2019]. [ Links ]
Murphy, W,L, 1985, Geotechnical descriptions of rock and rock masses. Technical report no. WES/TR/GL-85-3. Geotechnical Laboratory, Army Engineer Waterways Experiment Station, Vicksburg, MS. [ Links ]
Nieto, J.,I, Monteiro, S.T., and Viejo, D. 2010, 3D geological modelling using laser and hyperspectral data. Proceedings of the 2010 IEEE International Geoscience and Remote Sensing Symposium, Honolulu, Hawaii, 25-30 July 2010, IEEE, New York, pp, 4568-4571. [ Links ]
Otsu, N, 1979, A threshold selection method from gray-level histograms, IEEE Transactions on Systems, Man, and Cybernetics, vol. 9, no. 1. pp. 62-66. [ Links ]
Park, J., Bates, M., Jeong, Y.S., Kim, K.M., and Kemeny, J. 2016, Creating a digital outcrop model by using hyper-spectrometry and terrestrial LiDAR, Proceedings of the 50th US Rock Mechanics/Geomechanics Symposium, American Rock Mechanics Association, Alexandria, VA. [ Links ]
Qin, J., Chao, K., Kim, M.S., Lu, R., and Burks, T.F. 2013, Hyperspectral and multispectral imaging for evaluating food safety and quality, fournal of Food Engineering, vol. 118, no. 2, pp. 157-171, [ Links ]
Rasti, B., Scheunders, P., Ghamisi, P., Licciardi, G., and Chanussot, J. 2018, Noise reduction in hyperspectral imagery: Overview and application. Remote Sensing, vol. 10, no. 3. p, 482, doi:10.3390/rsl0030482 [ Links ]
Riaza, A., Strobl, P., Beisl, U., Hausold, A., and Muller, A, 2001, Spectral mapping of rock weathering degrees on granite using hyperspectral DAIS 7915 spectrometer data. International fournal of Applied Earth Observation and Geoinformation, vol. 3, no. 4, pp. 345-354. [ Links ]
Rocha, M, 1981, Basic geotechnical description of rock masses. International fournal of Rock Mechanics and Mining Sciences, vol. 18, no. 1. pp. 85-110. [ Links ]
Shang, J., Hencher, S.R., West, L.J., and Handley, K. 2017, Forensic excavation of rock masses: a technique to investigate discontinuity persistence, Rock Mechanics and Rock Engineering, vol. 50, no. 11, pp. 2911-28. [ Links ]
Singhal, B.B.S, and Gupta, R.P. 2010, Applied Hydrogeology of Fractured Rocks, Springer. [ Links ]
Sonmez, H. and Ulusay, R. 1999, Modifications to the geological strength index (GSI) and their applicability to stability of slopes. International fournal of Rock Mechanics and Mining Sciences, vol. 36, no. 6. pp. 743-60. [ Links ]
SplitEngtneering, 2018, Split FX software. https://www.spliteng.com/products/split-fx-software [accessed 15 November 2018]. [ Links ]
Spreafico, M.C., Franci, F., Bitelli, G., Borgatti, L., and Ghirotti, M. 2017, Intact rock bridge breakage and rock mass fragmentation upon failure: quantification using remote sensing techniques. The Photogrammetric Record, vol. 32, no. 160. pp. 513-536. [ Links ]
Sun, Y., Xiao, H., Tu, S., Sun, K, Pan, L., and Tu, K. 2018, Detecting decayed peach using a rotating hyperspectral imaging testbed, LWT - Food Science and Technology, vol. 87. pp. 326-332. [ Links ]
SurfaceOptics, 2018, Hyperspectral imaging sensors. https://surfaceoptics,com/products/hyperspectral-imaging [accessed 15 November 2018]. [ Links ]
Vilder, S.J., Rosser, N.J., and Brain, M.J. 2017, Forensic analysis of rockfall scars, Geomorphology, vol. 295, pp. 202-14. [ Links ]
Viles, HA, 2013, Linking weathering and rock slope instability: non-linear perspectives. Earth Surface Processes and Landforms, vol. 38. no. 1. pp. 62-70. [ Links ]
 Correspondence:
K. Kim
Email: kimkm@email.arizona.edu
Received: 9 Apr. 2019
Revised: 30 May 2019
Accepted: 22 Oct. 2019
Published: December 2019

