


Serviços Personalizados
Artigo
 Inglês (pdf)
 Artigo em XML
 Referências do artigo
Indicadores

Links relacionados
-
 Citado por Google
 -
 Similares em Google
Compartilhar

 Permalink
Journal of the Southern African Institute of Mining and Metallurgy
versão On-line ISSN 2411-9717
versão impressa ISSN 2225-6253
J. S. Afr. Inst. Min. Metall. vol.119 no.11 Johannesburg Nov. 2019
http://dx.doi.org/10.17159/2411-9717/18/028/2019
GENERAL PAPERS
Milling circuit optimization study for Kroondal no. 1 platinum concentrator
N.S. LameckI; J. KiriginI; J. MaphosaII
IMultotec, South Africa
IIMinopex-Kroondal 1 Concentrator, North West, South Africa
SYNOPSIS
Multotec was engaged by MINOPEX to provide support aimed at improving the performance of the milling circuit at Kroondal no. 1 concentrator.
A sampling campaign was carried out around the circuit with the objectives of minimizing scats generation, increasing product fineness to meet the envisaged grinds, and investigating the possibility of increasing throughput. The scope of work included determining the optimum lifter profile that would provide the necessary mode of breakage, the optimum top ball size required to break the top feed size, as well as the energy required to achieve the target grind for the current F80. The lifters installed and operating conditions were analysed to determine the impacts they might have on the performance of the mill. This led to optimization of the liner design to effect the improvements.
Changes to the lifter profile aimed at achieving the required charge behaviour without adversely affecting liner life were recommended for the primary and secondary mills. No changes were recommended regarding the top ball sizes.
There were limitations to what the primary mill could achieve because of the available mill power and operating conditions. The secondary mill was observed to draw more power than was necessary. This power was being lost without achieving the required milling. Recommendation was made to reduce power input for the secondary mill from 4410 kW to 3630 kW. This would not have an adverse effect on the grind.
Other options to improve the grind included consideration of mill filling and percentage solids. These required further grinding laboratory tests for verification.
The impact of the recommended changes is being evaluated and consultation is ongoing.
Keywords: milling, optimization, lifter profile, ball size, mill power, mill speed.
Introduction
Kroondal no. 1 platinum concentrator, operated by MINOPEX SA, treats UG2 ore. Until 2010/2011, the primary mills were operated as rod mills running at 68% of critical speed. The rod mills were subsequently converted to ball mills. At the end of April 2013, the gearbox of primary ball mill no.
1 was changed in order to run the mill at 78.4% of critical speed with the aim of running at higher tonnages while delivering the same grind. However, the objective was not achieved; instead, the throughput decreased and more scats (particles that are too coarse to be ground in the ball mill) were generated. Following this observation, the speed of the mill was reduced to the previous speed of 68% critical.
The concentrator staff carried out a sampling campaign at the end of August 2013, by which time the mill speed had already been changed back to 68% critical. A further sampling campaign was carried out at the end of March to early April 2014. The mill was still producing scats, though less than at 78% of critical speed.
The original milling circuit design for the Kroondal platinum concentrator was based on the following:
> Primary milling discharge of 30% passing 75 μm
> Secondary milling discharge of 67-72% μm, with natural fines grits.
Comminution circuit description
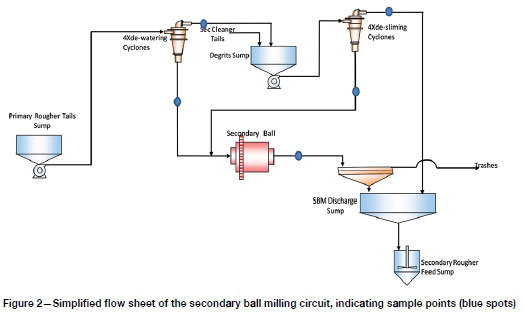
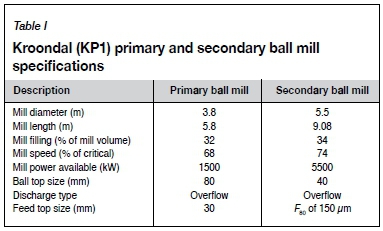
The Kroondal (KP1) plant consists of two primary ball mills converted from rod mills, which are running in parallel, and a secondary ball mill. The primary mills are lined with composite rubber liners while the secondary mill is lined with a rubber liner. Figure 1 shows the primary milling circuit, and Figure 2 the secondary milling circuit, with the sampling points during the Minopex-Kroondal 1 and Multotec sampling campaign indicated.
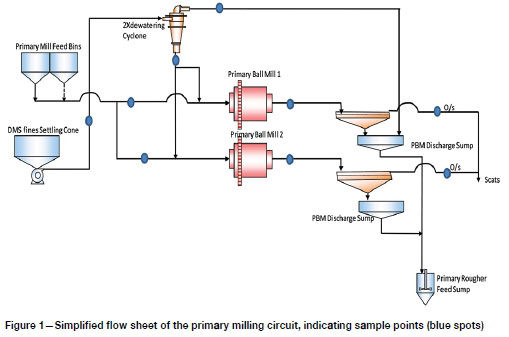
Primary mill feed consists of DMS sinks, fines from DMS flash flotation tailings, DMS effluent, and primary cleaner tailings. The discharge from each primary mill is combined with mill feed cyclone overflow and pumped to the primary rougher flotation feed surge tank.
Primary rougher tailings are sent to a dewatering cyclone, the underflow is sent to the secondary mill, while the overflow goes to the desliming cyclone feed tank. The secondary cleaner tails stream is combined with the dewatering cyclone overflow, and the combined stream is pumped to a deslime cyclone cluster. The deslime cyclone underflow is transferred to the secondary mill feed and the overflow bypasses the secondary mill and combines with mill discharge in the mill discharge sump.
Objectives
The investigation of the Kroondal (KP1) milling circuit was aimed at understanding how the circuit was performing and determining how the processing and efficiency could be improved.
In order to achieve the objectives, the scope of the study was devised to include:
> Analysis of the current situation
> Determining the optimum lifter profile that would provide the required mode of breakage
> Determining the optimum top ball size required to break the top feed size and the energy required to achieve the target grind for the current F80.
Analysis
The lifter geometry, operating conditions, and milling circuit performance were analysed to determine where design or operational changes were needed to realize the required improvements.
Mill lifter profiles
Current lifter profile
Figure 3 shows the current lifters installed in the primary and secondary mill. The lifters are 210 mm wide, with heights of 160 mm and 170 mm for the primary and secondary mills respectively. The primary mill lifter height-to-angle (H2A, defined as the height from the base of the lifter to a front face angle) is 80 mm, while that for secondary mill is 89 mm.
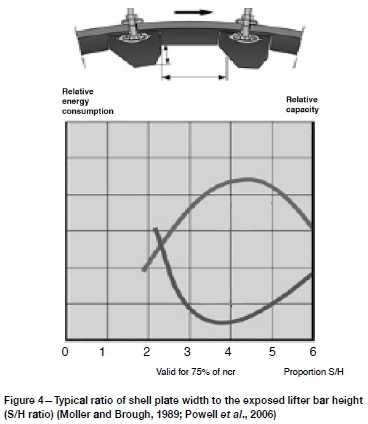
Simulations were conducted to establish the load behaviour and trajectory of balls/charge inside the mill. The simulations were conducted using LSD's MillTraj and PFC-3D DEM software. MillTraj software uses trajectory models to track the outermost ball trajectory of selected ball sizes which sit against the lifter and plate (Royston, 2001). The MillTraj software also predicts the likely position of the toe of the charge and is able to estimate the ratio of shell plate width to the exposed lifter height, indicated as the S/H ratio. The S/H ratio ranges and their effects on throughput and specific energy as reported by Moller and Brough (1989) are shown in Figure 4. From Figure 4, the ideal strategy would be to design around a S/H ratio of 2.5 and change-out the lifters at a ratio of around 5.5 in order to obtain optimum mill performance and liner life. PFC-3D DEM simulation traces the trajectories of individual charge balls. Mill ball trajectory analysis was conducted to establish the influence, and provide insight into the effect, of mill speed and lifter geometry on the ball layer trajectories.
As indicated in the introduction, the gearbox was changed twice, first to increase the primary ball mill speed from 68% to 78%, then to revert back to 68% of critical speed, hence the analysis of current lifters looked at the two speeds.
From Figure 4, it can be observed that the S/H ratio of the liners, at 1.99, was much lower than the recommened design ratio of about 2.5, which is the minimum in order to balance the mill performance and liner life. This necessitated a redesign of the liners to minimize the impact on grinding perfomance.
The simulations showed (Figure 5 and Figure 6) that increasing the mill speed from 68% to 78% of critical resulted in the outermost balls shifting outward to the toe position of the charge. Mill speed increase (Royston, 2007) can increase both impacts of balls at the toe and charge turnover, improving mill performance through increased 'ball-charge participation' although as mill speeds increase above 78-80% of critical, lifter efficiency may fall and affect overall mill performance. Ball impact in the toe region of the charge is necessary for good size reduction, but balls falling on the shell above the toe position may damage both the shell liner and the balls and cause excessive metal wear. Under normal circumstances, increasing the mill speed would be expected to increase the impact breakage of material in the size range closer to the -30 mm feed top size. The increase in energy resulting from increased speed would also be expected to knock down and eliminate the scats. However, the opposite was observed and more scats were generated instead.
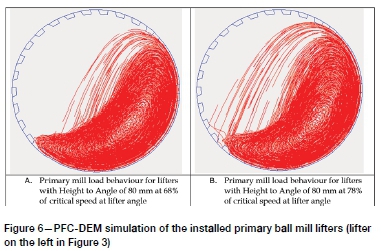
Although no reasons could be established for the increased scats generation, it seems that the increase in mill speed might have resulted in an expanded charge, reducing ball-rock collisions. The expanded charge might also have resulted in less selective classification; thus reducing the residence time of coarser particles.
An analysis of the outermost trajectory of balls in the secondary ball mill was conducted at 74% of critical speed (the speed at which the mill runs). The lifters in the secondary ball mill seemed to be overly aggressive and appeared not to provide the abrasion and attrition modes of breakage needed for the finer feed of F80150 μm. The same approach used in analysing the movement of the charge in the primary mill was used for secondary mill. In order to avoid duplication, only figures showing the primary mill are indicated.
Lifter profile optimization
The optimizing of the lifter profiles took into consideration the following:
> UG2 ore is characterized by weak large fragments and stronger small fragments
> UG2 ore does not require very high-energy impacts to break the larger fragments
> The increased scats generation was assumed to be the result of charge expansion (more cataracting), hence increased/easier flow of scats through the charge and a shorter time in the mill
> The possibility of increasing cascading while at the same time retaining some charge cataracting
> Achieving the study objectives without adversely affecting lifter life.
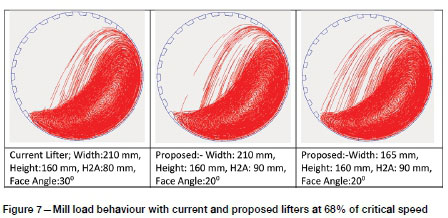
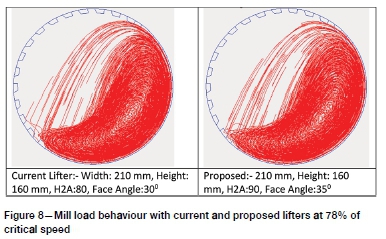
Furthermore, MillTraj simulations were conducted at different lifter specifications in terms of height, height-to-angle (H/A), effective lifter height, and face angle (angle of attack) in order to determine the lifter profile that would result in the outermost ball layer impacting at the toe position of the charge for both the primary and the secondary mills. For the primary mills, lifter profiles for the two mill speeds were determined. This could allow manufacturing of the optimum lifter profile given the speed at which the mill would operate. Three options for lifter profiles were presented to the client. Two options with different lifter widths were for a mill operating at 68% of critical speed, while the third option was in case the mill was to run at 78% of critical speed. The three options with the current lifter profile for primary mill are shown in Table II. Figure 7 and Figure 8 show the PFC DEM simulations of the selected options of lifter profiles presented to KP1 plant for the primary mills together with that of the current lifters at the two mill speeds.
Determination of optimum top ball size and energy requirement
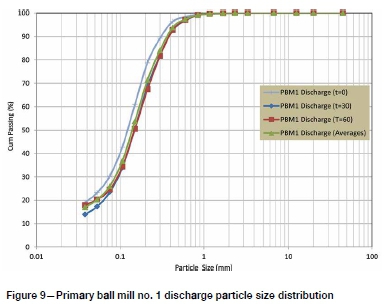
Characterization of ore hardness as well as plant stream flow rates and particle size distribution (PSD) was conducted in order to estimate the theoretical make-up ball size and energy required to achieve the target grind. Bond Ball Work Index (BBWI) tests on DMS feed sample and primary ball mill conveyor belt cuts were used to characterize ore hardness. The BBWIs for the DMS feed and primary ball mill conveyor belt cut samples were found to be 18.14 kwh/t and 14.4 kwh/t respectively. Data from the sampling campaign and historical data from the plant were used to determine the streams flow rates and PSDs. Samples were taken from points indicated in Figure 1 and Figure 2.
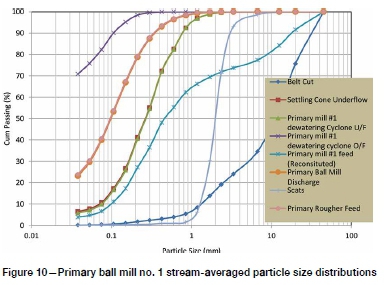
Figure 9 shows the variation in PSD for the three sets of samples collected from the primary ball mill no. 1 discharge. A simple average of the sample cuts collected at t = 0, t = 30 minutes, and t = 60 minutes was used to represent a stream PSD. Stream PSDs for the primary ball mill no. 1 are shown in Figure 10. From the stream PSDs; F80 and P80 were obtained and used in expressing the mill feed and product PSD.
Make-up ball sizes were estimated using the ball size equation proposed by Bond (1957) (Equation [1]) and the results are shown in Table III. The ball sizes used were found to meet or exceed requirements and could not have been the cause of the scats generation.
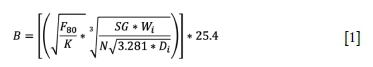
where B is the optimum top-up ball size (mm), F80is the new feed 80% passing size (μιη), SG is specific gravity of the ore being milled, N is the percentage of critical speed, W is work index of the feed material, D{is mill diameter inside liners (m), and K is a constant with a value of 350.
Energy determination was aimed at ascertaining the energy requirement for the current ball mill feed and product size, and this was related to the mill power available. To establish the energy required, the population balance model (PBM) using the sampling campaign PSD as well as BBWI test results were used. The specific selection function (Herbst and Fuerstaneu, 1973) that incorporate the specific energy (P/mp) was used, i.e.:
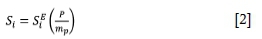
where SEis the specific selection function, independent of mill operating parameters, P is the industrial mill power drawn, and mpis the industrial mill hold-up. S is the proportionality constant known as the specific rate of breakage per unit time.
The PBM breakage and selection functions parameters were established and used to determine the energy required to achieve the target grind. Table IV indicates the current power consumption and that required to achieve target grinds.
The simulations indicated that more power than is available would be required for the primary ball mills at the current F80and throughput in order to meet the 40% -75 mm target. In the case of secondary ball mill, it appears that power was being lost without achieving a grind of 70%-75 μm.
Conclusion and recommendation
The study of the current situation and optimization allowed the lifter profile to be determined that would result in the required load behaviour for optimal grinds. Changes to lifter profiles, including increasing effective lifter height-to-angle (H2A) and front face angle and reducing the lifter width for the primary ball mills were proposed. The decrease of lifter width was aimed at increasing the mill volume available in order to increase the throughput, while the changes to lifter effective H2A and the front face angle were aimed at attaining the required balance between abrasion, attrition, and impact breakage. For the secondary ball mill, lifter height and effective lifter height were decreased. This was aimed at increasing the abrasion and attrition modes of breakage.
The analysis of historical data and sampling campaign data, together with the simulation, indicated that at the current F80, there was not much room for improving primary mill grinding. Grind improvement would require reducing the F80. This would have an impact on the performance of the DMS plant. However, there is the possibility of increasing the mill charge to between 35 and 37%, bearing in mind that a properly designed retaining ring would be required to prevent balls escaping from the mill.
For the secondary mill, there is scope for improving power utilization and milling performance. It was observed that power consumption could be reduced from about 4410 kW to about 3630 kW while at the same time achieving the target grind of 70% -75 um. Other options suggested in order to improve the grind were to look at testing the impact of percentage solids and mill filling. Further laboratory tests coupled with simulations are suggested in order to verify the findings before implementation.
Acknowledgements
The authors would like to express their appreciation and heartfelt thanks to Minopex-Kroondal 1 for engaging Multotec for the work and permission to publish this paper, as well as for the support received from plant operational staff at Kroondal 1 who assisted in the sampling campaign and sample analysis. The authors also would like to acknowledge and express apreciation to Dr Mulenga Bwalya from School of Chemical and Metallurgical Engineering at the University of the Witwatersrand, who assited with DEM simulations.
References
Austin, L.G., Klimfel, R.R., and Luckie, P.T. 1984. Process Engineering of Size Reduction: Ball Milling. AIME-SME, New York. [ Links ]
Bond, F.C. 1957. Grinding ball size selection. Proceedings of the Annual Meeting, Society of Mining Engineers of AIME, Tampa, FL. [ Links ]
Herbst, I.A. and Fuerstenau, D.W. 1973. Mathematical simulation of dry ball milling using specific power information. Transactions of AME, vol. 254. pp. 343-348. [ Links ]
Moller, T.K. and Brough, R. 1989. Optimising the performance of a rubber-lined mill. Mining Engineering, August. pp. 849-853. [ Links ]
Powell, M.S., Smit, I., Radziszewski, P., Cleary, P., Rattray, B., Eriksson, K., and Schaeffer, L. 2006. The selection and design of mill liners. Advances in Comminution. [ Links ]
Kawatra, S.K. (ed.). Society for Mining, Metallurgy & Exploration, Littleton, CO. pp. 331-376. [ Links ]
Royston, D. 2001. Interpretation of charge throw and impact using multiple trajectory models. Proceedings of the International Conference on Autogenous and Semi-autogenous Grinding Technology (SAG2001), Vancouver, BC, 30 September - 3 October. Department of Mining Engineering, University of British Columbia, Vancouver, BC. Vol. 4. pp. 115-123. [ Links ]
Royston, D. 2007. Semi-autogenous grinding (SAG) mill liner design and development. Minerals & Metallurgical Processing, vol. 24, no. 3. pp.121-123. [ Links ]
 Correspondence:
N.S. Lameck
Email: NiyoshakaL@multotec.com
Received: 12 Feb. 2018
Revised: 23 Sep. 2019
Accepted: 10 Oct. 2019
Published: November 2019

