


Services on Demand
Article
 English (pdf)
 Article in xml format
 Article references
Indicators

Related links
-
 Cited by Google
 -
 Similars in Google
Share

 Permalink
Journal of the Southern African Institute of Mining and Metallurgy
On-line version ISSN 2411-9717
Print version ISSN 2225-6253
J. S. Afr. Inst. Min. Metall. vol.119 n.10 Johannesburg Oct. 2019
http://dx.doi.org/10.17159/2411-9717/68/2019
GENERAL PAPERS
Evaluation of shaft locations in underground mines: Fuzzy multi-objective optimization by ratio analysis with fuzzy cognitive map weights
E. BakhtavarI; S. YousefiII; A. JafarpourIII
IDepartment of Mining and Materials Engineering, Urmia University of Technology, Urmia, Iran
IIDepartment of Industrial Engineering, Urmia University of Technology, Urmia, Iran
IIIDepartment of Mining and Metallurgical Engineering, Yazd University, Yazd, Iran
SYNOPSIS
The determination of the location of production and ventilation shafts is one of the most important issues in underground mines from both a technical and an economic viewpoint. This study introduces an integrated approach using fuzzy cognitive map (FCM) and fuzzy multi-objective optimization by ratio analysis (FMOORA) to evaluate several candidate shaft locations and consequently increase ore production from underground mines. The FCM based on a hybrid learning algorithm was applied to analyse interactions and internal relationships between criteria and to find complex causal relationships between different factors. After importing the weights resulting from the FCM into the FMOORA, shaft alternatives were evaluated and prioritized. An iron ore case example was evaluated by the integrated approach. Results of the integrated approach were validated by the results obtained from fuzzy-TOPSIS and on-site evaluations by mining experts.
Keywords: production shaft, fuzzy cognitive map, fuzzy multi-objective optimization by ratio analysis, underground mining.
Introduction
Underground mine openings are excavated from the surface to access an underground ore deposit and to transport and hoist extracted ore to the surface. The number and type of openings (developments) depend on the mining method and production capacity. Decisions on developments should be carefully made to address the complexity and high costs of underground mining. These decisions influence production operation in the next stages (Hartman and Mutmansky, 2002). The vertical shaft is among the most common openings used to access ore deposits located at deep levels. The vertical shaft is employed for ore transportation and service objectives. It is also suitable for relatively large, deep, and flat-lying ore deposits when a high production rate is desired.
There have been limited studies of vertical shaft issues in underground mining. Unrug (1984) examined important aspects such as shaft location selection, the design of shaft lining and collar, and sump design. The author emphasized that a shaft could be located on the footwall side of an ore deposit with a major axis in the strike direction. Locating the shaft in the central part of the mining area has major benefits because of the considerable decrease in transportation costs. However, in this case, mineable ore can be sterilized in the shaft pillars. Therefore, locating a shaft in the central part is appropriate only in the case of tabular deposits where mining at moderate depths is considered. Elevli, Demirci, and Dayi (2002) compared the vertical shaft and ramp systems to identify a suitable method for ore transportation in underground mines. They compared these two systems in terms of net present value of the whole project for various depths, total investment costs, and transportation unit cost. They concluded that the NPV and total investment cost of the ramp system make it suitable for depths less than 700 m. However, the shaft system has a lower transportation unit cost than the ramp system. Notably, the shaft system is preferable at depths greater than 700 m. Bruneau et al. (2003) investigated geological and geotechnical problems of underground copper mine shafts on site. They also carried out numerical modelling of the effects of the mining sequence and faults on the stability of the main shaft. Their study indicated that geological and geotechnical structures have a major effect on the stability of a shaft. Therefore, a production shaft should be located away from faults and other problematic structures in terms of geology and geotechnics.
Among the shaft-related studies, the investigations by Gligoric, Beljic, and Simeunovic (2010) and Hudeja et al. (2013) focused on determining a suitable location for a shaft. Gligoric. Beljic, and Simeunovic (2010) used fuzzy TOPSIS to find the order of preference by similarity to ideal solution and network optimization to determine the appropriate location of a shaft in a deep underground mine. Transportation costs, total operational and development costs of the shaft, and availability of the transportation system were considered as the main criteria. Hudeja et al. (2013) prioritized shaft locations for a coal mine by integrating the results of four techniques - preference ranking organization method for enrichment of evaluations (PROMETHEE), ELimination and Choice Expressing Reality (ELECTRE), analytical hierarchy process (AHP), and VIseKriterijumska Optimizacija I Kompromisno Resenje (VIKOR). They addressed the main criteria in terms of geotechnical conditions and gasometry, hydrogeological conditions, mine infrastructure arrangement, siting and construction investment, concentration and advance of mining operations, and interlinking with a thermal power plant.
The decision on the location of a production shaft is a critical component in the strategic planning of an underground mine (Gligoric, Beljic, and Simeunovic 2010). This decision affects the economics of an underground mining project. Therefore, the purpose of this research is to provide an approach to determine the most appropriate location of the production shaft in an underground mine. This decision is a multi-criteria task (Hudeja et al. 2013). The main part of this type of decision-making process is to determine the weights of criteria and attributes. The majority of the weighting techniques cannot consider the causality relationships between the criteria and the system objective. Fuzzy cognitive map (FCM) is the best-known technique that has been applied in different cases to consider the causality relationships between the criteria and objective. Despite weighing the criteria, the remaining process of decision-making can be completed by a multi-criteria decision-making (MCDM) technique, such as AHP, TOPSIS, ELECTRE, PROMETHEE, VIKOR, multi-objective optimization by ratio analysis (MOORA), etc.
Among the MCDM techniques, MOORA, which was introduced by Brauers and Zavadskas (2006), has been effectively applied in various decision-making problems due to its simplicity, stability and robustness, comprehensiveness, and minimal mathematical calculations and computational time required (Brauers et al., 2008; Chakraborty, 2010; Kracka, Brauers, and Zavadskas, 2010; Brauers and Zavadskas, 2012). Other advantages of MOORA are the ability to simultaneously optimize several contradictory attributes subject to certain constraints and finally select the best (satisfactory) alternative. As a result, MOORA is an appropriate tool for selecting and prioritizing alternatives from a set of feasible options based on multiple conflicting attributes.
Locating a shaft for an underground mine is, like many other decision-making problems, an imprecise exercise. In this case, the fuzzy set theory presents a mathematical context to precisely address vague conceptual phenomena (Zadeh, 1965). The fuzzy theory is a beneficial tool to measure the ambiguity of concepts, including linguistic variables, satisfaction, and degrees of importance that are often vague during the decision-making process (Bakhtavar and Lotfian, 2017).
Therefore, in this study, an FCM was integrated with fuzzy multi-objective optimization by ratio analysis (FMOORA) to take full advantages of their ability to deal with uncertainty when prioritizing shaft locations with imprecise and vague data. In the FCM part of the integrated approach, the weights of the most effective criteria were determined. Then, other steps of the decision-making process were performed using the FMOORA part of the approach.
The FCM method has been applied individually and together with decision-making techniques in different fields. Limited research has been reported on the applications of FCM in mining and rock engineering problems. Bakhtavar and Yousefi (2018) integrated FCM based on a multi-goal concept and a sensitivity analysis in the TOPSIS process to prioritize workplace accident risks in underground coal mines. Bakhtava, Shahmoradi, and Rahmati (2018) used an FCM to evaluate the effective factors that give rise to occupational risks in underground coal mines in Iran by analysing the cause and effect interactions among the identified factors. Bakhtavar and Shirvand (2019) designed an FCM to prioritize the problematic drilling and blasting factors that result in technical difficulties in tunnelling projects in Iran by extracting the weights of the problematic factors.
Background
'Cognitive map' and 'multi-objective optimization by ratio analysis' methods were integrated under a fuzzy environment to establish a hybrid approach that is applicable in all situations where a decision is made. The hybrid approach was developed to evaluate and prioritize a number of shaft location alternatives in the case of underground mining. The fuzzy system based on triangular numbers was studied along with FCM and FMOORA as the main methods and materials of the research, as outlined in the following sub-sections.
There are some uncertain factors in the form of linguistic variables and ambiguity in concepts while evaluating and prioritizing shaft location alternatives. To solve this problem in the decision-making process, fuzzy set theory provides a mathematical context in which vague concepts can be exactly considered (Zadeh, 1965).
General concept of fuzzy sets theory
The literature indicates that fuzzy set theory was introduced by Zadeh (1965). This theory was developed and exemplified in many fields to improve the decision-making process under uncertainty and to simply solve complex real-world problems. In decision-making processes, expert opinions are usually based on linguistic and descriptive evaluations, which impose uncertainty. The linguistic variables were quantified to make a decision easily. Therefore, MCDM techniques were developed by using fuzzy numbers instead of crisp numbers. The fuzzy numbers were ordinarily specified by triangular and trapezoidal types. Triangular fuzzy numbers (TFNs) have been commonly used together with MCDM techniques.
A crisp set can be converted to a fuzzy set if the range {0,1} is converted to the interval [0,1]. The fuzzy set A in the universal set U can be defined as in Equation [1]. Fuzzy set A can be represented through Equation [2]. The membership degree sets were replaced with crisp sets based on the fuzzy theory concept (Bellman and Zadeh, 1970).
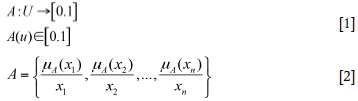
where μA(X1) is the membership degree of xxin set A, which varies in the interval [0,1].
FCM
In the real world, many factors have complex relationships with other factors under a cause-and-effect situation. The cognitive map method has been extensively used in many applications of engineering sciences because it is capable of analysing and finding the complex cause-and-effect relationships between various factors (criteria). A cognitive map is designed to consist of nodes, arcs between nodes, and signs on the arcs. In a specific map, nodes represent special concepts that describe a system, and arcs denote cause-and-effect relationships between the concepts. The type of causality between concepts is signified by the arc signs (Papageorgiou, Stylios, and Groumpos. 2006).
The FCM is an effective tool used to model complex systems for which there is limited data due to data inaccessibility or the high cost of data collection. It is based on a cognitive map that uses the relationship between components of a 'mental perspective' to compute the 'power of influence' of causal relationships by fuzzy numbers in the interval [0,1] or [-1,1]. In the FCM, time series data as input along with expert opinions are essential to draw and design a map (Rezaee, Yousefi, and Hayati, 2016; Rezaee, Yousefi, and Babaei, 2017). The FCM employs the neural network logic to estimate factor weights and relationships between variables. Figure 1 illustrates a sample cognitive map.
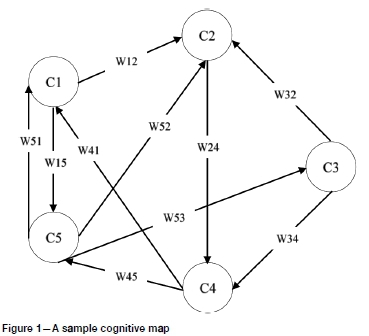
As shown in Figure 1, Ç represents nodes or concepts that are associated with weighted arcs. WIjdenotes relationships between concepts Ciand Cjin the form of type and causality degree of the relationship between the concepts. Wij>0, Wij=0, and Wij<0 represent a positive causal relationship, no relationship, and a negative causal relationship between the two concepts, respectively (Bakhtavar et al., 2019).
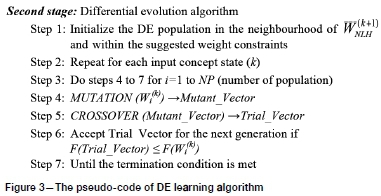
Learning algorithms have been developed to increase map convergence and the accuracy of weights and to reduce the dependency on expert opinions based on the cognitive map concept. The Hebbian algorithm, population-based learning algorithms, and hybrid algorithms are known as learning algorithms (Papageorgiou and Kannappan, 2012). The best alternative is a hybrid learning algorithm using Hebbian and metaheuristic algorithms based on the data of the current study deduced from expert opinions. This kind of hybrid algorithm is appropriate for adjusting map weights consisting of time series data and expert opinions. In this study, a hybrid nonlinear Hebbian and differential evolution (NLH-DE) algorithm was used. The NLH-DE algorithm can update non-dimensional weights in different repetitions and sustain the relationships between the concepts in the original map. Figure 2 explains the first stage of the NLH-DE algorithm in the form of pseudo-code of the NLH algorithm. The pseudo-code of the DE algorithm as the second stage of the NLH-DE is given in Figure 3.
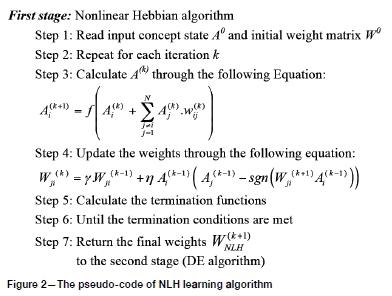
In Figure 2, A0is the initial state matrix of the system, W0 is the initial weight matrix between variables, A(k) and A(k+1) are the new values of variables in repetitions k and k+1, η and γ are positive and very small numbers as learning rate, and WJl(k+1) are the updated values of weights between variables i and j in repetitions k and k+1, W(k+1)NLH is the final weight matrix between variables in the first stage, and sgn represents a sign function.
FMOORA
Multi-objective optimization by ratio analysis (MOORA) was introduced by Brauers and Zavadskas (2006) as an MCDM technique capable of a high level of comprehensive evaluation of projects facing a wide variety of factors. The MOORA method has many applications to the solving of various engineering problems in complex decision-making processes. FMOORA has been widely applied due to its reliability in uncertain conditions. The steps of FMOORA are explained below.
> Step 1: Identify alternatives and criteria and construct a fuzzy decision matrix
Equation [3] represents a decision matrix using TFN that indicate scores of each alternative based on each criterion.
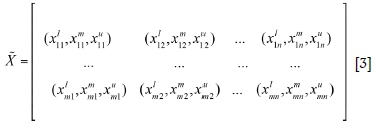
where, X is a fuzzy decision matrix; (xjxjm,xu) denotes a triangular fuzzy number, in which, xij, xij, and xijrespectively indicate the lower, middle, and upper values of the fuzzy number for th alternative with respect to jth criterion; m and n are the number of alternatives and number of criteria, respectively. > Step 2: Normalize thejuzzy decision matrix
The fuzzy decision matrix of the first step is normalized by using Equations [4] to [7]. The normalization process provides a matrix with comparable elements (Balezentis, Balezentis, and Brauers, 2012).
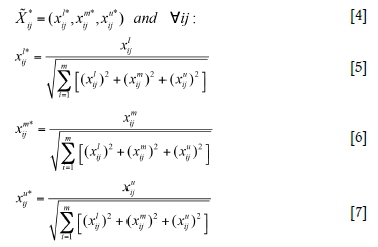
where XYis a normalized fuzzy decision matrix, and xij*, xij, and xijrespectively denote the lower, middle, and upper normalized values of the fuzzy number for ith alternative with respect to jth criterion
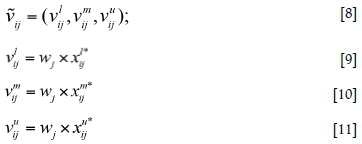
> Step 3: Create a weighted normalized matrix
In this step, the fuzzy weighted normalized matrix is created through Equations [8] to [11] by multiplying fuzzy weights of each criterion (wj), deriving from the weight calculation methods, such as AHP, and the normalized matrix of the second step.
> Step 4: Calculate normalized performance values
The normalized performance values are calculated through Equation [12] by subtracting the undesirable criteria and the total desirable criteria [18].
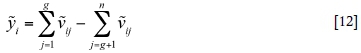
where, y is the overall normalized performance index for each alternative;  is desired (beneficial) criteria for 1,...,
  is undesirable (non-beneficial or cost) criteria for g+1,...,n.
> Step 5: Dejuzzjy the values ojthejunctions
In this step, the normalized performance values, which are TFN, are converted to crisp values by using the centroid of gravity denazification method (Equation [13]).
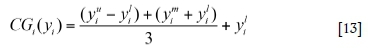
where, yi is an overall performance crisp value for each alternative.
> Step 6: Evaluate and rank alternatives
Calculated yicrisp values are ranked in descending order to evaluate and prioritize alternatives. The best alternative has the maximum yi, whereas the worst has the minimum yi. Notably, yimay be positive or negative depending on the total maximum values (desirable criteria) and the total minimum values (undesirable criteria) in the decision matrix.
Methods and materials
Integrated approach of FCM and FMOORA
An approach was developed by integrating the cognitive map and MOORA methods under a fuzzy environment to be applicable in all cases of decision-making processes, especially for application to mining problem. TFNs were used in both parts of the integrated approach.
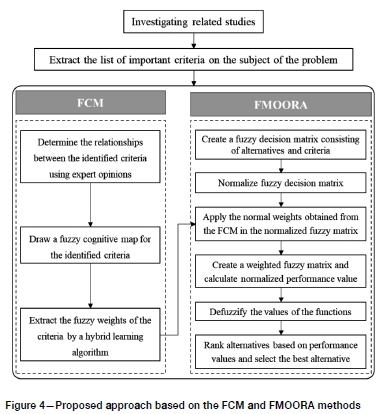
Figure 4 illustrates the general view of the integrated approach steps using FCM and FMOORA. First, the most important criteria based on a decision-making problem were identified. Then, the criteria were weighed using the FCM based on the hybrid learning algorithm and expert opinions. Expert opinions were used on the basis of a fuzzy ranking method. Next, a fuzzy decision matrix was formed and then normalized based on the FMOORA steps. After that, a fuzzy weighed normalized matrix was formed by multiplying the fuzzy weights of criteria resulting from the FCM and the normalized decision matrix of the FMOORA. Finally, normalized performance values (y) were calculated and defuzzified to evaluate and prioritize alternatives.
Iron ore deposit data
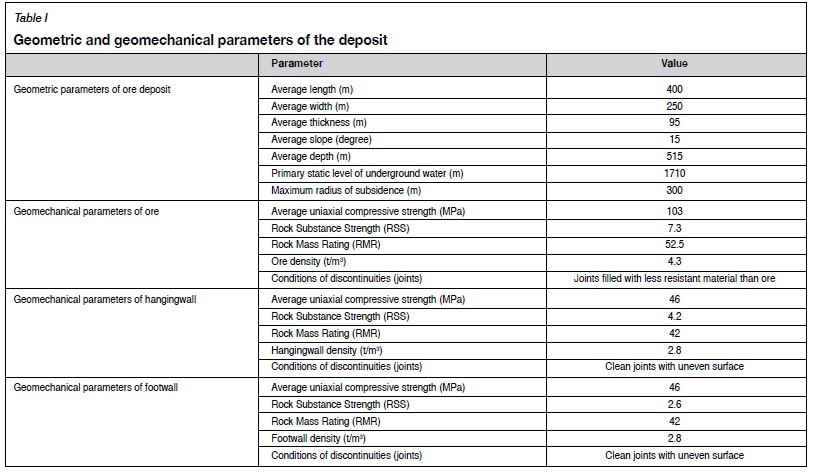
The data for an iron ore deposit in central Iran was applied to evaluate the location alternatives of production shaft. Accordingly, the most appropriate location of the shaft was determined. Table I lists sthe geometric and geomechanical characteristics of the iron ore deposit.
Investigations
Before any investigations on site and using maps, several parameters related to finding an optimal location of the shaft were listed on the basis of expert opinions obtained through questionnaires. Moreover, the important criteria and their interaction were highlighted by applying weights based on expert opinions. The following important criteria were determined based on the completed questionnaires:
> Possibility to protect shaft safety pillar (C1)
> Proximity to the centre of loading points (C2)
> Proximity to the ore stockpile (C3)
> Suitability of bedrock RMR (C4)
> Suitability of topography (C5)
> Distance from subsidence zone (C6).
The area of the iron ore deposit was investigated on site and by using maps to collect the required data for the area based on the criteria. To this end, topographical and geological maps, along with the technical reports of the mine, were initially studied. The locations of other iron ore deposits around the investigated deposit, the situations of the access roads, and the location of the ore stockpile were studied on the area maps. The geomechanical characteristics of the bedrock such as rock mass rating (RMR) and probable extent of the subsidence zone were extracted from the technical reports on the area under consideration.
After the preliminary investigation on the map of the iron ore deposit area, 14 shaft locations were considered as alternatives. The locations were checked and adjusted through on-site investigations. Topographical conditions were more focused during the on-site investigations. Notably, some of the alternatives were located inside the subsidence zone or in an unsuitable topography.
Results and Discussion
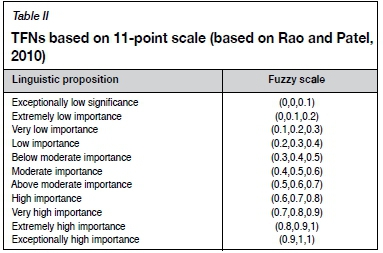
In this study, expert opinions were considered using TFNs based on an 11-point scale as given in Table II (Rao and Patel, 2010).
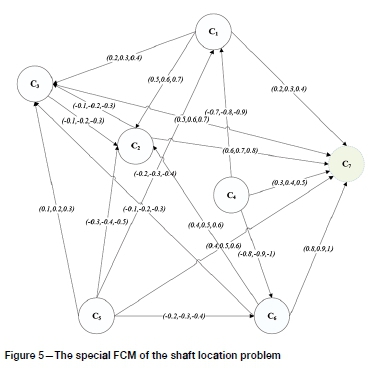
The relationships between the criteria were obtained using the FCM by considering the questionnaires completed by experts. Accordingly, the cognitive map of the shaft location problem was drawn by the use of criteria nodes, fuzzy weights, and arrows that indicate interrelations between the criteria (Figure 5). In addition to the six criteria (C1-C6), C7 plays a major role as the main goal of the shaft locating problem is to determine causal relationships between the six criteria and their weights. Therefore, C7 as the goal concept of the FCM system is affected by the six criteria.
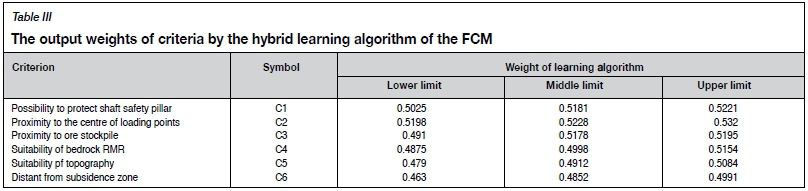
Then, as summarized in Table III, the final weights of the criteria were determined using the hybrid learning algorithm (NLH-DE) of the FCM based on the causal relationships between the criteria and the weight of each criterion.
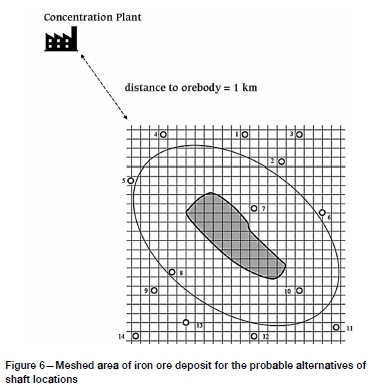
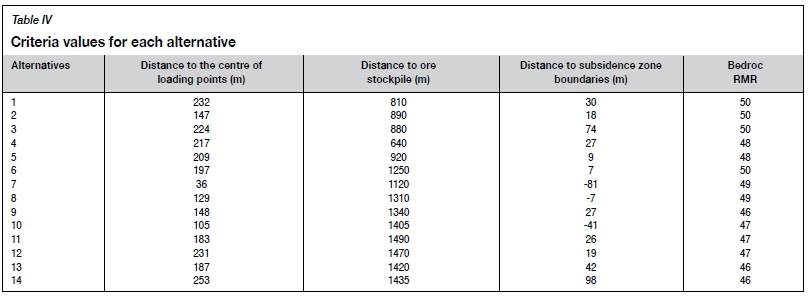
After that, the quantitative and qualitative values of the criteria were extracted based on the geometric and geomechanical data for the iron ore deposit (Table I). Table IV summarizes the values determined for the distance of each shaft location alternative to the centre of loading points, ore stockpile, and subsidence zone boundaries based on Figure 6, which shows a plan view of the meshed map of the area.
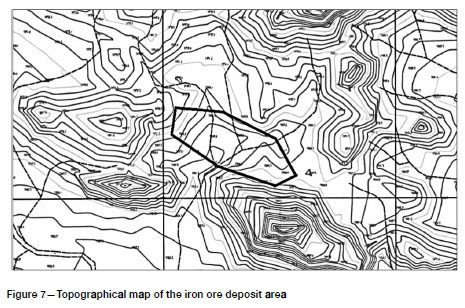
Experts decided on the alternative with respect to some of the qualitative criteria, such as suitable topography, by the use of the topographical map of the area (Figures 7 and 8). The alternatives within the syncline structures showed the lowest score, whereas the alternatives located in an almost uniform topography obtained the highest scores considering the position of the ore deposit on the topographic map in Figure 8.

To implement the FMOORA method based on the extracted data, the following steps were executed to evaluate and prioritize the alternatives.
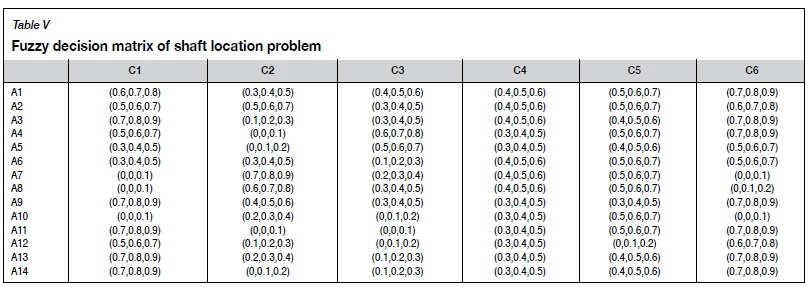
> Step 1: According to expert opinions, the fuzzy decision matrix was created for the shaft location problem based on six criteria and 14 alternatives (Table V). Notably, in this step, six experts discussed their opinions on the alternatives with respect to the criteria during a meeting and provided a common opinion as given in Table V, based on the fuzzy scale in Table II.
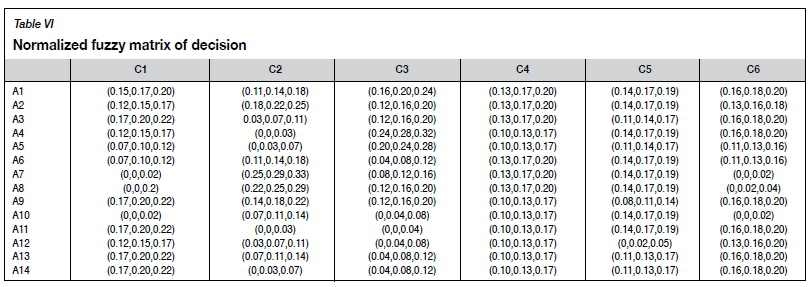
> Step 2: As given in Table VI, the fuzzy decision matrix in Table VI was normalized through Equations [4] to [7].
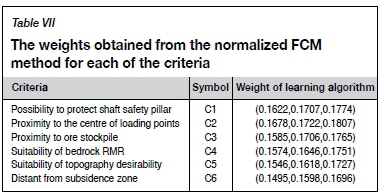
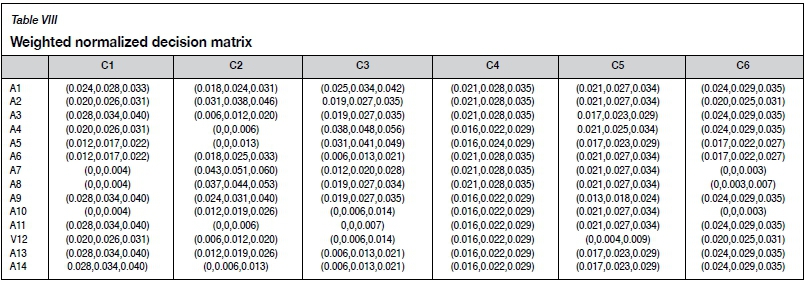
> Step 3: To determine the weighted normalized decision matrix through Equations [8] to [11], the normalized fuzzy matrix must be multiplied to the normalized weights of the criteria. For this purpose, the criteria weights obtained from the FCM method (Table III) were normalized as given in Table VII. The weighted normalized decision matrix is represented in Table VIII. The results obtained from the FCM method (Tables III and VII) indicate that the criterion of 'proximity to the centre of loading points' by a normalized fuzzy weight of (0.1678, 0.1722, 0.1807) has the highest importance among the other criteria. Among them, the criteria of 'possibility to protect shaft safety pillar' and 'proximity to ore stockpile' indicate second and third importance, respectively. The criterion of 'distant from subsidence zone' has the lowest importance of all the criteria.
> Step 4: Normalized performance values were calculated
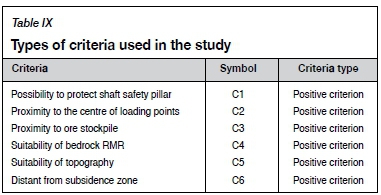
by subtracting the total undesirable criteria from the total desirable criteria through Equation [12]. Table IX reveals that all criteria used in this study have positive concepts. Therefore, the value of the function was equal to the sum of the fuzzy values of the criteria.
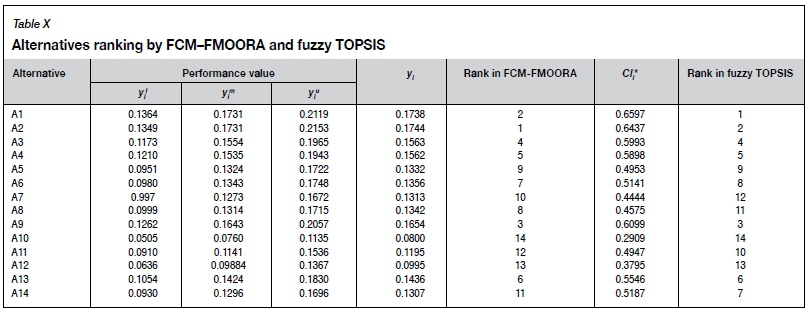
Now, by defuzzifying fuzzy performance values through Equation [13], the crisp values (y) were obtained for evaluating and ranking all 14 alternatives, as represented in Table X. The maximum and minimum crisp performance values (y) represented the first and last ranks of the shaft location alternatives, respectively. Consequently, as given in Table X, the five highest ranked of the shaft alternatives are A2, A1, A9, A3, and A4 with performance values of 0.1744, 0.1738, 0.1654, 0.1563, and 0.1562, respectively. Notably, by subtracting the performance values of the two highest ranked alternatives, alternatives A2 and A1 had a very negligible difference of 0.0006.
As shown in Figure 6 and Table IV, A2 (147 m) is closer to the centre of the ore deposit and loading points than A1 (232 m). However, A1 (810 m) is closer to the ore stockpile than A2 (890 m). Based on the other criteriam A1 and A2 are very similarly ranked. As discussed before, the criterion of an proximity to the centre of loading points' has the highest weight among the other criteria and 'proximity to ore stockpile' has the third highest weight. These explanations can justify location A2 as the best alternative.
The results of the integrated FCM and FMOORA were compared with the results obtained from fuzzy TOPSIS as the most conventional MCDM method (Table X). In this version of the fuzzy TOPSIS method, the criteria weights obtained from the FCM version of this study (Table III) were used. Therefore, a fuzzy TOPSIS with criteria weights based on the FCM was developed to compare the results. For the simple comparison of results given in Table X, the performance values (y) in FCM-FMOORA and the relative closeness values to ideal solution (Cl*) in fuzzy TOPSIS were normalized as shown in Figure 9. According to Figure 9, the normalized ranking value curves are approximately in agreement.
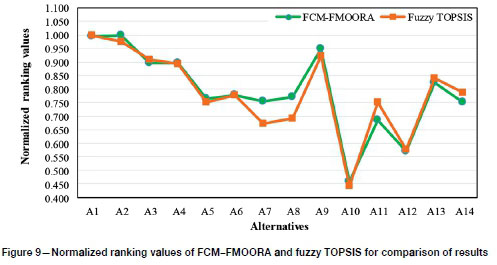
As shown in the FCM-FMOORA curve in Figure 9, alternatives A1 and A2 are close and can be considered the first priority.
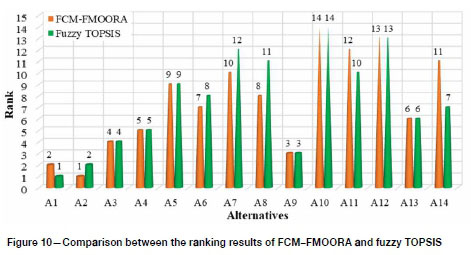
Figure 10 represents the ranking results by FCM-FMOORA and fuzzy TOPSIS for simple evaluation of the considered alternatives. Thus, alternatives A1, A2, A3, A4, and A9 were considered the five highest ranked based on both methods. As shown in Table X and Figure 9, alternatives A1 and A2 are assigned joint first priority because of a very small difference between their values and the ideal solution (Cl;*). Alternatives A2, A1, and A9 were the most appropriate shaft site alternatives, which are closely in agreement to the ranking results of the FCM-FMOORA method presented in this study, based on the on-site investigations and the prefeasibility study of the iron ore area. Alternatives A7, A8, and A10 could not satisfy the sixth criterion (distant from subsidence zone), because they are located within the subsidence zone (Figure 6). Alternatives A7, A8, and A10, ranked as 10, 8, and 14, respectively, were validated by the FCM-MOORA. A8 ranked eighth because this shaft site is located within the subsidence zone, although close to the subsidence zone boundaries. Moreover, this alternative satisfies some other important criteria from C2, C3, C4, and C5.
Conclusion
The FCM and FMOORA were integrated to solve decision-making problems, in particular to evaluate and prioritize shaft location alternatives in the case of underground mines. The integrated approach was exemplified using the data for an underground iron ore mine, consisting of six criteria and fourteen shaft location alternatives. The FCM part of the integrated approach determined the weights of the criteria by using an NLH-DE learning algorithm and expert opinions. As a result, higher weights were assigned to the criteria of proximity to the centre of loading points, possibility to protect the shaft safety pillar, and proximity to the ore stockpile with fuzzy weights (0.5198, 0.5228, 0.532), (0.5025, 0.5181, 0.5221), and (0.491, 0.5178, 0.5195), respectively. The criterion of distance from the subsidence zone attained the minimum weight (0.463, 0.4852, 0.4991). By applying the fuzzy weights of the criteria in the FMOORA steps, alternatives A2, A1, A9, A3, and A4, with performance values of 0.1744, 0.1738, 0.1654, 0.1563, and 0.1562, respectively, were identified as the five first choices for shaft sites. Alternatives A2 and A1 had a very negligible difference in their performance values. The evaluation and ranking results of the integrated FCM-FMOORA were validated by the fuzzy TOPSIS method. Moreover, investigations on the map and on-site confirmed that the resulting alternatives are in better locations and satisfy technical limitations better than the other alternatives.
References
Bakhtavar, E. and Lotfian, R. 2017. Applying an integrated fuzzy grey MCDM approach: A case study on mineral processing plant site selection. International Journal of Mining and Geo-Engineering, vol. 51. pp. 177-183. [ Links ]
Bakhtavar, E. and Yousefi, S. 2018. Assessment of workplace accident risks in underground collieries by integrating a multi-goal cause-and-effect analysis method with MCDM sensitivity analysis. Stochastic Environmental Research and Risk Assessment, vol. 32. pp. 3317-3332. [ Links ]
Bakhtavar, E., Shahmoradi, Μ., and Rahmati, S. 2018. Evaluation of the impacts of challenging factors on underground colliery occupational hazards in Iran using fuzzy cause and effect interaction. Iranian Journal of Mining Engineering, vol. 13. pp. 34-45. [ Links ]
Bakhtavar, E. and Shirvand, Y. 2019. Designing a fuzzy cognitive map to evaluate drilling and blasting problems of the tunneling projects in Iran. Engineering with Computers, vol. 35. pp. 35-45. [ Links ]
Bakhtavar, E., Aghayarloo, R., Yousefi, S., Hewage, Κ., and Sadiq, R. 2019. Renewable energy based mine reclamation strategy: A hybrid fuzzy-based network analysis. Journal of Cleaner Production, vol. 230. pp. 253-263. [ Links ]
BaleZentis, Α., BaleZentis, Τ., and Brauers, W.K. 2012. Personnel selection based on computing with words and fuzzy MULTIMOORA. Expert Systems with Applications, vol. 39. pp. 7961-7967. [ Links ]
Bellman, R.E. and Zadeh, L.A. 1970. Decision-making in a fuzzy environment. Management Science, vol. 17. pp. B-141-B-164. [ Links ]
Brauers, W.K. and Zavadskas, E.K. 2006. The MOORA method and its application to privatization in a transition economy. Control and Cybernetics Journal, vol. 35, pp.445-469. [ Links ]
Brauers, W.K.M., Zavadskas, E.K., Turskis, Ζ., and Vilutiene, Τ. 2008. Multi-objective contractor's ranking by applying the MOORA method. Journal of Business Economics and Management, vol. 9. pp. 245-255. [ Links ]
Brauers, W.K.M. and Zavadskas, E.K. 2012. Robustness of MULTIMOORA: A method for multiobjective optimization. Informatica, vol. 23. pp. 1-25. [ Links ]
Bruneau, G., Hudyma, M.R., Hadjigeorgiou, J., and Potvin, Y. 2003. Influence of faulting on a mine shaft-a case study: part II-Numerical modelling. International Journal of Rock Mechanics & Mining Sciences, vol. 40. pp. 113-125. [ Links ]
Chakraborty, S. 2010. Application of the MOORA method for decision making in manufacturing environment. International Journal of Advanced Manufacturing Technology, vol. 54. pp. 1155-1166. [ Links ]
Elevli, Β., Demirci, Α., and Dayi, O. 2002. Underground haulage selection: shaft or ramp for a small-scale underground mine. Journal of the South African Institute of Mining and Metallurgy, vol. 102. pp. 255-260. [ Links ]
Gligoric, Ζ., Beljic, C., and Simeunovic, V. 2010. Shaft location selection at deep multiple orebody deposit by using fuzzy TOPSIS method and network optimization. Expert Systems with Applications, vol. 37. pp. 1408-1418. [ Links ]
Hartman, H.L. and Mutmansky, J.M. 2002. Introductory Mining Engineering. Wiley. [ Links ]
Hudeja, M., Vujicb, S., Radosavlevicb, M., and Ilicc, S. 2013. Multi-variable selection of the main mine shaft location. Journal of Mining Science, vol. 49. pp. 950-954. [ Links ]
Kracka, M., Brauers, W.K.M., and Zavadskas, E.K. 2010. Ranking heating losses in a building by applying the MULTIMOORA. Engineering Economics, vol. 21. pp. 352-359. [ Links ]
Papageorgiou, E.I., Stylios, C., and Groumpos, P.p. 2006. Unsupervised learning techniques for fine-tuning fuzzy cognitive map causal links. International Journal of Human-Computer Studies, vol. 64. pp. 727-743. [ Links ]
Papageorgiou, E.I. and Kannappan, Α. 2012. Fuzzy cognitive map ensemble learning paradigm to solve classification problems: Application to autism identification. Applied Soft Computing, vol. 12. pp. 3798-3809. [ Links ]
Rao, R.V. and Patel, Β.Κ. 2010. A subjective and objective integrated multiple attribute decision making method for material selection. Materials & Design, vol. 31. pp. 4738-4747. [ Links ]
Rezaee, M.J., Yousefi, S., and Hayati, J. 2016. A decision system using fuzzy cognitive map and multi-group data envelopment analysis to estimate hospitals' outputs level. Neural Computing and Applications. doi: 10.1007/s00521-016-2478-2 [ Links ]
Rezaee, M.J., Yousefi, S., and Babaei, M. 2017. Multi-stage cognitive map for failures assessment of production processes: An extension in structure and algorithm. Neurocomputing, vol. 232. pp. 69-82. [ Links ]
Unrug, K.F. 1984. Shaft design criteria. International Journal of Mining Engineering, vol. 2. pp. 141-155. [ Links ]
Zadeh, L.A. 1965. Fuzzy sets. Information and Control, vol. 8. pp. 338-353. [ Links ] ♦
 Correspondence:
E. Bakhtavar
e.bakhtavar@mie.uut.ac.ir
Received: 22 Apr. 2018
Revised: 23 Mar. 2019
Accepted: 25 Apr. 2019
Published: October 2019

