


Services on Demand
Article
 English (pdf)
 Article in xml format
 Article references
Indicators

Related links
-
 Cited by Google
 -
 Similars in Google
Share

 Permalink
Journal of the Southern African Institute of Mining and Metallurgy
On-line version ISSN 2411-9717
Print version ISSN 2225-6253
J. S. Afr. Inst. Min. Metall. vol.119 n.10 Johannesburg Oct. 2019
http://dx.doi.org/10.17159/2411-9717/687/2019
GENERAL PAPERS
Modelling of generic excavation sequences for bore-and-fill mining
D.P. RobertsI; G.F. HofmannII; R. NelII; L.J. ScheepersII
ICSIR, South Africa
IIAnglogold Ashanti, South Africa
SYNOPSIS
Bore-and-fill mining refers to the mechanical excavation of ore through a series of holes bored on-reef and the subsequent filling of these holes with a high-stiffness material. A calibrated numerical model was used to evaluate the influences of various design parameters on bore-and-fill operations for the Carbon Leader Reef. A set of metrics was prepared and a small-span generic model used to evaluate the influence of boring sequence, fill properties, stress regime, and hole location.
The modelling indicated that most metrics stabilize when the number of hole diameters skipped between bored holes is three or greater. Increasing the skip beyond three reduces the potential for regional failure but may increase the potential for local failure. The recommended design is to skip three or more holes.
Variation of the fill properties showed that the Young's modulus has a nonlinear effect on design metrics. Closure volume was found to increase sharply when the fill stiffness is decreased below 20 to 25 GPa. The minimum suggested fill stiffness is therefore 25 GPa, where the fill performance will be within 5% of the reference case (filling with intact rock mass). The material cohesion had a linear effect on the performance metrics. A laminated model resulted in slightly increased closure and revealed that the worst-case scenario for hole position is when all the holes are drilled mostly in the weaker reef layer.
Altering the stress field to match recent stress measurements did not significantly affect the results. Increasing the driving stress by 28% had a proportionally greater effect on all metrics (25 to 45%). It was noted that implementing bore-and-fill at greater depths will require re-evaluation of the fill and sequence design.
Increasing the span by 14.2 m to 34.8 m (and adding pillars and reef raises) resulted in an 18% increase in maximum closure and a 34% increase in the closure volume increment. The damage and general behaviour was very similar to the smaller span models. The difference in metrics for pillars sizes of 7.6 and 6.3 m was not significant. Use of the calibrated model allowed for optimization of sequence and fill design parameters. The limits of the model were also explored and it was found that a larger fine-mesh zone would be needed for models at greater depth.
Laser scans of the reef drives and raises indicated rock mass deformations from 1.3 to 3.2 times the modelled closure. Though these were greater than the modelled values, it was noted that the in situ deformation also reflects time-dependent behaviour and the response of the rock mass to seismic events. The model results were assessed in terms of the observed seismic response during mining of the pilot site. It was found that the seismic response was limited and was associated with the boring of holes and limited fracturing within existing abutments. This supports the model results, which indicated limited closure volume and very little potential for the formation of seismogenic shear fractures. An elastic boundary element model was calibrated using the model outcomes, and it is shown how this model can be used to assess layouts involving bore-and-fill mining in terms of closure volume and other rock engineering design parameters.
Keywords: bore-and-fill mining, numerical model, rock mass deformation, seismicity.
Introduction
Reef boring is simply the boring of large-diameter holes along the reef plane. It is potentially a viable mining method for the extraction of narrow reefs. Reef boring is an attractive prospect because it allows continuous mining of only the reef package. Jager, Westcott, and Cook (1975) studied the feasibility of reef boring for various narrow, gold-bearing reefs. The reefs were analysed in terms of their geometry and geology, indicating which hole diameters should be used in different mining areas.
Adams (1978) describes stoping by raiseboring on the Carbon Leader Reef at West Driefontein Mine. Slots were created by drilling a series of adjacent holes. No fill was employed in these trials and the resulting rock mass response included falls of ground and time-dependent failure similar to that observed in conventional stoping. It was observed that spalling and borehole breakout were inhibited when holes were bored within the destressed, fractured region immediately ahead of the face, while significant breakout occurred around pilot holes that were bored in the highly stressed region ahead of this zone.
Stacey (1982) described attempts at stoping using a self-propelled stope-coring machine. This 'mole' machine featured a 600 mm annular, diamond-impregnated bit that could clamp itself in place and cut cylinders of rock over a stroke of up to 500 mm. In some areas it was found that the core 'burst' spontaneously, which allowed for easy rock removal and resulted in low bit wear. In areas where bursting did not occur, drilling progressed slowly and wear rates were much higher. Spalling inside the hole also interfered with the self-clamping mechanism of the machine (Pickering et at., 1987). Vogt (2016) reported that the stope-coring method had ultimately proved to be uneconomic.
Bore-and-fill mining involves boring holes of a suitable diameter on-reef and filling these holes with a high-stiffness material. The fill prevents deterioration of the rock mass around the hole and limits the closure that occurs in response to further mining. The diameter of the boring bit can be tailored to the reef so that only the ore is bored out and hoisted for processing. The method is expected to be safer than conventional operations as the rock mass response is limited by the narrow mining height and the presence of the fill. Workers are also not exposed in the active mining area. The method enables extraction with very low dilution and eliminates the inefficiencies and losses imposed by batch-based drill-and-blast mining.
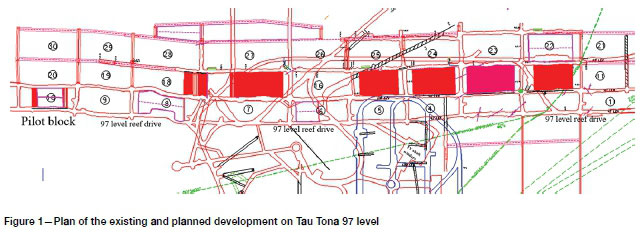
Extensive trials of bore-and-fill mining were conducted by Anglogold Ashanti (AGA) in Tau Tona mine's shaft pillar area. Reef boring was identified as having the potential of satisfying the goals of AGA's future mining philosophy: to safely (by removing people from the active stoping area) mine all the gold (by leaving fill rather than pillars), only the gold (by mining only the reef), all the time (by mining continuously). Roberts (2017) described boring experiments at the pilot site. Figure 1 shows the planned layout on Tau Tona 97 level. Blocks were created by conventional development of reef drives (along strike) and raises (on dip). These blocks were then extracted using the bore-and-fill mining method. The use of low-energy propellants for development in the shaft pillar was ultimately mandated to protect the nearby shaft infrastructure.
Holes were bored updip using conventional button cutters in a strawberry configuration. Thrust and torque were applied by a custom-made machine located in the lower reef drive. Figure 2 shows the boring of a hole adjacent to a previously filled hole.
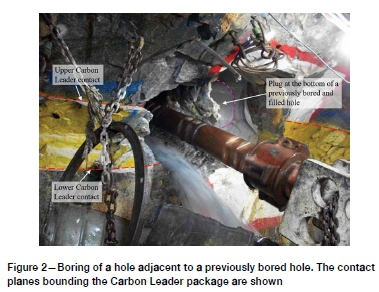
The machine underwent significant modification over the course of the project, evolving from a bolted-in-place configuration to a mobile, crawler-based solution that was capable of deploying struts to fix itself in place.
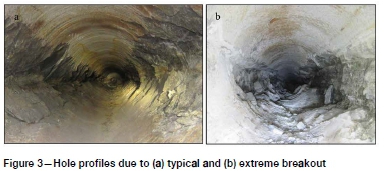
Boring of holes was accompanied by breakout in the vicinity of the cutter head. This indicated that strain energy was being relieved immediately when the excavation was advanced, thus ameliorating the potential for seismic events. Breakout varied according to the position of the holes relative to the Carbon Leader contacts, the proximity of previously bored-and-filled holes, and local variations in stress and rock mass conditions. Figure 3 shows the variation in breakout profiles observed. Breakout tended to be most pronounced along the upper Carbon Leader contact.
Roberts (2017) described the calibration of models for the simulation of bore-and-fill mining on the Carbon Leader Reef. The results from that work were used to provide property values and strategies for forward modelling. In this paper, modelling of various extraction sequences, fill property sets, stress regimes, and mining geometries is discussed. The results are evaluated in terms of closure, stresses, and the effect that the mining has on the surrounding rock mass.
Parameter variations
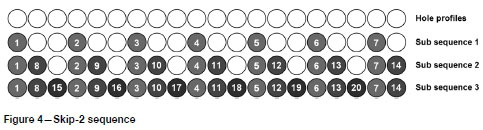
Various sequences were evaluated. Sequences are defined by the number of holes to be skipped between bored holes. Figure 4 shows a sequence where two holes are skipped (skip-2). After the first sub-sequence, two hole profiles remain unmined between the bored-and-filled holes. The first hole in the next subsequence is bored adjacent to the first hole that was bored in the previous sub-sequence (i.e. hole 8 is bored next to 1, 9 next to 2, and so on). In practice, this allows the concrete in the first hole to cure before the adjacent hole is bored. This pattern repeats (15 is bored next to 8, etc.) until the entire span has been bored and filled. The reference sequence for this study is the case where no holes are skipped (skip-0), i.e. where each hole is bored adjacent to the previous hole. This would not be done in practice, but it provides a benchmark against which to gauge the performance of other sequences.
Various fill materials were modelled. The fill strength was set to that of the nominal 'real' fill (130 MPa) and the modulus varied (fill-1 to fill-3). The modulus was then set to 35 GPa and the strength halved and then quartered (fill-4 and fill-5). The friction angle was not adjusted. The modelled fill material properties are shown in Table I.
'General conditions' refers to a set of parameter values that were assumed to apply at the location of the trial site on 97 level.
Interpretation of results
Results are evaluated in terms of the influence that the bore-and-fill mining has on the surrounding rock mass. This is manifested directly as changes in closure. In a typical stoping operation, increasing the span of the excavation results in convergence of the hangingwall and footwall. The magnitude of this convergence is termed 'closure' and can be measured by placing instruments within the stope. The magnitude of closure can be directly correlated with seismic risk in typical stoping operations (Salamon, 1983). Closure can also be expressed as the total volume of the void displaced by the deforming rock mass, referred to as closure volume. Changes in the closure volume with time or span are also indicative of increased seismic risk (McGarr and Wiebols, 1977). Maximum closure, closure volume, and closure volume increment can all be obtained reasonably simply from the model results.
The magnitude of convergence between horizons above and below the reef plane varies with vertical distance from the mining horizon, i.e. the convergence will be at a maximum between horizons immediately above and below the bored holes and will decrease as these horizons are moved apart, ultimately reaching a negligible value. Since the goal is to determine the effect of deformation on the surrounding rock mass and service excavations, convergence is calculated along horizons located at the footwall and hangingwall of the reef drives and raises. Nominally, these horizons are 1.5 m above and below the Carbon Leader Reef centreline. These convergence values serve as a proxy for the closure that could be measured at these horizons. In the remainder of this paper, the term 'closure' will be used to refer to the convergence along these horizons.
Changes in stress are also indicators of an increased risk of rock mass failure and associated seismic activity. Abutment and pillar stresses indicate the degree to which stress is channelled through the filled region and shifted away from the abutment. Energy release rate (ERR) is typically used in elastic analyses to indicate seismic risk from face bursts (Napier, 1991). In the current work, ERR is not useful as it relies on the elastic response; however, stress change at the face (a component of ERR) can serve as a partial indicator of burst potential. The maximum value and maximum change in σ1are tracked throughout the analysis. In most cases, the stress is interrogated at some distance from the CLR centreline (typically 0.5 m away), because local stress concentrations along the reef horizon tend to obscure the larger trends.
Most models contain a pillar, either between the bored reef and raise, or mirrored about the plane of symmetry at the edge of the model. The major principal stress in this pillar is averaged and tracked. This provides a measure of the extent to which the adjacent rock mass is affected by bore-and-fill mining.
Results
Generic small-span model
A relatively small span was modelled initially to allow a large number of sensitivities to be studied in a short time. A span of 14.15 m was modelled between pillars with effective widths of 11.33 m. Twenty holes of 0.66 m diameter were bored. A gap of 5 cm was left between adjacent hole profiles.
Two typical results are examined here to provide the reader with insight into the interpretation of results. The 'benchmark' sequence (skip-0) and the more typical skip-3 sequence are examined. Both models use the standard fill material under general conditions.
Typical results - skip-0 model
The closure distributions for each stage of the skip-0 analysis are shown in Figure 5. Each series corresponds to the excavation and filling of a hole (1 to 20 as indicated in the key), with the colour becoming progressively lighter with each successive hole.
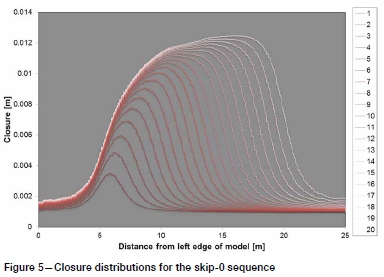
The distributions show how closure increases across the span as each new hole is bored. The final distribution of closure is skewed, due to the earlier bored holes (to the left) providing greater resistance to closure than the most recently bored holes (to the right). The maximum observed closure and closure increment for each distribution are shown in Figure 6. Closure volume (area under each distribution curve, effectively) and increment are shown in Figure 7.
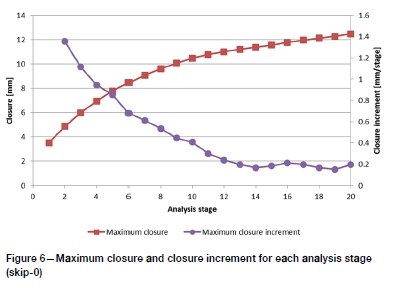
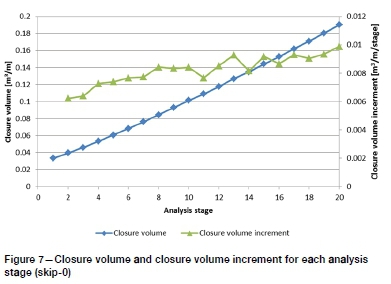
The maximum closure appears to be tending to a constant slope of between 0.1 and 0.2 mm per hole. Closure volume shows a slight increase in the increment.
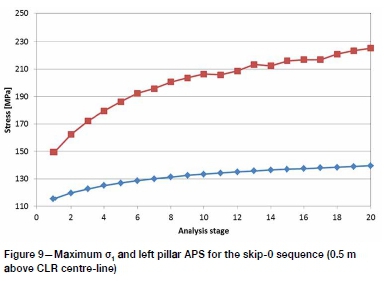
The σ1distributions (Figure 8) show a steady increase in the maximum stress in the right-hand abutment. The left-hand abutment, though increasing, does not show the same stress level, as stress in this area is channelled through the previously filled holes. Histories of the maximum σ1in each stage and the average stress in the left hand pillar are presented in Figure 9. Both histories indicate a trend towards a constant value.

Typical results - skip 3 model
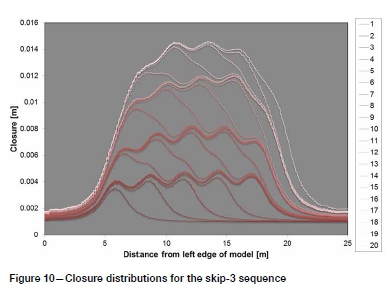
Closure distributions for the skip-3 model are shown in Figure 10. These are far more complex than those in the skip-0 model. Four distinct zones can be seen, ending at stages 5, 10, 15, and 20, representing the final stage in each sub-sequence. Closure increases as each hole is bored, from left to right, in each subsequence. The final distribution is more symmetrical than for the skip-0 sequence, as the stresses are more evenly distributed in the filled holes.
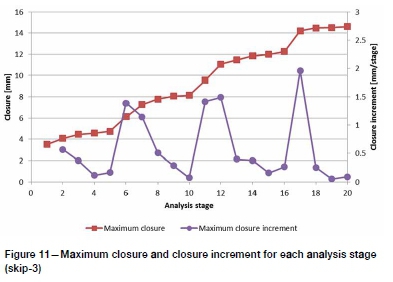
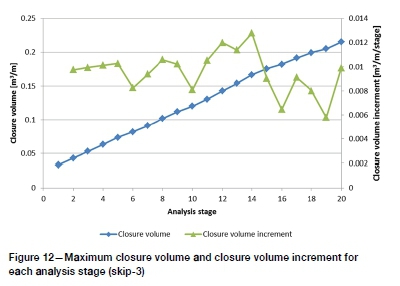
The maximum closure history (Figure 11) shows that the greatest closure increments occur at the start of each subsequence. The closure volume history (Figure 12) also shows this trend; however, the slope of the closure volume history decreases after stage 14.
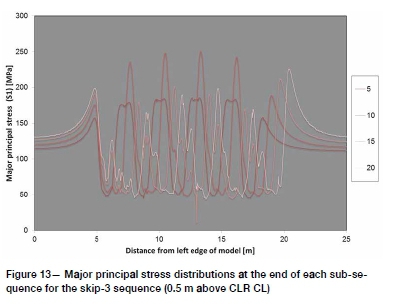
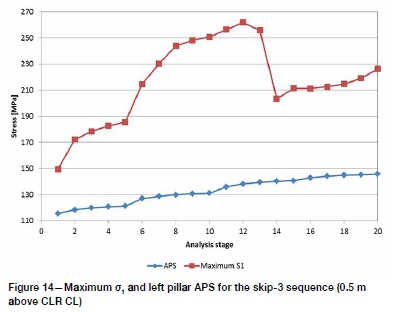
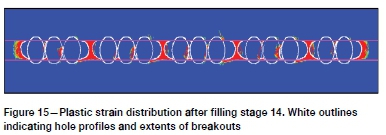
Major principal stress distributions are shown in Figure 13. Only the distributions at the end of each sub-sequence are shown to aid clarity. Maximum σ1and left pillar APS are presented in Figure 14. The maximum stress history shows a significant drop in stage 14. Examination of the plastic strain and material cohesion (Figure 15) shows that this is when all the material in the bored span has either failed or been replaced with fill. During stage 15 a hole is drilled in the abutment and in the subsequent stages holes are drilled in failed rock mass material or in the fill.
Sequence study
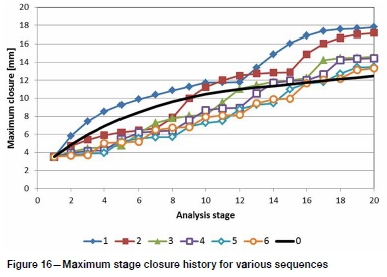
Sequences were modelled from skip-0 to skip-6. The maximum closure in each stage was obtained from the closure distributions and expressed as history graphs for the various sequences modelled (Figure 16). The skip-0 sequence is highlighted. All the sequences contains a series of logarithmic 'humps' (much like the skip-0 sequence), repeated over the number of sub-sequences.
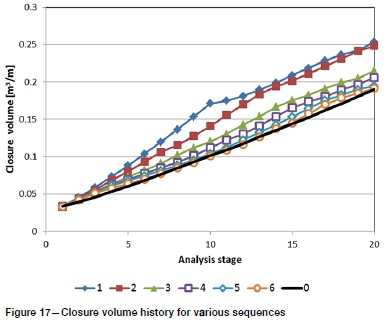
Closure volume histories are presented in Figure 17. These show a reasonably constant, near-linear increase in closure volume. Drops in closure volume rate are seen where the region to be mined contains failed rock mass or fill material, as observed after stage 14 for the skip-3 sequence. Prior to this state, the rates are greater than that of the skip-0 sequence.
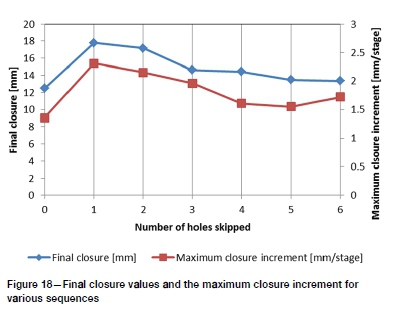
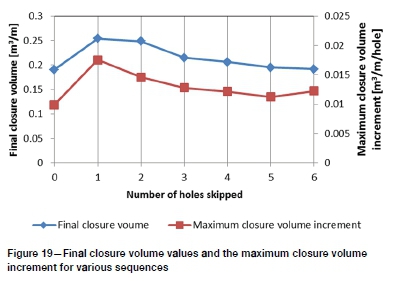
The final closures and the maximum closure increment for each sequence are presented in Figure 18. Both closure and rate of closure indicate a minimum value at skip-0, a maximum for skip-1, and a subsequent decrease with increasing number of holes skipped. The difference in closure from skip-3 to skip-6 is 1.3 mm (8.7%). Closure volumes (Figure 19) show similar relationships. The difference from skip-3 to skip-6 for closure volume is 10.8%.
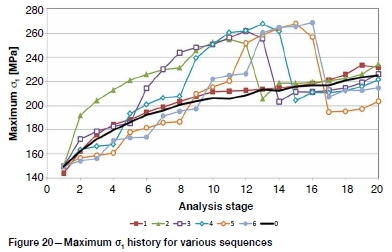
The σ1distributions for each sequence were interrogated and the maximum value in each stage was charted (Figure 20). The skip-0 sequence shows a logarithmic increase in the abutment stress with span. Skip-1 shows similar behaviour as the material between the holes fails immediately, increasing the failed span and shifting the abutment to the edge of the span. The other sequences are more complex. There is a significant immediate increase in stress in the skip-2 model as a small intact pillar is created between holes. This increase is seen in other sequences as well and corresponds with the stage at which the width of the intact pillar between holes is minimized. These sequences also show a decrease later on in the history. This corresponds to the stage at which the pillars between holes fail, as noted above. Thereafter the maximum stress shifts to the abutment at the edge of the mined span. By this stage a large proportion of the driving stress is being channelled through the fill, thus limiting the abutment stress.
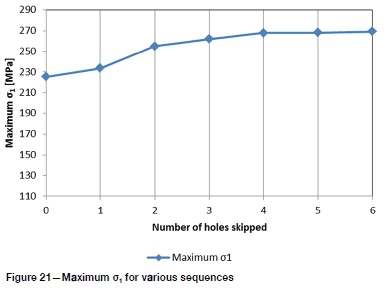
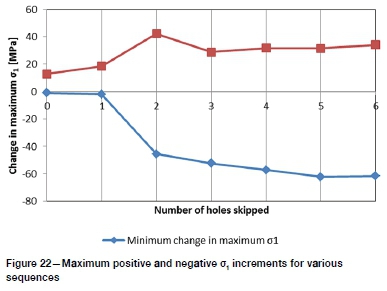
The maximum σ1values from each chart are compared in Figure 21. The maximum positive and negative increment (i.e. stage-by-stage increase and decrease in the maximum value) were extracted and are shown in Figure 22. The maximum value (and the maximum decrease) show an increase as the number of holes skipped is increased. The maximum increase, however, attains a maximum for the skip-2 sequence and is more-or-less constant for the higher skips.
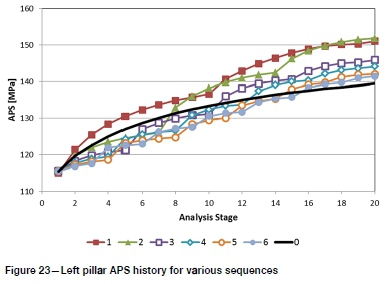
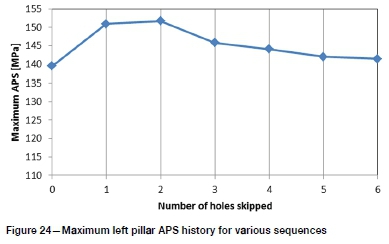
The left pillar APS is charted for each stage of each sequence in Figure 23. These graphs are very similar in appearance to the closure graphs (Figure 16). The maximum values attained for each sequence (Figure 24) also show the same trends as the maximum closure and closure volume (Figure 18 and Figure 19).
Fill material study
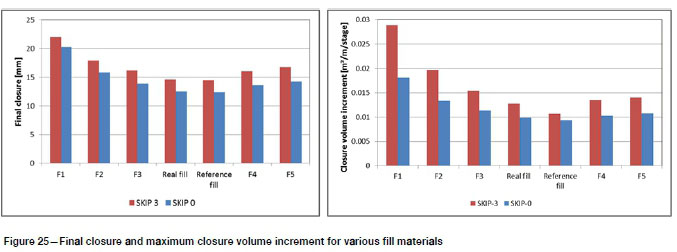
Both the skip-0 and skip-3 sequences were analysed with the fill materials described in Table I. In the following graphs, fill materials have been ordered in a way that is most revealing. From the left, the materials are, at first, sorted in order of increasing Young's modulus (F1: 5 GPa, F2: 10 GPa, F3: 17.5 GPa, 'real' fill: 35 GPa, and reference fill: 70 GPa). The remaining materials all have Young's modulus of 35 GPa and are ordered by UCS (F3: 65 MPa, F4: 32.5 MPa), and can be compared directly to the 'real' fill (£=35 GPa, UCS=130 MPa).
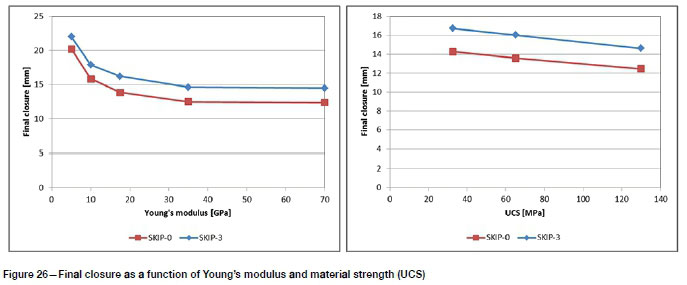
The final closure and the maximum closure volume increment for each analysis are presented in Figure 25. Closure volume displays the same trend as closure and is not shown to avoid repetition. Both graphs show a similar trend: the values increase with decreasing Young's modulus (F1 to reference fill) and, to a lesser extent, with material strength (real fill to F5). These relationships are expressed explicitly in Figure 26.
The relationship between closure and Young's modulus appears to follow a power law, where the closure increases sharply somewhere between 35 and 17.5 GPa. The 'elbow' of the relationship lies between 20 and 25 GPa, depending on the chosen interval. The relationship between closure and fill strength is linear for the range studied. The closure increases by 12% for a 75% decrease in strength.
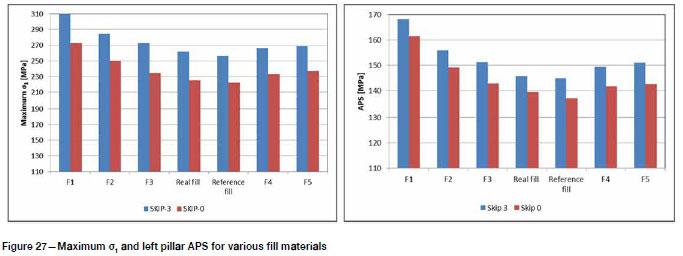
The maximum σ1and final left pillar APS are presented in Figure 27. These show similar trends to the closure and closure volume graphs.
Other variations
The stress field was adjusted from general conditions. A series of stress measurements conducted recently indicated strike-parallel stress (oxx) ratios as low as 0.27, and dip-parallel stress (σζζ) ratios of 0.38. A model was analysed with this 'low-k' stress regime.
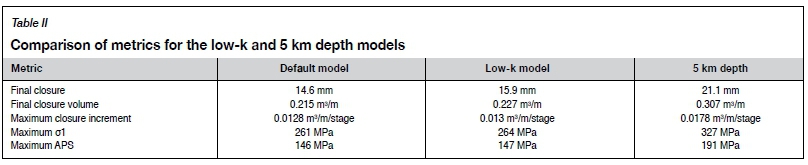
The effect of depth was studied by increasing the major principal stress to correspond with a depth of 5 km (137.3 MPa). This represents a 28% increase in the driving stress. The original k-ratios (0.44 and 0.77) were maintained for this analysis. The results are summarized in Table II.
The increase in all metrics at 5 km depth is greater than the increase in the driving stress (e.g. APS increases by 31%, closure by 42%, and closure volume increment by 40%). This indicates that more material has failed than for the original stress field. Examination of the damage distribution shows fracture zones extending up to the boundary of the FMZ. These analyses should be repeated with larger FMZ regions. The effect of lowering the k-ratios had little effect.
Small-span model with multiple stratigraphic planes
This model was developed to study the influence of multiple contact planes on the deformability of the system. A larger fine-mesh zone was included so that the position of the holes could be varied randomly. The hole positions and breakout profiles from a number of runs are shown in Figure 28. The standard deviation for the vertical and horizontal positions was 200 and 75 mm respectively.
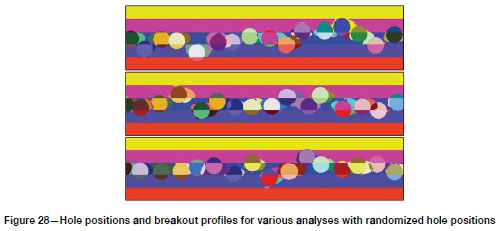
When hole position was varied, closure and closure volumes were lower than the reference case (all holes drilled at CLR centreline). This is the result of lower breakout volumes occurring in the higher strength hangingwall and footwall materials. Closure volume increments all show the characteristic 'plateau' from stage 9 to stage 15, with values both higher and lower than the reference case.
Generic large-span model
The large-span model simulates the extraction of pillars as has been planned and executed in the Tau Tona shaft pillar (Figure 1). These pillars are 50-60 m (on strike) by 25-30 m (on dip) blocks of unmined ground bounded by 3-4 m wide reef drives and raises. A strike section is modelled, representing the situation at the centre of the pillar. Reef raises are modelled on either side of the span to be mined. Unmined pillars are left between the raises and the edges of the bored-out span. A symmetry condition is imposed at the vertical centreline of the raises to imply repetition of the geometry along strike.
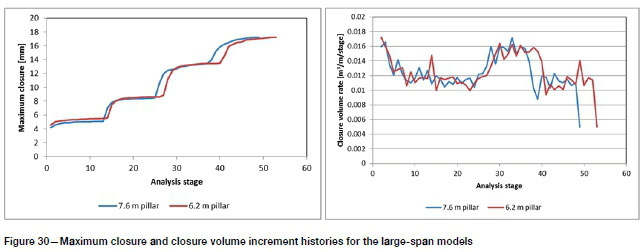
Models were run under general conditions, using measured fill properties ('real fill' in Table I) with a skip-3 sequence. Two models were run with different pillar sizes: 6.2 m (37.6 m span) and 7.6 m (34.8 m span). The maximum closure history and closure volume increment are compared in Figure 30. The closure history shows very similar trends to the small-span model, though it is clearer at the greater span that the maximum closure tends to a constant value for each sub-sequence. The closure volume increment is also more revealing at the greater span. The increment decreases initially and then increases from around stage 24 to stage 30. This corresponds to the transition from sub-sequence 2 to 3. During sub-sequence 3 the material between holes fails, as reflected by the increment 'plateau' from stages 28 to 40. By stage 40 the entire stope is either failed or filled. The closure volume increment is therefore lower from stage 40 to the end of the sequence as fill or failed material is replaced by fresh, unstressed fill.
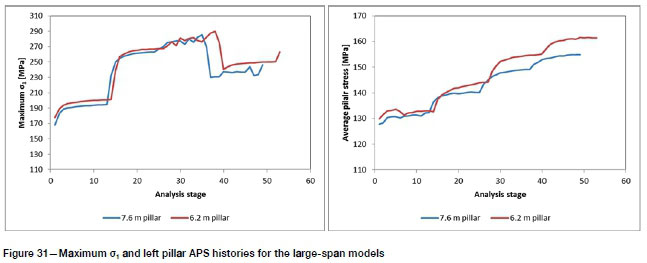
The maximum σ1and APS histories are shown in Figure 31. The maximum σ1history shows the same characteristics as in the small-span model. The APS history also shows similar behaviour, though the response in the first sub-sequence is less uniform. During this phase the pillar is being established and any additional failure is occurring within its boundaries. After the first sub-sequence very little additional failure occurs in either model.
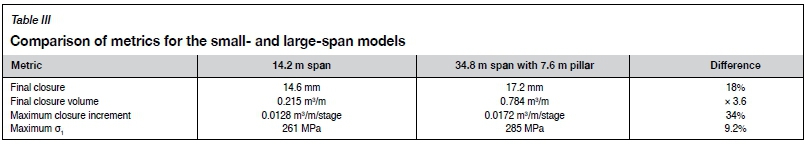
The metrics for the small- and large-span models are compared in Table III. The maximum closure is increased by only 18%, while the closure volume increment is 3.6 times greater in the large-span model. This is to be expected, as doubling the span will (at least) double the closure volume. The closure volume increment is increased by 34%. In general, the trends seen in both the large- and small-span models are consistent, indicating that the results from the small-span model can be extrapolated to the large-span model (bearing in mind that the metrics will naturally be increased for the larger span).
Discussion
Most of the metrics (closure and rate, closure volume and rate, and pillar APS) indicate that skipping more holes improves stability and decreases inferred seismic risk. The maximum σ1 and σ1change, however, indicate increased risk of bursting as more holes are skipped. This is a feature of the trade-offs that exist between local and regional stability in designing mining layouts. As the number of holes skipped is increased, failure is deferred towards the end of the sequence. More stress is concentrated in the remaining intact material, thus increasing the burst potential. The region within which the mining takes place is not affected by the local stress concentration and the average stresses and deformations decrease as the skip is increased and more stress is channelled through the fill.
Skipping one and two holes resulted in significantly poorer performance in terms of the regional metrics. The increase in closure volume from the skip-0 model is over 30% for both (compared to 13% for the skip-3 model). As noted above, the performance plateaus from skip-3 to skip-6 (10.8% difference). This is also true for the local metrics (σ1and σ1change), where the maximum stress from skip-3 to skip-6 varies by only 4.6% (compared to 26% from skip-0 to skip-2). To balance the local and regional seismic risk metrics, the most efficient sequence is at the start of both performance plateaus, i.e. skip 3. The increased risk of local failure from skip-4 to skip-6 is minimal.
The consequences of these risks being realized should also be considered. Local failure (bursting) will result in rock being ejected from the intact hourglass pillars between previously bored holes. Since the adjacent holes are filled, ejection can only be directed into the hole that is being (or has been) bored. It is unlikely that localized failure in this context will result in damage to the service excavations, where personnel may be present. The failure of these pillars, however, may result in trapping of the drill head or other difficulties associated with boring of fragmented material.
The risk of regional failure (e.g. slip induced on a subcritical discontinuity) is also considered. While the study area is free of major seismogenic discontinuities, bore-and-fill mining is planned in areas of the shaft pillar which neighbour structures that were associated with damaging seismicity during conventional stoping. Time-dependent rock mass movement has also resulted in relatively large events (ML >3.0) on structures in the shaft pillar in the absence of mining. It is therefore possible that damaging events may be triggered by the rock mass disturbance imposed by bore-and-fill operations. However, the likelihood and potential consequences of these events are much lower than for conventional stoping.
The effect of fill properties is captured in Figure 26. The relationship between closure and Young's modulus follows a hyperbolic or power law with an 'elbow' between 20 and 25 GPa. The relationship between strength and closure is linear and has a far less profound effect than the Young's modulus.
Reducing the minor principal stress to the lowest measured in the area did not significantly affect the results. Increasing the driving stress by 28% had proportionally greater effects on all metrics. Damage around the holes extended to the edge of the FMZ, indicating that even greater damage and higher values of closure can be expected in the greater stress regime. It was also found that the closures and associated metrics were greater when all the holes are drilled mostly in the reef layer. Closure is reduced when holes are bored in the stronger hangingwall or footwall strata.
Including pillars and increasing the span resulted in an 18% increase in maximum closure and a 34% increase in closure volume increment. The damage and general behaviour were very similar to the smaller span models. The difference in metrics for pillars sizes of 7.6 and 6.3 m was not significant.
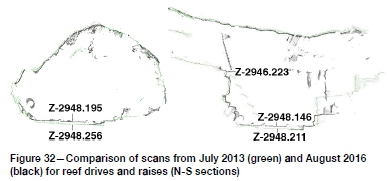
Estimation of in situ closure from scan data
The reef drives and raises around the pilot site were laser-scanned when the boring operations began (July 2013) and more recently once more than 80% of the pillar had been bored and filled (August 2016). A selection of scans is shown in Figure 32. The black point cloud was generated from the more recent scan. The change in position of the hangingwall points varies between 23 and 55 mm, with an average of around 35 mm. Though these values are larger than modelled closures, the in situ deformation also reflects time-dependent closure and ground motion driven by seismic events. This suggests that the modelled values are a lower limit for the expected deformations. Comparing the results, the ratio of in situ to modelled deformation is at most 3.2, though it is expected that this value will increase as the in situ driving stress increases. Measured closure ratios (the ratio of instantaneous to total closure) of 0.35 are typical for the Carbon Leader Reef (Malan, 2003). This compares favourably with a value of 0.31, the ratio of modelled (17 mm) to maximum measured (55 mm) results.
Rock mass seismic response
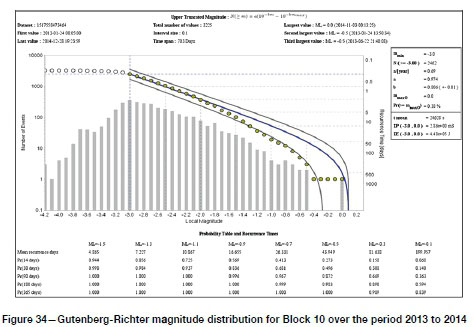
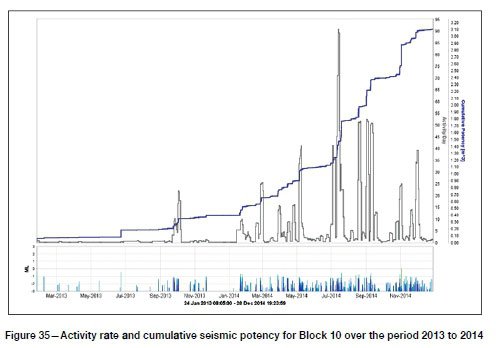
The seismic system provided coverage to a minimum magnitude (M-min) of -3.0 during the time period of interest, with around 11 geophone sites operating in the shaft pillar itself. Network sensitivity is therefore good, but location accuracy is compromised because of the extensive development, including large mining cavities within the shaft pillar. Figure 33a shows all the recorded seismic events over the period 2013 to 2014 around the bore-and-fill mining panel of interest (Block 10). Figure 33b shows events with ML > -2.0. The Gutenberg-Richter magnitude distribution is shown in Figure 34. A time history is shown in Figure 35, including activity rate and cumulative seismic potency as a measure of rock mass seismic response.
Location accuracy is probably better than 10 m, and therefore small-scale features, such as drilling-induced fracturing and geological discontinuities, are not discernible. It is reasonable to assume that the observed seismic response is, in general, associated with the production hole drilling, and fracturing near abutments of existing excavations. Only small-magnitude events (local magnitude ML < 0.0) were recorded within the pillar during the mining period. Source parameters are notably less accurate for small seismic events subject to the frequency response of the geophones used, although seismic potency should be a reasonable estimate of co-seismic volume change. This is of interest here because it can be directly compared with modelled closure volume and maximum closure associated with mining the panel. Total seismic potency for the recorded events is calculated as 3.3 m3.
It can be concluded that minimal rock mass seismic response occurred during the mining period. This is supported by the fact that no significant rockburst damage occurred. Up to February 2018, the largest seismic event recorded in this area was a ML 0.2, on 11 May 2016, indicating that there was no increased rock mass seismic response after the bore-and-fill mining ended.
It should be noted that different circumstances in terms of stress levels and geology may result in a more severe seismic response. In particular, geological structures under elevated stress levels should always be considered to pose a seismic hazard, which should be analysed diligently.
Calibration of boundary element models
Modelling of layouts with bore-and-fill mined pillars cannot be done efficiently using nonlinear continuum models. The large modelled volumes involved require the use of large-scale elastic models that are typically employed to model stoping layouts. A simplified approach is taken with bore-and-fill mining, wherein the entire area of the reef to be extracted is removed in a single step and replaced by an elastic material. The Young's modulus of this material is calibrated such that the expected maximum closure from the nonlinear models is obtained.
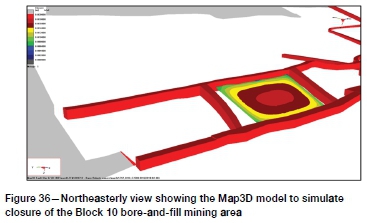
A model of the actual bore-and-fill Block 10 was built with the Map3D boundary element code, including the shaft pillar infrastructure and mining spans around the shaft pillar. This model is shown in Figure 36 around the area of interest. The pre-mining stress state of Hofmann, Scheepers, and Ogasawara (2013) was incorporated, but the nearby infrastructure (reef drives and raises) was not included, hence approximating the field stress based on best available information. A stoping width of 0.66 m was used as average for all the bored holes. The aim was to simulate the bore-and-fill mining realistically towards setting up an appropriate modelling methodology for assessment of planned mining layouts.
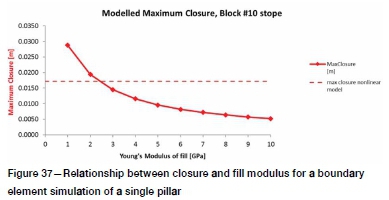
The mining area elements were given various Young's moduli, and normal closure was extracted from the model results. The resulting relationship between maximum closure and Young's modulus is shown in Figure 37. Maximum closure obtained for the equivalent nonlinear model is 17.2 mm, which corresponds to a Young's modulus of approximately 2.5 GPa in the elastic model. This value was then used for modelling of layouts.
The total closure volume of the elastic model (calculated from the closure shown in Figure 36) is 16.0 m3. This can be compared with the recorded cumulative seismic potency of 3.3 m3 as given in the previous section. Both these observed and modelled volume values are naturally subject to various assumptions, but they are sufficiently robust to allow calibration. For more discussions on theoretical and practical implementation on closure volume and seismic moment (which scales with seismic potency), see McGarr (1976), McGarr and Wiebols (1977), and Randall (1971). If the observed versus modelled volume change is interpreted literally, it is suggested that 21% of the modelled elastic closure resulted in volume change associated with recorded seismic events. Similar analyses for conventional tabular mining at Tau Tona and Mponeng mines revealed recorded versus modelled volume changes ranging from 10 to 30%. This relationship is in the same range as the model results and supports the applicability of the methodology proposed here for bore-and-fill mining.
Forward modelling using boundary element models
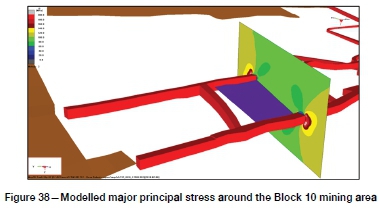
The calibration and methodology described above can now be used for elastic modelling assessment of planned bore-and-fill mining layouts. Apart from building the mining layout, regional mining, and infrastructure (in 3D), the appropriate stoping width and pre-mining stress state have to be incorporated. If the same fill properties and methodology as described above are used, the elastic model should give a realistic assessment of closure volume and associated potential seismic response. The model should also give realistic estimates of rock mass stress as well as surface stress along geological structures, enabling quantification of these towards seismic hazard assessment. Figure 38 shows modelled stress around the mining area and infrastructure, from which desired failure criteria can be calculated. An important consideration in the elastic model is that the stress around abutments will be excessive, since no nonlinear fracturing is simulated. The stress peak is also shifted away from the rock face where fracturing occurs. However, since the maximum closure calibration with the nonlinear model was done excluding the infrastructure (reef drives), the elastic assessment will be a worst-case scenario in terms of rock mass stress levels.
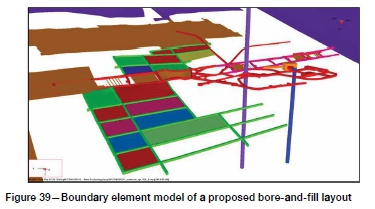
The boundary element model, in particular Map3D, allows for mine-wide models to be built and run efficiently. Based on the calibration and demonstrated methodology of rock mass stress analysis, it is proposed to build the infrastructure in 3D as fictitious force elements (including shafts, tunnels, and large excavations), and the planned mining as displacement-discontinuity elements. Figure 39 shows a model of a proposed layout in the current mining area as an example. Such a model will allow the usual elastic modelling analyses, indicating potential stress interaction between excavations and quantifying design criteria such as excess shear stress on structures, rockwall conditions factor (RCF) along tunnels, and closure volume.
Conclusions
A study of boring sequences indicated that most metrics stabilize when the number of holes skipped is three or greater. Increasing the skip beyond three increases the potential for local failure (maximum but reduces the potential for regional failure (closure and closure volume). It is suggested here that the optimal sequence is to skip three holes. As discussed above, skipping a greater number of holes is associated with less severe consequences in the event of unexpected rock mass failure. For this reason any sequence where the number of holes skipped is greater than three is acceptable.
Variation of the fill properties showed that the Young's modulus has a more profound effect on all the performance metrics than the material strength. APS and closure volume increase sharply somewhere between 20 and 25 GPa. The minimum suggested fill stiffness is therefore 25 GPa, where the fill performance will be within 5% of the ideal case, that is, filling with intact rock mass. At 30 GPa stiffness, the performance is within 2% of the ideal case. The material cohesion had a linear effect on the performance metrics.
Reducing the minor principal stress to the lowest measured in the area did not significantly affect the results. Increasing the driving stress by 28% had proportionally greater effects on all metrics. Damage around the holes extended to the edge of the FMZ, indicating that even greater damage and higher values of closure can be expected in the greater stress regime. Bore-and-fill mining at greater depths should be evaluated using enhanced models to determine optimal sequences and fill properties.
Including pillars and increasing the span resulted in an 18% increase in maximum closure and a 34% increase in the closure volume increment. The damage and general behaviour were very similar to the smaller span models. The difference in metrics for pillars sizes of 7.6 and 6.3 m was not significant. It was also found that closure was greatest when all the holes are drilled mostly in the reef layer - closure is reduced when holes are bored in the stronger hangingwall or footwall strata.
Laser scans indicated that the in situ deformation in the service excavations around the pilot pillar varied from 23-55 mm. The deformation according to the equivalent model was 17.2 mm, indicating that the modelled value is a minimum, while the deformation may be as high as 3.2 times the modelled value.
The rock mass seismic response for the mining of the pilot site resulted in minimal seismic response. No large seismic event occurred during or after the mining period (up to February 2018). From a seismic response point of view, it is concluded that the bore-and-fill mining method, using the currently deployed fill properties and placement procedure, has the potential to limit closure and reduce seismic hazard.
The results from the 50 m span inelastic model were used to calibrate the Young's modulus of the fill emplaced in an equivalent boundary element model. Mining layout and infrastructure were included in the boundary element model, and the best information on field stress was incorporated. For the given conditions, it was found that a Young's modulus of 2.5 GPa would result in similar closure to that seen in the nonlinear model. A methodology is thus proposed for assessing planned bore-and-fill mining layouts in terms of seismic hazard and other design criteria.
References
Adams, G.R. 1978. A study of the fractures forms in the rock around openings made by a reef boring machine. Research report no. 60/78. Chamber of Mines Research Organisation, Johannesburg. December 1978. [ Links ]
Hofmann, G.R, Scheepers, L.J., and Ogasawara, H. 2013. Loading conditions of geological faults in deep level tabular mines. Proceeding of the Sixth International Symposium on in situ Rock Stress. Ito, T. (ed.). Japanese Committee for Rock Mechanics. Tokyo. pp. 558-580. [ Links ]
Jager, A.J., Westcott, Μ., and Cook, N.G.W. 1975. A geological assessment of the applicability of reef boring to mining the Basal, Carbon Leader and Vaal Reefs. Research report no. 20/75. Chamber of Mines Research Organisation, Johannesburg. May 1975. [ Links ]
McGarr, A. 1976. Seismic moment and volume changes. Journal of Geophysical Research, vol. 81, no. 8. pp. 1487-1494. [ Links ]
McGarr, A. and Wiebols, G.A. 1977. Influence of mine geometry and closure volume on seismicity in a deep-level mine. International Journal of Rock Mechanics and Mining Sciences & Geomechanics Abstracts, vol. 14, no. 3. pp. 139-145. [ Links ]
Napier, J.A.L. 1991. Energy changes in a rock mass containing multiple discontinuities. Journal of the South Afican Institute of Mining and Metallurgy, vol. 91, May 1991. pp. 145-157. [ Links ]
Pickering, R.G.B., Brinkmann, J.R., Byrne, O.S., Haase, Η., and Hind, P.F. 1987. Stoping review of past work - Rock breaking. Chamber of Mine Research Organisation, Johannesburg. November 1987. [ Links ]
Randall, M.J. 1971. Shear invariant and seismic moment for deep-focus earthquakes. Journal of Geophysical Research, vol. 76, no. 20. pp. 4991-4992. [ Links ]
Roberts, D.P. 2017. Calibration of a numerical model for bore-and-fill mining. Journal of the Southern Afican Institute of Mining and Metallurgy, vol. 117, no. 7. pp. 705-718. [ Links ]
Salamon, M.D.G. 1983. Rockburst hazard and the fight for its alleviation in South African gold mines. Proceedings of Rockbursts - Prediction & Control, London, 20 October 1983. Institution of Mining and Metallurgy. pp. 228-229 [ Links ]
Stacey, T.R. 1982. Mechanical mining of strong brittle rock by large diameter stopecoring - Rock mechanics investigations. Proceedings of the 14th Canadian Rock Mechanics Symposium on Rock Breaking and Excavation. Baumgartner, P. (ed.). CIM, Montreal. pp. 96-99. [ Links ]
Vogt, D. 2016. A review of rock cutting for underground mining: past, present, and future. Journal of the Southern Afican Institute of Mining and Metallurgy, vol. 116, no. 11. pp. 1011-1026. [ Links ]
 Correspondence:
D.P. Roberts
droberts@csir.co.za
Received: 26 Mar. 2019
Revised: 31 May 2019
Accepted: 12 Jun. 2019
Published: October 2019

