Services on Demand
Article
 English (pdf)
 Article in xml format
 Article references
Indicators

Related links
-
 Cited by Google
 -
 Similars in Google
Share

 Permalink
Journal of the Southern African Institute of Mining and Metallurgy
On-line version ISSN 2411-9717
Print version ISSN 2225-6253
J. S. Afr. Inst. Min. Metall. vol.119 n.7 Johannesburg Jul. 2019
http://dx.doi.org/10.17159/2411-9717/566/2019
PAPERS OF GENERAL INTEREST
Coal pillar strength analysis based on size at the time of failure
J.N. van der Merwe
Visiting Professor, School of Mining Engineering, University of the Witwatersrand
SYNOPSIS
A major shortcoming of the statistical back-analysis of coal pillar strength is that it relies on the as-mined pillar dimensions, not taking into account time-related pillar scaling with subsequent reduction in pillar width. The paper describes an investigation where the rate of pillar scaling was applied to the pillars in the databases of failed and unfailed pillars. The reduced pillar sizes were then used in the same method of statistical back-analysis that had been used in the past.
This resulted in an equation for pillar strength which predicts significantly greater pillar strength than the previous statistical analyses, which is similar to the strength which had been found earlier by direct testing of large specimens underground. It is concluded that the lower strengths found by previous statistical analyses are due to the incorrect pillar width being used and that by adjusting the pillar sizes to compensate for scaling, more credible results that correspond to direct testing are obtained.
As the newly derived strength equation is time-dependent, it follows that the safety factors and probabilities of failure are likewise time-dependant. An equation to determine the probability of failure is also developed. This results in the safety factor being close to unity at a probability of failure of 50%, which is aligned to statistical expectation.
Keywords: coal pillars, time dependency, pillar failure, failure probability.
Introduction
Since the Coalbrook mine disaster, caused by massive pillar collapse, there have been several attempts at analysing and defining the strength of coal pillars. It was realized in the very beginning that performing classical strength tests on coal specimens in a laboratory and then transferring those results to real coal pillars could not be successful. The scatter of results is one problem and, more seriously, there is a size effect (at least for small specimens) that made the transformation of strength results to much larger coal pillars underground all but impossible.
Two main schools of thought then emerged. Some researchers preferred to perform direct strength tests on large specimens underground, while others relied on statistical back-analysis of failed and unfailed pillar cases, attempting to determine the differences in size and shape that would allow a satisfactory prediction of failure. The latter school of thought resulted in the method that was widely accepted by the South African coal mining industry, described in the landmark publication by Salamon and Munro (1967).
Since that time there have been a number of re-analyses, prompted by more failures occurring, resulting in larger and hence more reliable databases, the realization that there are meaningful differences in the pillar strength characteristics in different coalfields, and alternative methods of analysis. By and large, all of these attempts can be seen as updates of the original work by Salamon and Munro (1967).
One of the difficulties with statistical methods is that the effects of time on pillar strength are not taken into account. A pillar case in the databases is merely classified as either failed or unfailed, meaning that pillars of different ages at their time of failure (and consequently having undergone different magnitudes of size reduction) are all treated the same. Only the as-mined dimensions are considered.
This paper describes an attempt to overcome that difficulty by basing the statistical analysis on the expected sizes of the pillars at their time of collapse. The outcome is a new pillar strength formula, based on dimensions as well as age, which is then further developed to result in a time-related probability of failure.
The paper first summarizes the historical developments that led up to the present analysis in order to provide the required context. It then describes the methodology that was used and presents the final outcomes.
Note that where mention is made of 'pillar failure' in this paper it means the collapse of relatively large groups of pillars, and not the collapse of individual pillars. The collapse cases had to be sufficiently wide to result in subsidence of the surface, substantially greater than would be caused by elastic compression of the pillars, in order to be included in the database.
Following the suggestion by Salamon, Canbulat, and Ryder (2006), the term 'unfailed' is used throughout to refer to the database of pillars that had not failed. It is interesting to note that one of the motivations for using the term (as opposed to 'stable' cases) was that the pillars in that database may fail at some time in the future.
Historical developments
It is not the aim of this paper to provide a comprehensive overview of coal pillar strength developments. Only those developments that have relevance to the present study and that could be seen as milestones leading up to the present work are briefly described in order to provide the historical context.
The cornerstone work by Salamon and Munro (1967)
Following the Coalbrook disaster in 1960, described by van der Merwe (2000), it was realized that a method to define coal pillar strength was urgently required, as no satisfactory method existed at the time. It was soon seen that laboratory tests on coal specimens would not result in an acceptable outcome. The main problem was that strength is size-dependent and transforming the laboratory test results to real coal pillars was not sufficiently accurate.
It has been shown since the very early times that the strength of a rock pillar, σρ, can be described by the following fundamental equation:

where
k = constant related to the material strength
w = pillar width
h = pillar height
α and β are constants related to material type.
The constant β consistently has negative value. The strength of a pillar is thus directly proportional to its width and inversely proportional to height.
Salamon and Munro (1967) overcame the size obstacle by using cases of failed pillars underground in a statistical analysis to determine the critical parameters. What they essentially did was to set up two databases: one for failed cases (27 cases) and one for unfailed cases (98 cases). The selection criteria are described in the reference. The analysis was thus based on real pillars and not laboratory-sized specimens. Note that the database of failed cases represented the full population of known failures, while the unfailed database was a representative sample of the unfailed cases.
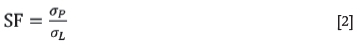
It was reasoned that if both the strength of pillars and the loads imposed on them, σι, are known, it would be possible to have a measure of stability. The simplest measure of stability is merely the ratio of pillar strength to the load imposed on it, the safety factor (SF):
The pillar load is simply assumed to be caused by the weight of the overlying strata, distributed equally over the pillars, or
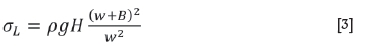
where H = depth to floor of the workings
B = bord width.
(Note for clarification - in the context of this paper, pg is often replaced by 0.025 MN/m3, and w + B by the pillar centre distance, C).
The maximum likelihood estimation method was used to determine the parameters k, α, and β to be used in Equation [1]. The maximum likelihood function as it was used is based on the assumption that pillars failed at a load equal to their strength, i.e. at SF = 1. The method then results in values for k, α, and β that cause the frequency distribution of SF to be as densely concentrated around a value of unity as possible.
The maximum likelihood function also takes account of the existence of unfailed pillars in the sense that the two fundamental requirements in the calculation are that for the failed database, SF = 1 and for the unfailed data base, SF > 1. Yet, the method is much more reliant on the failed cases than the unfailed ones as the first requirement dominates the process.
Although this is not claimed by the authors, criticism of the method includes the salient assumption that at the time of mining, the pillars contained in the failed database had dimensions resulting in SF = 1 - either intentionally or by chance. This is not the case, as pillar sizes were determined by operational requirements more than stability and pillars could thus have any size suiting those operational requirements as long as failure did not occur during the mining operation.
It furthermore assumes that pillar dimensions remained constant over the period until they failed, which is also known not to be the case. It does not explain why pillars fail at vastly different ages, ranging from just a few months to more than 50 years. The authors also noted that it was very likely for different coal seams or regions to have different strength constants, but there was simply not sufficient data to perform the analysis for different areas.
Nonetheless, the constants that Salamon and Munro determined were successfully used in the mining industry for several decades, and while more pillar failures have occurred since the introduction of the formula, there has not been a repeat of the Coalbrook disaster. The additional failures that occurred do not imply that the formula as it was used was incorrect. If anything, they demonstrate the nature of variability, and with that, the power of using a probability of failure approach to pillar design.
Salamon and Munro found the following:
k = 7.2 MPa
α = 0.46
β = -0.66
It has to be noted that while k in terms of the equation equals the strength of a cubic metre of coal, it is not a laboratory-determined unit strength: it is a statistically determined number related to the material strength. For this reason, k should be seen against the background of the linked group of constants. It is incorrect to develop a new strength formula by merely changing the value of k without at least investigating the impact on α and β.
The early direct strength tests
A comprehensive overview of the attempts to base pillar strength on tests performed underground on larger specimens than can be tested in a laboratory is provided by van Heerden (1975). Although these outcomes did not find application in the South African coal mining industry, they did elsewhere, notably in the USA and Australia.
Direct tests have distinct advantages over the statistically based methods. The most important advantage is that the exact dimensions of the specimen are known at the time of testing. The outcomes are also site-specific and therefore not contaminated by the inclusion of weaker or stronger pillars from other areas or seams. This is confirmed by the fact that different strengths were indeed found for different geographical areas, even within the same coalfield.
The latter advantage is also perhaps the most important disadvantage in the sense that results from one set of tests cannot be summarily applied elsewhere; separate tests will be required for different mines. A summary of the results reported by van Heerden (1975) is given in Table I.
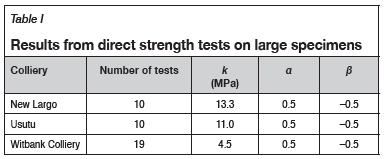
It is noteworthy that in all three cases, it was found that α and β have values of 0.5 and -0.5 respectively, and that two of the three tests resulted in substantially higher values of k than found by Salamon and Munro (1967). It is possible that the tests at Witbank Colliery cannot be directly compared to the other two, as the tests were carried out by ensuring uniform loading across the specimens as opposed to uniform displacement for the other two sets of tests.
Note should also be taken of the work by Wagner (1974), who performed the tests at Usutu Colliery. For the purposes of this paper one of the important conclusions is that large specimens fail by a process of progressive spalling of the pillar sides from the edges towards the core.
Subsequent updates
Over the years following the initial work, updates have been provided at different times although they were not necessarily used by the industry. The updates were prompted primarily by changes in the databases as more information became available from failures that continued to occur. Over time, the database of failed cases increased in size and therefore could be expected to yield more reliable results. By 2012, the database of failed cases had grown from the 27, which was available to Salamon and Munro, to a total of 86 cases. Differentiation of the coalfields and alternative methods of analysis also motivated re-analysis at different times. Table II summarizes the important outcomes over the period after the initial work.
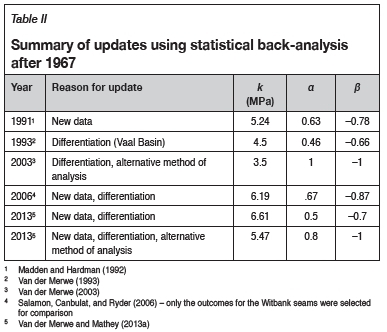
The alternative method of analysis referred to in Table II is the overlap reduction (OR) method. This method is based on the requirement for a SF that it has to allow the maximum possible separation between the databases of failed and unfailed cases, seeing that the primary purpose of having a SF is to ensure that failure is prevented. It is a standard statistical method that merely calculates the area of overlap between two normal distributions.
It does not pose the requirement that pillars had to be mined with the intention of having a SF of unity and it makes full use of the database of unfailed cases. Nonetheless, it also results in the average SF of failed cases equal to unity, the major difference between this method and the maximum likelihood function being that it does not result in the minimum scatter of SF around a value of unity. It was seen that the outcome from the OR method results in better separation of the databases. It therefore serves the primary function of the safety factor concept, which is to better distinguish between failed and unfailed pillars.
There were two other significant developments that led up to the analysis described in this paper. The first was an attempt to determine the rate of pillar scaling in order to predict the time at which failure can be expected. This was based on the understanding that the reason for delayed pillar failure is that all pillars scale to greater or lesser degrees and that failure will occur only when the pillars have scaled to some critical size. This method was first proposed in 2003 and updated in 2016 (van der Merwe, 2016).
The second development was the establishing of a link between the SF and probability of failure (van der Merwe and Mathey, 2013b). The basis for this development was a comparison of failed cases to the total number of cases in each interval of safety factor, making use of the full population of unfailed cases which was found by extension of the sample database. The reason for the development was to find a more rational way to quantify the measure of stability than can be done with the SF on its own.
Current situation
The current situation as compared to that in 1967 can be summarized as follows:
> The database of failed cases has grown from 27 to 86
> There is now sufficient data to allow differentiation of some coalfields, in particular the Witbank no. 2 and 4 seams and the Highveld seams
> There is a more suitable method of analysis;
> There is a method to determine the amount of pillar scaling over time for the Witbank no. 2 and 4 seams and the Highveld seams
> There is a method to determine the probability of failure for the Witbank no. 2 and 4 seams and the Highveld seams.
However, there is at least one major missing item. The pillar strength, as well as the probability of failure, are still based on the as-mined dimensions of the pillars. It is proposed that this is the cause of some deviations from expectations that still exist, such as the fact that the probability of failure is not 50%, but close to 8%, at SF = 1 using the probabilistic approach as proposed by van der Merwe and Matthey (2013c). The reason for this is that by using the as-mined dimensions and the full population of unfailed pillar cases, there are a number of surviving low safety factor cases in the unfailed database that cannot be ignored. The rest of the paper is devoted to an attempt to overcome this problem.
The existence of those unfailed pillars cannot be explained by using the safety factor concept as the only indicator of pillar stability. This is just another indication that the probabilistic approach should be used in the evaluation of stability.
Basis of the new analysis
The analysis described in this paper is based on a simple concept. The pillar sizes in the database of failed cases were reduced by using the expected scaling rate and applying that over the period between mining and failure. This resulted in the expected pillar sizes at the time of failure. Likewise, the pillar sizes in the unfailed database were reduced by applying the same scaling rates over the period since the time of mining and the year 2012, when the database was created.
The pillar strength was then determined by applying the overlap reduction method to the two adjusted databases. This resulted in pillar strength based on the dimensions of pillars at the time of failure, and not at the time of mining.
The full population of unfailed cases was next determined by extending the sample database by the most reasonable estimate of the number of 'panel units' that exist. The notion of a 'panel unit' was introduced to break up the entire mined area into standardized areas. It has been seen that initial pillar collapse areas are circular, with a diameter approximately equal to the panel width. It is then reasoned that collapses separated by more than 2.5 times the panel width would likely be considered as separate collapses. The 'panel unit' is thus an area described by the panel width and length equal to 2.5 times the panel width.
Finally, the probability of failure was determined by comparing the failed cases in each interval of SF with the total number of panel units in the same intervals.
All this was done by considering the Witbank no. 2 and 4 seams and the Highveld Coalfield only. The outcomes are thus restricted for applicability to those two areas.
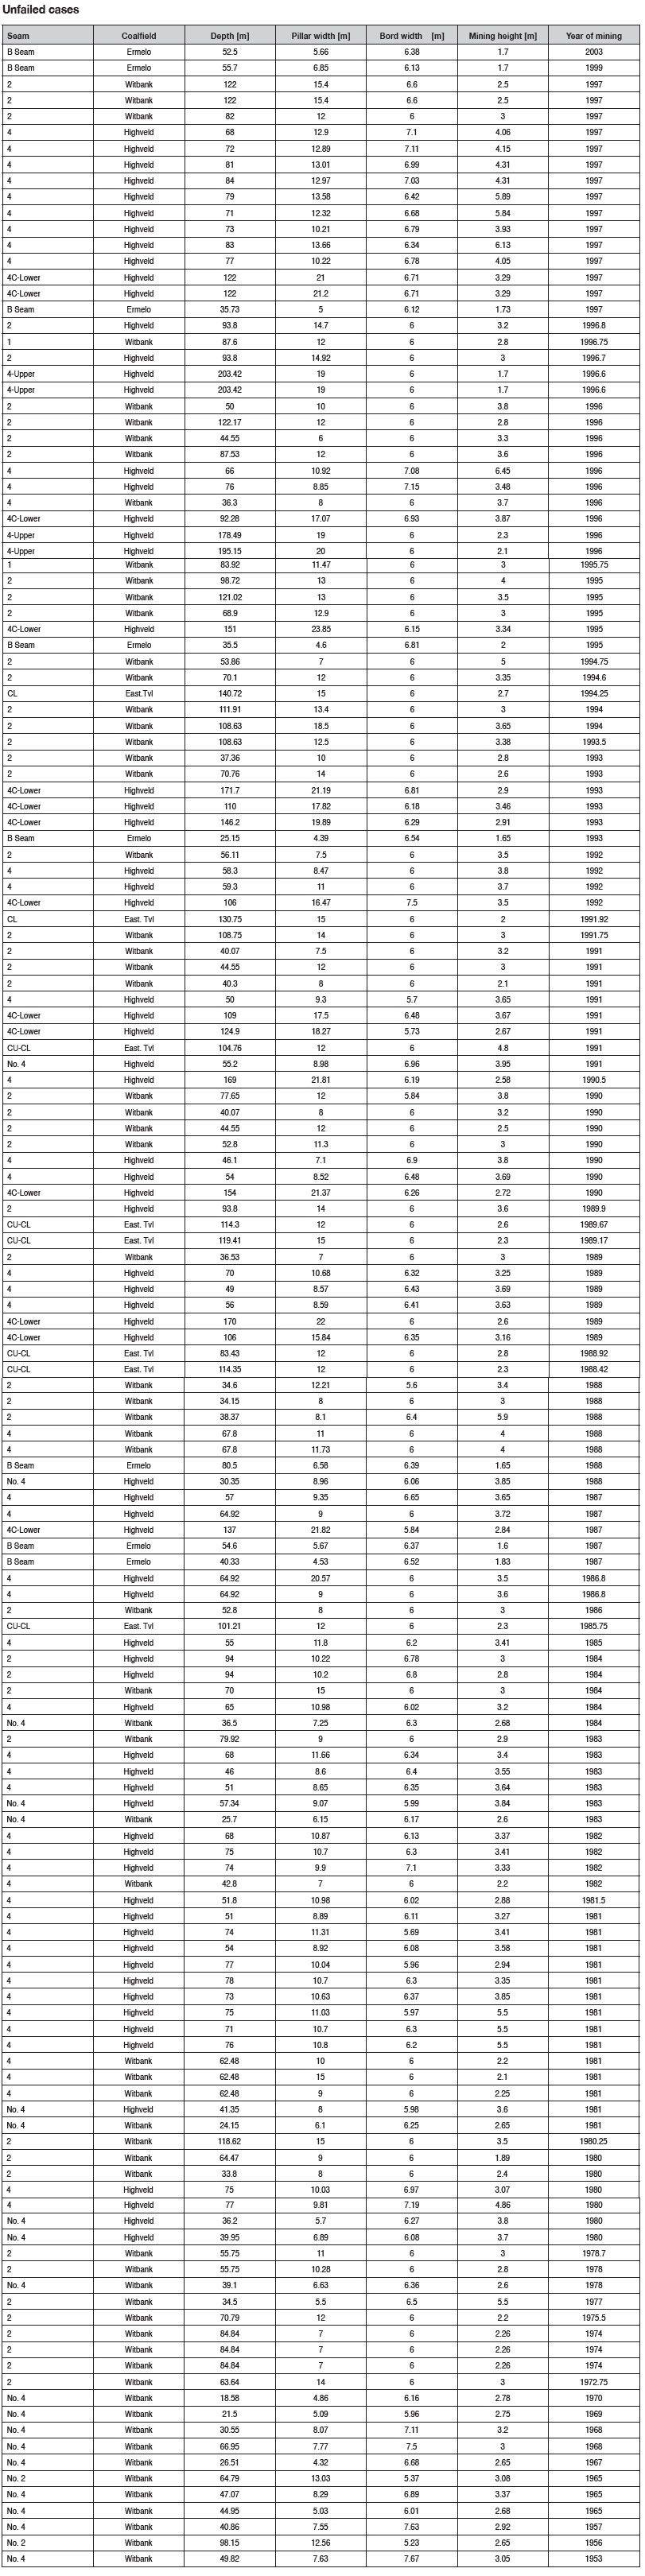
The databases
As statistical procedures were used, it is important to describe the databases. The first filter that was applied to the full databases of failed and unfailed cases, as recorded in van der Merwe and Mathey (2013b), was to eliminate all but the Witbank and Highveld no. 2 and 4 seams. From those two remaining collections only those with recorded dates of mining (and failure for the failed database) could be used. This resulted in substantial reduction of the databases.
The database of failed cases then contained 32 cases and the sample database of unfailed cases, 157. This was considered to be sufficient for statistical analysis. The resulting database is contained in the Appendix.
Creating the database for the full population of unfailed cases, which is required to determine the probability of failure, was more challenging. The method described in van der Merwe and Mathey (2013c) was based on firstly estimating the total coal production over time in South Africa using the bord and pillar method. The average extraction ratio was then determined and this resulted in an estimate of the total number of pillars left in situ. The next step was to estimate the number of 'panels' by determining the average number of pillars in a panel by simply counting the pillars in typical panels on a number of sample mines. Note that for this investigation, the concept of 'panel units' was used instead of counting pillars on selected mines. At all stages in the previous investigation the average numbers were used.
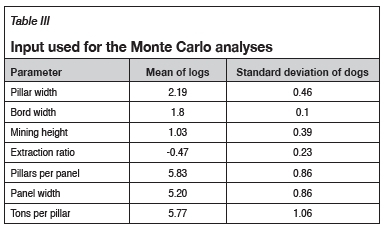
For this investigation the same basic procedure was used, but given that using average values, especially for lognormal distributions, can result in skewed outcomes, statistically more reliable methods were used. All the variables were subjected to a series of Monte Carlo analyses. The statistical parameters for each were determined from the combined sample databases, since at the time of mining it was not known whether the pillars would fail. For all cases the natural logarithms were used since the distributions were lognormal in nature. Table III summarizes the input values.
The total tons left underground in the form of pillars, TL, was found by
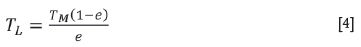
where e = extraction ratio
TM= total tons mined.
The total number of pillars left, Ppis then TLdivided by the average tons per pillar, based on the distributions of the two items. The number of pillars per panel, PPis found by
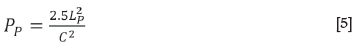
where LPis the panel width and C is the pillar centre distance.
Finally, the number of panel units, NP, is simply PT/PP.
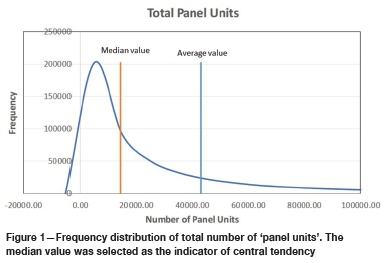
The final outcome was that a total of 14 500 panel units, based on the median of the resulting lognormal distribution (Figure 1), are likely in existence. The full database contained 65% of all cases in the Witbank and Highveld no. 2 and 4 seams, and this then resulted in the final estimate of 9 400 panel units for the purposes of determining the probability of failure, as described later.
Pillar strength analysis
It has to be emphasized that in this and following sections, all analyses are based on the reduced pillar sizes and comparisons with previous results should be made with great caution.
From van der Merwe (2016) the amount of scaling by which pillar width is reduced, dT, after a time T, is:

where h = mining height (m)
m = constant, 0.1799
x = constant, 0.7549
T = age of pillars (years).
At any given point in time the reduced pillar width, wT, is then

where w0is the as-mined pillar width.
Equations [6] and [7] were then applied to the pillars in the databases. For the failed database, the ages of the pillars at the time of collapse were used. For the unfailed database, the year 2012 was used as the base since the database was set up in 2012.
The pillar strength was determined by using the OR method, described in van der Merwe and Mathey (2013a). In essence, the values for the parameters α and β are found by iteration to result in the combination that displays the smallest overlap between the frequency distributions of the logarithms of the failed and unfailed cases. Figure 2 is a contour plot of the areas of overlap for the final round of iterations. It was seen that α = 0.74 and β = 0.85 were the optimal values. It was then found that kT= 10.2 MPa satisfied the criterion that the median of the SF of failed cases should be unity. It is important to note that the material strength constant, k, is in the same range as that found by the direct strength tests (Table I) for which the dimensions at the time of failure were exactly known.
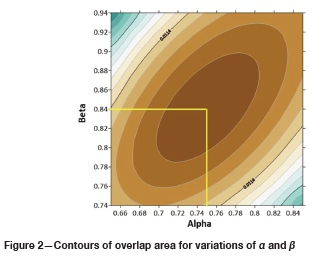
Figure 3 shows the normalized frequency distributions of the logs of the safety factors in the failed and unfailed databases for the previous strength equation as well as the one found in this investigation, indicating the areas of overlap.
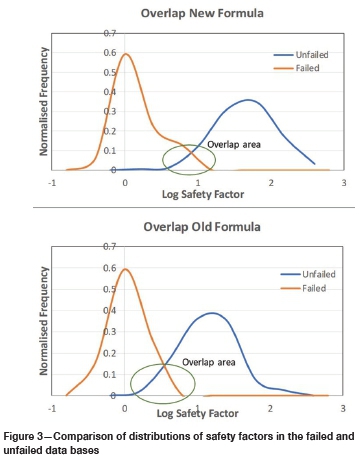
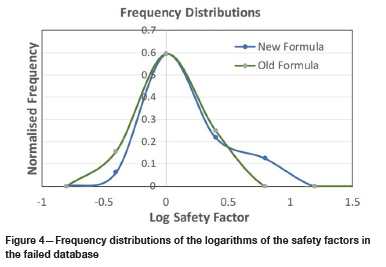
The σ-value (standard deviation of the logarithms of SF) is 0.34, which indicates a wider scatter of the SF than with previous investigations. The frequency distributions of the logarithms of the safety factors in the failed database are shown in Figure 4. Note that for the OR method, separation of the databases is the more important criterion. The overlap area between the databases was reduced by 8% compared to the previous investigation (see van der Merwe and Mathey, 2013a).
The equation for pillar strength, which now incorporates the effects of time, is then as follows:
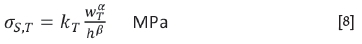
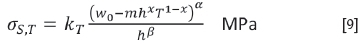
In the expanded form the full equation can be written as
Note that the pillar load to be used in conjunction with Equation [3] for the determination of the safety factor, should also be based on the reduced pillar width. The load is then expressed by
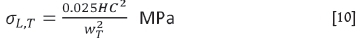
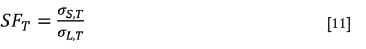
where H is the depth to the floor of mining and C is the pillar centre distance, which is not affected by time. The safety factor at any given point in time is then
Comparison with other pillar strength equations
Figure 5 shows a comparison with other equations for pillar strength. To facilitate comparison, the strength as obtained with Equation [4] was taken at time zero, i.e. the as-mined pillar sizes before scaling had taken place was used. The equations selected for comparison are from Wagner (1974), van Heerden (1975), Salamon, Canbulat, and Ryder (2006), and van der Merwe and Mathey (2013a). The mining height used for the comparison was 3.2 m.
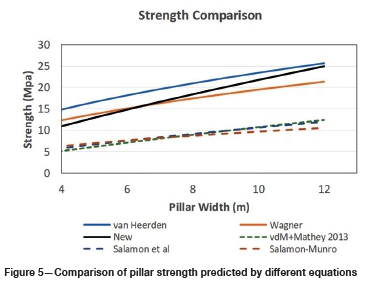
The figure clearly shows two distinct groups of curves. The group comprising Salamon, Canbulat, and Ryder (2006) and van der Merwe and Mathey (2013a) predicts significantly lower strength than the group comprising Wagner (1974), van Heerden (1975), and the proposed strength based on Equation [4].
The most significant difference between the two groups is that for the latter group the actual pillar strength at the time of failure was used in the derivation, while for the former group there was no allowance made for the reduction in pillar width. It is considered significant that the statistical back-analysis based on reduced pillar width at the time of failure is in close agreement with the large-scale direct strength tests.
The implication of this finding is that coal pillars are significantly stronger than predicted by the equations currently in use, but that the strength reduces over time as the pillar width decreases.
Probability of failure
It is well known that the probability of failure is a more rational indicator of pillar stability than the safety factor.
The best way to determine the probability of failure is to compare the number of failed cases in the database to the total number of cases in each interval of safety factor. The full population of the unfailed cases was found by extending the sample database by the ratio of the total number of panel units to the number of recorded cases in the sample database.
For this investigation this proved to be a problem since there was a scarcity of recorded cases in the important part of the distributions, which is the overlap area between the databases of failed and unfailed cases.
The problem was overcome by creating idealized numbers of failed and unfailed cases from the lognormal distributions of those databases. Table IV contains the characteristics of the databases of failed and unfailed cases.
The final result is shown in Figure 6, the probability of failure as a function of the safety factor. The resulting equation is:
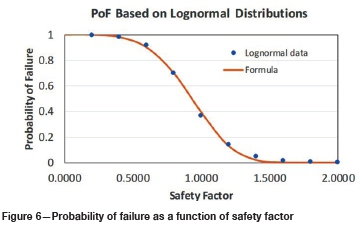
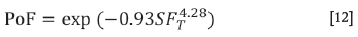
According to Equation [12], the PoF has a value of 0.5 at a safety factor of 0.93, which is close to the statistical expectationof 1.0.
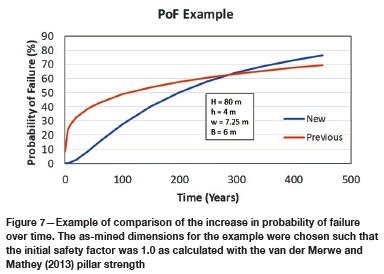
Equation [12] should not be confused with the equation given for probability of failure in van der Merwe and Mathey (2013c). That equation was based on the as-mined pillar dimensions and does not include the effect of time on pillar sizes. Equation [12], in contrast, is based on the ever-reducing pillar width due to ongoing pillar scaling. It therefore results in the probability of failure at any given point in time. The probability of failure increases over time as the pillar width reduces.
This aspect has been addressed in van der Merwe (2016), but the time-related decay in strength in that publication was based on the strength derived from the as-mined pillar sizes. Figure 7 is an example comparing the previous increase in probability of failure with that obtained from this analysis.
Impact on pillar life index
With the new equation for pillar strength and the more realistic value of safety factor at the point where a failure probability of 50% is reached, the equations for the critical scaling distance had to be adapted. This will have a downstream effect on the pillar life index as reported by van der Merwe (2016).
Following the same line of argument as in van der Merwe (2016), the new equation for the critical scaling distance should calculate the scaling distance that will result in a failure probability of 50%, which implies a safety factor of 0.93. The equation which is then derived from Equations [9] and [10] and with substitution of α = 0.74, β = 0.85, and kT= 10.2 MPa is:

The other equations will remain the same, repeated here for convenience. The pillar life index, PLI, is:
where m = constant, 0.1799
x = constant, 0.7549.
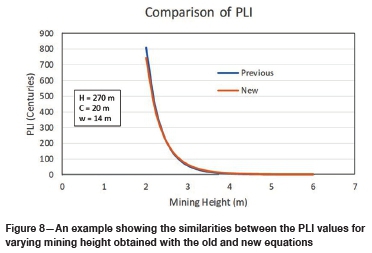
The PLI values with the new equation are not substantially different from the ones obtained with the previous equation, see Figure 8 for a comparison.
Number of pillar failures
There is no direct way to compare the expected number of pillar failures with the actual failures, because none of the equations predict definite failure, only the probability of it occurring. However, as a very rough estimate, it could be expected that over a period of time and with a sufficiently large database, it may not be unreasonable to expect that half of the pillars with a failure probability of more than 0.5 would have failed. This means that there is an expectation that if the pro rata number of cases with failure probability greater than 0.5 in the combined database of failed and unfailed cases is extended to half of the number of panel units currently in existence to account for the age of the database, there should be some resemblance with the actual number of failures.
On that basis, the following was found:
> Salamon and Munro's equations predicted 149 failures
> The van der Merwe and Matthey equations, after adjusting for pillar scaling, predicted 261 failures
> The equations in this paper also predicted 149 failures.
The actual number of recorded failures in the Witbank and Highveld coalfields was 45, indicating that all three the methods over-estimate the number of failures. This conclusion should be viewed with caution as the method of derivation described above relies on very broad estimates. It should also be borne in mind that pillar failures are rare events (45 recorded cases out of 9 400 panel units) and if, for instance, the assumptions on which the calculation of panel units change only slightly, the predicted outcomes would be different. The only meaningful conclusion that can be reached in this respect is that the equations, as well as reality, indicate that pillar failures are rare events.
Conclusions
Research to find the most suitable way of evaluating coal pillar strength has been ongoing in South Africa since the Coalbrook collapse of 1960. Initially there were two main methods of determination; namely direct strength tests performed on large specimens underground and statistical back-analysis based on recorded cases of pillar failure.
Statistical back-analysis, pioneered by Salamon and Munro (1967), proved to be the preferred method and direct strength tests were not used, or even referred to, for several decades.
The realization that coal pillars scale over time revealed an important disadvantage of the statistical methods as applied previously, namely that the pillar sizes used for the analyses were not correct. Only the as-mined dimensions could be used as the actual pillar sizes at the time of collapse could not be established. By contrast, the actual pillar sizes for the direct tests were known and used.
The real pillars at the time of failure were in fact smaller than the as-mined dimensions used for the statistical analyses.
Therefore, the resulting equations for strength predicted lower values because the pillar sizes used for the analyses were greater than they actually were.
The quantification of the rate of pillar scaling opened the possibility to estimate the pillar sizes at the time of failure. In this investigation, the reduction in pillar size, based on the rates of pillar scaling, was used in the statistical analysis.
The result was that greater pillar strengths than previously determined with the statistical back-analyses were found. Furthermore, the predicted strengths corresponded more to the initial in-situ tests than they did to the previous statistical analyses. This correspondence between the in-situ tests and the statistical back-analysis based on expected pillar sizes at the time of failure is seen as confirmation that the approach used in this investigation is correct.
The probability of failure, based on the expected real pillar sizes, is linked to the safety factor. It is also shown that now, the safety factor at a 50% probability of failure is very close to the statistical expectation of 1.0. This finding overcomes the apparent anomaly in previous publications, where the safety factor at a probability of failure of 50% is significantly lower.
It is also indicated that the pillar strength reduces and the probability of failure increases over time. The previous considerations were all based on the inherent assumption that pillar sizes are static and do not reduce over time - which is incorrect.
It should always be borne in mind in investigations of this nature that far fewer than 1% (estimates range between 0.3% and 0.5%) of all pillars have failed. The pillar strength and the probability of failure are based on this very small part of the overall database. The data is not perfect and some degree of scatter will always be present in the outcomes. However, it is held that incremental improvement is better than delayed perfection, and the industry can only use the best information available.
In this light, it is recommended that similar analyses be repeated at suitable time intervals, to be determined when new insights into pillar mechanics, better methods of analysis, and more data become available. Pillar stability is not a static consideration and neither should the procedures used for evaluation be. There has to be a process of continual renewal.
References
Madden, B.J. and Hardman, D.R. 1992. Long term stability of bord and pillar workings. Proceedings of Construction Over Mined Areas, the 5th Conference of the South African Institute of Civil Engineering. [ Links ]
Salamon, M.D.G. and Munro, A.H. 1967. A study of the strength of coal pillars. Journal of the South African Institute of Mining and Metallurgy, vol. 68, no. 2. pp. 55-67. [ Links ],
Salamon, M.D.G., Canbuiat, I., and Ryder, J.A. 2006. Development of seam-specific strength formulae for South African collieries. Final Report Task 2.16, Coaltech2020. Coaltech, Johannesburg. [ Links ]
Van der Merwe, J.N. 1993. Revised strength factor for coal in the Vaal Basin. Journal of the South African Institute of Mining and Metallurgy, vol. 93, no. 3. pp. 71-77. [ Links ]
Van der Merwe, J.N. 2003. A new coal pillar strength formula for South Africa. Journal of the South African Institute of Mining and Metallurgy, vol. 103, no. 5. pp. 281-292. [ Links ]
Van der Merwe, J.N. and Mathey, M. 2013a. Update of coal pillar strength formulae for South African coal using two methods of analysis. Journal of the Southern African Institute of Mining and Metallurgy, vol. 113, no. 11. pp. 841-847. [ Links ]
Van der Merwe, J.N. and Mathey, M. 2013b. Update of coal pillar database for South African coal mining. Journal of the Southern African Institute of Mining and Metallurgy, vol. 113, no. 11. pp. 825-840. [ Links ]
Van der Merwe, J.N. and Mathey, M. 2013c. Probability of failure of South African coal pillars. Journal of the Southern African Institute of Mining and Metallurgy, vol. 113, no. 11. pp. 849-857. [ Links ]
Van der Merwe, J.N. 2016. Review of coal pillar lifespan prediction for the Witbank and Highveld coal seams. Journal of the Southern African Institute of Mining and Metallurgy, vol. 116, no. 11. http://dx.doi.org/10.17159/2411-9717/2016/v116n11a11 [ Links ]
Van Heerden, W.L. 1975 In situ complete stress-strain characteristics of large coal specimens. Journal of the South African Institute of Mining and Metallurgy, March 1975. pp. 207-217 [ Links ]
Wagner, H. 1974. Determination of the complete load-deformation characteristics of coal pillars. Proceedings of the 3rd Congress of the International Society for Rock Mechanics, Denver, CO. Vol. 2. pp. 1076-1081. [ Links ]
 Correspondence:
J.N. van der Merwe
nielen@stablestata.co.za
Received: 8 Jan. 2019
Revised: 14 Apr. 2019
Accepted: 25 Apr. 2019
Published: July 2019
Appendix. Data Bases of failed and unfailed cases