


Services on Demand
Article
 English (pdf)
 Article in xml format
 Article references
Indicators

Related links
-
 Cited by Google
 -
 Similars in Google
Share

 Permalink
Journal of the Southern African Institute of Mining and Metallurgy
On-line version ISSN 2411-9717
Print version ISSN 2225-6253
J. S. Afr. Inst. Min. Metall. vol.119 n.7 Johannesburg Jul. 2019
http://dx.doi.org/10.17159/2411-9717/494/2019
STUDENT PAPERS
Determination of optimal fragmentation curves for a surface diamond mine
K.M. Phamotse*; A.S. Nhleko
School of Mining Engineering, University of the Witwatersrand, South Africa
SYNOPSIS
Liqhobong Mining Development Company (LMDC) has been experiencing problems with boulders after blasting where the fragment sizes exceed the maximum of 800 mm as per mine standard. As a result, the mine has employed various methods to improve the fragmentation. The goal is to produce a run-of-mine (ROM) feed that does not choke the crusher and cause delays in production. In order to achieve this goal, fragmentation distribution within the fines and coarse envelope must be optimized through effective planning of blasting activities and accurate execution.
The mine determined the fines-coarse envelope within which the entire crushing system can handle fragments using Split Desktop software. It is expected that both the predicted and actual fragmentation curves lie within that envelope for optimal fragmentation. The Kuz-Ram model with blast design parameters of 2.6 m for burden, 2.8 m for spacing, and 127 mm hole diameter was used to predict the fragmentation. The results show that the blast design parameters may need altering to achieve optimum fragmentation. Furthermore, the execution of the drilling and blasting may be the cause of the fragmentation problems. The mean fragmentation size (X50) differs greatly, unlike the uniformity index (n)s values which are relatively close to each other (0.6 to 2.2). The mean squared error (MSE) values have a large range. A proposed solution is a modified burden, spacing, and hole diameter. It is concluded that blast design parameters need to be reviewed in order to obtain correct predictions.
Keywords: fragmentation analysis, blasting, Kuz-Ram model, open pit mining, particle size distribution.
Introduction
Fragmentation has an impact on the mine production cycle which comprises, inter alia, drilling, blasting, loading, hauling, and crushing. Correct fragmentation as set by the plant design is important as it reduces the time lost due to secondary blasting and/or loading difficulties. In this paper we analyse blast results at Liqhobong Mining Development Company (LMDC) in Lesotho for a period of six months. This project was undertaken to observe the trends from the blasts and to identify whether any discrepancies exist in the overall blast information. The period under study included 16 blasts.
There are both controllable and uncontrollable factors that affect fragmentation. The controllable factors are blast design parameters such as burden, spacing, hole diameter, stemming length, and initiation timing. The uncontrollable factors are rock properties such as uniaxial compressive strength (UCS) and geological discontinuities within the rock mass. The mine's requirement is that blasted fragments do not exceed 800 mm. However, the mine was not able to meet the desired fragmentation profile. Various principles have been adopted to address this challenge by modifying the blast design parameters, such as use of rules of thumb and the Kuz-Ram model.
At LMDC, fragmentation distribution has been a problem since mining began in 2017. This was evident in the fact that, after blasting, there were rocks larger than 800 mm (the maximum size on the feed grizzly). This was addressed by employing a predictive model for fragmentation (the Kuz-Ram model), which revealed some flaws since the prediction still exceeded the designed fines-coarse envelope for the mine. The flaws were, however, not taken into account in anticipation that the prediction would match the actual fragmentation results obtained using Split Desktop software.
For drilling and blasting design purposes, 'rules of thumb' are normally used but at LMDC they were not effective. Therefore, it was important to derive a solution to achieve optimal fragmentation as this would reduce delays in the mine production cycle.
Mining method
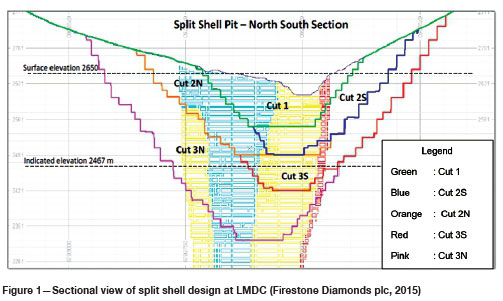
The mine employs a conventional open-pit mining method consisting of drill, blast, load, and haul phases. The pit design is based on a split shell concept in order to prolong waste stripping as much as possible while providing a double ramp system to mitigate the risk of failing ramps. The ore is mined by five split shells, namely: cut 1, cut 2 north, cut 2 south, cut 3 north, and cut 3 south (Figure 1). Every split shell has its own ramp system, but where the north cut meets the south cut the ramps will join to form a concentric system. Figure 1 depicts a sectional view of the different mining cuts. Cut 1 is currently being mined.
Problem statement
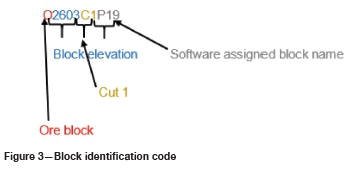
The mine was experiencing problems due to post-blast fragments greater than 800 mm, considered as 'boulders' based on processing plant requirements. The generation of boulders results in production delays, since the boulders need to be reduced in size using a mechanical rock-breaker. The mine predicts fragmentation using the Kuz-Ram fragmentation model, which is a commonly used method to predict blast fragmentation (Cunningham, 2005; Strelec, Gazdek, and Mesek, 2011; Adebola, Ajayi, and Elijah, 2016; Gheibi, et al., 2009). However, the data from the Kuz-Ram analysis is not recorded for every blast. Prior to the generation of boulders, the mine did not develop prediction models for every blast as it was assumed that the blast design parameters were appropriate, on the basis of trial blasts. Nevertheless, the mine attempts to predict fragmentation correctly within the fines-coarse envelope as per the plant design. The fines-coarse envelope was determined by the use of particle size distribution (PSD) during trial blasts to determine how the kimberlite at the mine responded to crushing. The fines-coarse envelope is a result of the extremities of the particle size distribution curves that were smoothed out, which resulted in two curves. The mine found a positive correlation between the predicted and the actual fragmentation curves. The inability to predict fragmentation correctly may be attributed to the use of estimated parameters such rock density, UCS, and rock mass description (RMD). Even though these parameters are used to determine the rock factor, 'A', at LMDC there is no constant 'A' factor used. The 'A' factor is recalculated for every blast prediction. Other features that affect the 'A' factor are the joint plane spacing (JPS) and joint plane orientation (JPO), which are determined visually by the responsible person on duty. Thus, the values obtained may differ as the determination of JPO and JPS is subjective. This may introduce discrepancies to the input data, depending on the experience of the observer. Furthermore, the UCS values for the different kimberlite types are assumed to be uniform across the mine. Figure 2 shows an example of fragmentation curves that are used to analyse how fine or coarse blasted material is for an ore block. The block is assigned a code as shown in Figure 3 where, for example, O2603C1P19 is read as the elevation of 2603 m above mean sea level, cut 1, block number P19.
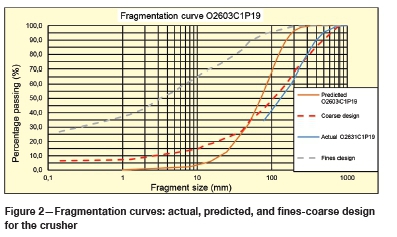
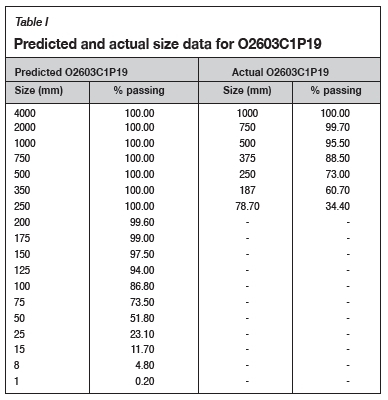
The Kuz-Ram fragmentation model is used to predict fragmentation size distribution. It is important to note that on the graph, fragment sizes range from 0.1 mm to 1000 mm. This does not limit the predicted and actual fragment sizes to the graph constraints. This is shown in Table I, with size fragments in millimetres and percentage passing data for O2603C1P19 of up to 4000 mm.
Crusher design fragmentation results are shown in Figure 2 as an envelope formed by fines design and coarse design curves developed by the use of PSD. Therefore, if the predicted and actual fragmentation curves fall within the fines-coarse envelope this indicates that the ideal/desired fragmentation profile is achieved. The actual and predicted fragmentation curves shown in Figure 2 do not fit into the fines-coarse envelope. Both the actual and predicted curves are closer to the coarse side, hence there is a greater probability of boulders forming. It is important to note that the values shown in Figure 2 may exceed the maximum values on the graph as shown in Table I. This raises the question 'Will the analysis of previous blast information correctly predict an optimal fragmentation curve?
Objectives
The objectives of this research study were to:
> Use descriptive statistics to analyse data based on previous actual and predicted fragmentation curves
> Identify controllable blast design parameters that affect the shape of predicted fragmentation curves
> Fit fragmentation curves within the fines and coarse design curves so as to deem them 'ideal' for the crusher.
Literature review
The orebody and rock conditions at every mine are unique, therefore, each mine should have tailored solutions to allow for optimal orebody extraction. Fragmentation control is a challenging task since there are many parameters to take into account, which include rock structure, burden, spacing, hole diameter, bench height, and initiation timing. The challenges are caused by the fact that rock is generally neither homogeneous nor isotropic. For the purposes of this study, we analyse only the factors that cause deviations between planned and actual blast design parameters. This investigation was conducted through image analysis, the Kuz-Ram fragmentation model, and descriptive statistics.
Background to fragmentation models developed
Many researchers have successfully managed to derive solutions on how to design drilling and blasting parameters that will result in optimum fragmentation. In 1933, Rosin and Rammler developed a model to predict particle size distribution during blasting, known as the Rosin-Rammler particle size distribution model (Vesilind, 1980). The Rosin-Rammler distribution is identical to the Weibull density distribution that describes material failure and fatigue phenomena (Alderliesten, 2013). This size distribution has been very important in rock fragmentation studies as it outlines size distribution as a percentage passing curve. Spathis (2013) conducted a study on a three-parameter rock fragmentation distribution, which is developed under the Swebrec function. The model acts as a fit for measured mass percentage passing distributions along with the Weibull (Rosin-Rammler) distribution that is exemplified in the Kuz-Ram model (Spathis, 2013). This three-parameter model has the added advantage of fitting the fines region on cumulative mass percentage passing curves for fragmentation (Spathis, 2013). Cunningham (2005) developed the widely used Kuz-Ram fragmentation model. This model is a combination of Kuznetov's empirical equation and the Rosin-Rammler size distribution model. Gonzalez and Montoro (1993) developed image analysis software, based on the Kuz-Ram fragmentation model, to analyse fragmentation of blasted material by measuring the spatial relationship between fragmented material and the actual size of the fragmented material.
Kuz-Ram fragmentation model
The Kuz-Ram model provides a technique to predict the distribution of fragments in terms of the percentage mass passing through a grizzly screen. This is done by using mathematical equations developed by Cunningham, using Kuznetsov's empirical equation and the Rossin-Ramler distribution, to quantify fragmented rock. There are limitations to the Kuz-Ram fragmentation model as it is an empirical way to predict fragmentation. These limitations are that there are parameters that not taken into account, the measurement of fragmentation is limited, and it is challenging to scale blasting effects (Cunningham, 2005). These limitations may make it difficult to accurately determine what is to be seen in a practical sense. Another major limitation with the Kuz-Ram fragmentation model is that it is heavily dependent on the Rossin-Rammler equation, which underestimates fines (Ouchterlony, Sanchidrian, and Moser, 2016). This is further proof that the Kuz-Ram model may not be representative of what happens in reality. Equation [1] denotes the formula for determining mean fragmentation size (X50) developed by Kuznetsov in 1973. The mean fragmentation size is simply an estimate that gives an overview of the outcome resulting from blast design parameters for an operative prediction process (Adebola, Ajayi, and Elijah, 2016).
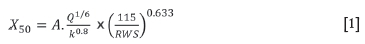
where
X50: Mean fragment size (cm)
RWS: Relative weight strength
K: Powder factor (specific charge - above grade) in (kg/m3)
A: Rock factor.
The uniformity index (n) is used to determine how even the breakage of rock is expected to be, based mainly on parameters employed during drilling (Cunningham, 2005). Equation [2] shows how the uniformity index is calculated. The uniformity index indicates the uniformity of the fragment sizes and ranges between 0.6 and 2.2 for a well fragmented blast (Adebola, Ajayi, and Elijah, 2016).

where
B: Burden (m)
D: Hole diameter (mm)
S: Spacing (m)
W: Standard deviation of drilling accuracy (m)
L: Total length of drilled hole (m)
H: Bench height (m).
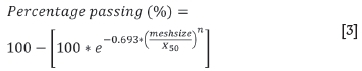
Then, using the uniformity index (n) and mean fragment size [X50] the percentage passing can be determined using Equation [3] (Adebola, Ajayi, and Elijah, 2016):
Descriptive statistics
Descriptive statistics are used to describe the key features of data in a study. Descriptive statistics are also used to summarize large data-sets in order to make an informed analysis. They include the mean, mode, median, skewness, and kurtosis of a data-set. In this paper, descriptive statistics are used to obtain an in-depth analysis of fragmentation results. The descriptive statistics that were necessary to finding a solution to the mine's problem are the mean, median, mode, range, standard deviation, variance, and box-and-whisker plot.
Box-and-whisker plots (box plots)
The box plot is a five-number summary comprising the minimum, first quartile (Oj), median, third quartile (O3), and maximum values. Box plots aid in understanding the characteristics of data distribution and the level of the distribution of the values from the data. The data is organized into a box and two lines referred to as whiskers.
Estimators
Estimators are used in statistics as a measure of efficiency. There are two main estimators used; the bias and the mean squared error (MSE). The bias is described as the difference between the average value of the estimator and the actual or true value (the mean of the true value). The standard error is simply an estimator of the standard deviation (Holton, 2014). The MSE combines the concepts of bias and the standard error. Ideally, a MSE should be close to zero, implying that there is a good fit of data. In other words, the smaller the MSE value, the closer the fit is to the data. To calculate the MSE, Equation [4] is used (Holton, 2014).

where
E: Estimator
H: Standard error
θ: Bias.
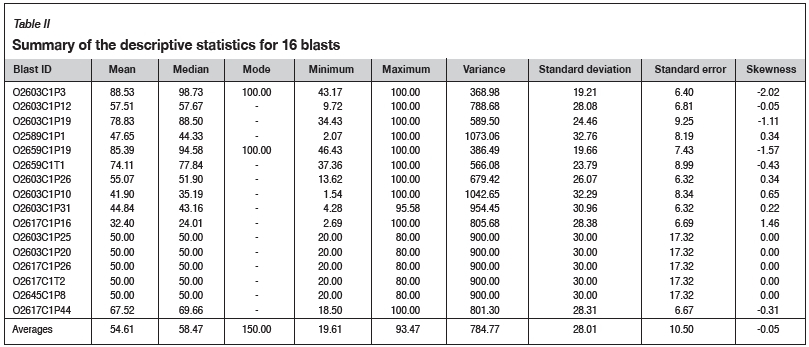
Results and analysis
Table II summarizes the descriptive statistics obtained for all 16 blast results analysed on the fragmentation size distribution. The reason for collecting 16 sets of data was to make an informed decision on the trends in the behaviour of blasted rock. Three classes of data are analysed, namely:
> Comparison of ideal and actual fragmentation with skewness of zero
> Comparison of ideal and actual fragmentation with different skewness values
> Comparison of predicted and actual fragmentation.
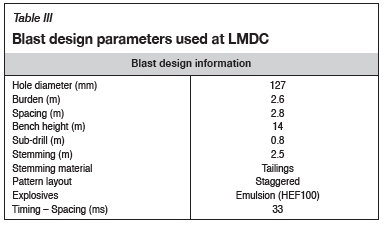
These classes arose because the mine initially used trial and error to design blasts, and later adopted the Kuz-Ram fragmentation model to predict blasts outcomes in terms of fragmentation size distribution. The 'ideal', predicted, and actual curves are all expected to fit within the fines-coarse envelope as per the plant design and crushing capabilities. Table III shows the blast design parameters that are used at the mine and which are used as input parameters for the Kuz-Ram fragmentation model.
Comparison of ideal and actual fragmentation with skewness of zero
This class of data has only three data-sets recorded for the actual blast. Therefore, it is expected that the results may be inaccurate because the fewer the data-points, the less accurate the results will be. This data recorded a skewness of zero and the mean and median values were the same. Identical mean and median values could imply that the fragments are distributed normally; however, this could be incorrect as there is no mode to confirm that. The skewness of zero implies that the data is a normal distribution even though this is not true. given that the data contains only three points. The results from this data-set cannot be regarded as a true representation of the fragmentation distribution.
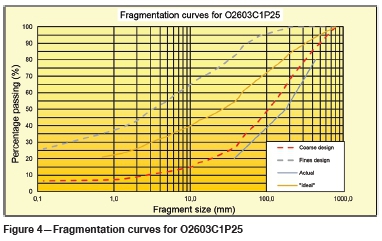
Blast ID O2603C1P25
The size fragments fall within the mine standards of a minimum of 0.1 mm and a maximum of 1000 mm. These extremes are put in place even though the lowest crushing size is 10 mm and the largest grizzly at the run of mine (ROM) tip is 800 mm, as 1000 mm is manageable by a rock-breaker (pecker) and 0.1 mm diamonds can still be recovered if they are of gem quality. The percentage passing values are determined from the graphs as 20% smaller than 37.54, 50% at 178.15 mm or less, and 80% at 437.87 mm or less. All the fragments pass through the 800 mm grizzly, signifying an absence of boulders for this specific blast. However, the problem is the fact that the size fragments do not fall within the crusher fines-coarse design.
Figure 4 shows the data plotted using a logarithmic (log) scale. A log scale was used because it tends to respond well to skewness near large values and shows the percentage well (Robbins, 2013). The 'ideal' curve on the graph was calculated using the midpoints of the fines and coarse envelope to determine, on average, the 'ideal' fragmentation curve that is to be expected. The predicted curve was obtained using the Kuz-Ram fragmentation model and the actual curve data was obtained photographically by the use of Split Desktop software. The bias for the data is 1.08, which yields a MSE of 301.15. The large positive MSE indicates a difference between the actual and 'ideal' curves. The large MSE value might be due to the fact that the 'ideal' and actual curves have different ranges of 78.95 and 60.00 respectively for their percentage passing values. This causes inaccuracies in the analysis of the data.
Comparison of ideal and actual fragmentation with different skewness values
These results have more than three data-points for the actual blast results, which is expected to yield a more accurate representation of the fragmentation. Blast identity O2603C1P31 is analysed.
Blast ID O2603C1P31
The fragments do not lie within the acceptable size range of 0.1 mm-1000 mm. The data is further analysed in Figure 5 to ascertain if it fits within the fines-coarse envelope.
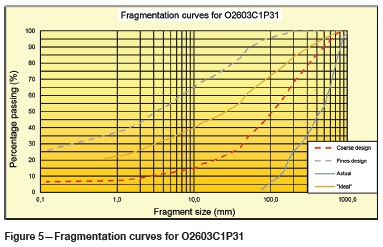
In Figure 5, there are values that extend beyond the fragment size of 1000 mm for the 'ideal' curve, although the upper limit shown on the curve is 1000 mm. This means that some data is missing from the graph and this may cause inaccurate results. At 80% percentage passing, fragments less than 500 mm passed through. At 50% passing, fragments less than 200 mm passed through and at 20%, fragments less than 50 mm. The bias for the data-set is 6.17, which yields a MSE of 78.11. The skewness is 0.22, hence the data-set is positively skewed. The value of the MSE is large in this case as a result of the large bias, thus the bias was over-estimated. The actual curve strays further away from the coarse curve, indicating that boulders are present.
Comparison of predicted and actual fragmentation
For this class of data, the predicted curves that were plotted using the Kuz-Ram fragmentation model and actual fragmentation profile are comparable. Since the Kuz-Ram fragmentation model was used, the X50and n values are shown, calculated using Equations [1] and [2], respectively. These two values are critical as they are the main input values when calculating percentage passing using Equation [3].
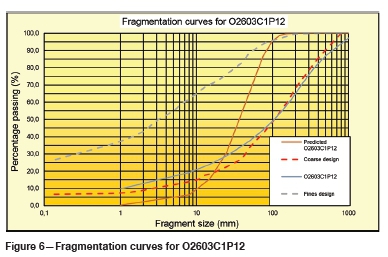
Blast ID O2603C1P12
The prediction shows a range of sizes from 1 mm to 4000 mm and the actual data a range from 1 mm to 2000 mm. For both data-sets, the size fragments indicate the presence of boulders. The predicted data indicates a mean size of 47.7 mm and a uniformity index of 1.54. At 80%, 50%, and 20% passing, fragments less than 75 mm, 50 mm, and 25 mm passed through, respectively. The uniformity index lies within the acceptable range of 0.6 and 2.2.
The predicted curve in Figure 6 is flat at the beginning, denoting 100% passing from 200 mm to 4000 mm. It is important to note that the predicted curve does not lie entirely within the fines-coarse envelope. The reason for the top falling outside the envelope is the very large fragment sizes that are predicted. The actual curve lies within the fines-coarse envelope for smaller fragments, but outside it for the larger fragments, which could be due to the powder factor of 1.76 kg/m3. This introduces the impact/effect of the explosives utilized on the profile of the rock blasted. It is important to note that the rock properties value used in the prediction parameters was an average value for the whole mine, therefore it may not be an accurate representation of the true rock properties in the blast area. The bias for the data-set is 19.44, which yields a MSE of 443.98. The data-set is negatively skewed (skewness is -0.05). The value of the MSE is large as a result of a large bias, thus the bias was over-estimated.
Box-and-whisker plots
Box-and-whisker plots were constructed for each blast to determine the spread of the percentage passing. For this analysis, pure descriptive statistics are used. The data analysed is for the actual fragments in order to determine how the fragments were spread out.
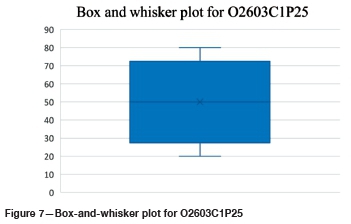
Blast ID O2603C1P25
In Figure 7, both the upper quartile and lower quartiles have a difference of 15.00. The data shows an even spread in terms of percentage passing for the fragments. However, this does not mean that the fragments are 'ideal' as the minimum is 20.00 and the maximum is 80.00, which means that the spread of the range of the fragments themselves is not large (it is 60). This value of 60 compared to the median of 50 shows that the data is not as evenly distributed as it seems.
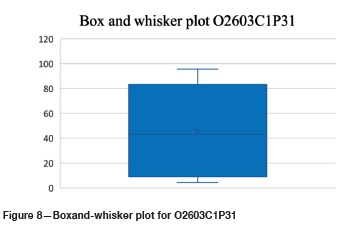
Blast ID O2603C1P31
In Figure 8, the upper quartile and lower quartile have a difference of 24.77 and 9.67 respectively. This difference manifests in two whiskers, the whisker for the upper quartile being twice as long as that for the lower quartile. The long whisker could be an indication that there are very large fragments compared to the rest of the data. This is in addition to the fact that the median is 43.16, indicating that the majority of the fragments fall within the lower 50% of the data but there are more coarse fragments than fine fragments.
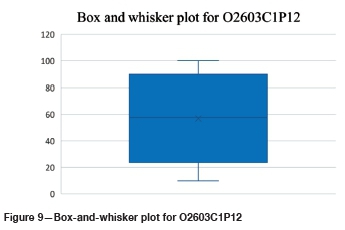
Blast ID O2603C1P12
From Figure 9, the data seems to be relatively evenly distributed. However, the median is 57.67, and the differences between the Q1 and the minimum, and the maximum and Q3 values, are 27.79 and 20.28 respectively. The 7.51 difference between the two values shows that the spread of fragments for this blast is relatively even for the top 50% and the bottom 50% of the data.
Proposed solution
The limitations with the Kuz-Ram fragmentation model have led, in this case, to the determination of a proposed solution where only one parameter can be altered at a time. The focus was mainly on controllable blasting factors as some of the other limitations with the Kuz-Ram fragmentation model would be difficult to surmount. Figure 10 shows a proposed prediction curve and the parameters that were modified to achieve the desired fragmentation results. At 99.70% passing, the graph indicates a size of 200 mm and from thereon 100% passing all the way to 800 mm. At 33.80% passing, the graph indicates a size of 50 mm. The percentage passing less than 33.80% extends beyond the coarse envelope. The difference between the percentage passing within the fines-coarse envelope is 65.90%, with sizes ranging from 200 mm to 800 mm at 100% passing. This is an improved prediction design compared with the current results obtained by the mine. This improved prediction meets the requirements to fit the model into the fines-coarse envelope. It is, however, subject to testing. This improved design was achieved by changing the burden from 2.60 m to 2.80 m and the spacing from 2.80 m to 3.00 m. The spacing to burden ratio was 1.07. This improved design assists the mine in fitting its predicted model into the constraints of the plant design (fines-coarse envelope).

Conclusions
The research study showed that the gap between the predicted and actual curves differs for the same blast, which is the first indication that the desired fragmentation will not be achieved. In cases where no fragmentation curves were drawn, the ranges for the fragments also differ from those that are supposed to fit into the fines-coarse envelope. These discrepancies between what is expected and what actually happens make it difficult to identify the parameters that need to be adjusted to meet the mine standards.
The MSE between the expected and predicted results is large for all the blasts, which means that the drilling and blasting crews do not follow the correct procedures and end up doing what is required in order to complete a blast to schedule.
A slight increase in the powder factor made a difference to the 'actual' curves, which shows that the rock mass to be blasted must be studied thoroughly in order to calculate the correct powder factor. There is no tailor-made solution to designing blasts, but each mine must determine its own blast design parameters by trial and error until the desired result is achieved.
The results from the Kuz-Ram fragmentation model prove further that the explosives used and the rock properties play a significant role in determining how well fragmented the rock will be. The calculation for the mean fragmentation size is strongly dependent on the rock properties which, in this case, may be incorrect due to the subjective (visual) determination of rock properties like the JPO and JPS. The theoretical calculation of the uniformity index, on the other hand, fell within the accepted range for all three blasts. This is dependent on the mine's blast design parameters, which is further proof that the blast design parameters are suited for the mine.
More than two prediction parameters should be used at the mine and there should be quality checks and assurances for the whole process that leads up to rock being fragmented. Furthermore, the mine should keep a good record of blasts. Good record-keeping is important to assist in improving the prediction models and the actual fragmentation curves. The calculations for the predictions should be done well before every single blast in order to be able to identify trends.
References
Adebola, J.M., Ajayi, O.D., and Elijah, O.P. 2016. Rock fragmentation prediction using Kuz-Ram model. Journal of Environment and Earth Science, vol. 6, no. 5. pp. 111-113. https://www.iiste.org/Journals/index.php/JEES/article/download/30610/31442+&cd=1&M=en&ct=clnk&gl=za [accessed 16 March 2018]. [ Links ]
Alderliesten, M. 2013. Mean particle diameters. Part VII. The Rosin-Rammler size distribution: Physical and mathematical properties and relationships to moment-ratio defined mean particle diameters. Particle & Particle Systems Characterisation, vol. 30, no. 3. pp. 244-257. https://onlinelibrary.wiley.com/doi/abs/10.1002/ppsc.201200021 [accessed 16 March 2018]. [ Links ]
Cunningham, C.V.B. 2005. The Kuz-Ram fragmentation model - 20 years on. European Federation of Explosive Engineers, Brighton. https://miningandblasting.files.wordpress.com/2009/09/the-kuz-ram-fragmentation-model-e28093-20-years-on.pdf [accessed 30 April 2018]. [ Links ]
Firestone Diamonds plc. 2015. Diamond Resource and Reserve Report. London. [ Links ]
Gheibi, S., Aghababaei, H., Hoseinie, S.H., and Yashar, P. 2009. Modified Kuz-Ram fragmentation model and its use at the Sungun Copper Mine. International Journal of Rock Mechanics, vol. 46, no. 6. pp. 967-973. https://www.researchgate.net/publication/208032337_Modified_Kuz-Ram_fragmentation_model_and_its_use_at_the_Sungun_Copper_Mine/amp [accessed 28 June 2019]. [ Links ]
Gonzalez, E. and Montoro, J. 1993. New analytical methods to evaluate fragmentation based on image analysis. Rock Fragmentation by Blasting. Balkema, Rossmanith, H. (ed.). Rotterdam. pp. 309-316. [ Links ]
Holton, G.A. 2014. Value-at-Risk: Theory and Practice. 2nd edn. Belmont, Holton, GA. [ Links ]
Ouchterlony, F., Sanchidrian, J., and Moser, P. 2016. Percentile fragment size predictions for blasted rock and the fragmentation-energy fan. Rock Mechanics and Rock Engineering, vol. 50, no. 4. pp. 751-779. https://link.springer.com/article/10.1007/s00603-016-1094-x [accessed 28 June 2019]. [ Links ]
Robbins, N. 2013. Data driven journalism. http://datadrivenjournalism.net/resources/when_should_i_use_logarithmic_scales_in_my_charts_and_graphs [accessed 10 May 2018]. [ Links ]
Spathis, A.T. 2013. A three parameter rock fragmentation distribution. Measurement and Analysis of Blast Fragmentation. Sanchidrián, J.A. and Singh, A.K. (eds.). Taylor & Francis, London. pp. 73-86. [ Links ]
Strelec, S., Gazdek, M., and Mesek, J. 2011. Blasting design for obtaining desired fragmentation. Technical Gazette, vol. 18, no. 1. pp. 79-86. https://hrcak.srce.hr/file/98636&ved=2ahUKEwi2rJWCyJnjAhUa1AKHcPoCHsOFjACegOIAhAB&usg=AOvVaw1E35VnKBOeCCeZwWSs1tHw&cshid=1562185270284 [accessed 8 June 2019]. [ Links ]
vesilind, P.A. 1980. The Rosin-Rammler particle size distribution. Resource Recovery and Conservation. Elsevier, Amsterdam. pp. 275-277. https://www.sciencedirect.com/science/article/pii/0304396780900074 [accessed 10 April 2018]. [ Links ]
 Correspondence:
K.M. Phamotse
kmphamotse@gmail.com
Received: 22 Nov. 2018
Revised: 26 Mar. 2018
Accepted: 5 Sep. 2018
Published: July 2019
* Paper written on project work carried out in partial fulfilment of BSc (Mining Engineering) degree

