


Services on Demand
Article
 English (pdf)
 Article in xml format
 Article references
Indicators

Related links
-
 Cited by Google
 -
 Similars in Google
Share

 Permalink
Journal of the Southern African Institute of Mining and Metallurgy
On-line version ISSN 2411-9717
Print version ISSN 2225-6253
J. S. Afr. Inst. Min. Metall. vol.119 n.5 Johannesburg May. 2019
http://dx.doi.org/10.17159/2411-9717/16/388/2019
PAPERS OF GENERAL INTEREST
An alternative pillar design methodology
R.W.O. Kersten
Rock Mechanics Consultant
SYNOPSIS
The aim was to investigate stable pillar design procedures currently in use on chrome and platinum mines, subject them to a critical appraisal, and review some of the alternatives proposed in the literature. It is concluded that these pillar design methodologies suffer from drawbacks that can be detrimental to the mining industry and that an improvement is essential.
It was decided that the increased availability of analytical models and failure criteria could be exploited to update the empirical to an analytical/empirical method. The proposed methodology adopted FLAC2D simulations using the Hoek-Brown failure criterion to calculate full stress-deformation curves for typical pillars. The mine stiffness concept was introduced to determine the pillar load, integrating the influence of the pillar and strata stiffness and mining geometry.
The proposed methodology was calibrated by comparing experimental and predicted deformations and failure depth of pillars in one hard-rock mine. The conclusion was that the methodology is an improvement over the one currently in use. An improved factor of safety is given by the intersection point of curves for the stiffness of the system and the pillar strength.
Keywords: stable pillar design, failure criteria, analytical model, stress deformation curve, strata stiffness.
Introduction
The paper describes part of the findings of a PhD thesis (Kersten, 2016) on an alternative stable pillar design methodology. This publication contains sufficient information to implement the method for further interpretation and testing. A detailed comparison of measured and predicted data is dealt with in the thesis, and the results show that there is promise in the methodology.
The design of stable pillars in mining is of fundamental importance, not only in the Bushveld Complex mines but throughout the mining industry. Wherever mining occurs, pillars are formed at some stage and it is essential to predict their behaviour, i.e. whether they will burst, yield, or remain stable. Although of crucial importance, pillar design still suffers from major shortcomings and weaknesses.
Owing to uncertainty, pillar designs have for the most part been conservative, with the possible result of the loss of millions of tons of ore by being sterilized and unavailable in the future.
The first pillar strength equation was derived empirically by Salamon and Munro (1967) for coal mines, and was subsequently modified empirically by Hedley and Grant (1972) using data from a Canadian uranium mine. This equation for hard rock has been in use in a variety of mining scenarios in South Africa and elsewhere for over 45 years without modification. In the same period a series of codes, such as FLAC and TEXAN, as well as failure criteria such as the Hoek-Brown criterion, have been developed and updated but are not commonly used in the design of pillars. The majority of pillars in the platinum mines in South Africa are still designed using the modified Hedley-Grant strength equation in conjunction with the tributary area theory.
This paper is an attempt to improve the antiquated empirical system by incorporating analytical methods in the design methodology by:
► Investigating the pillar design method currently in use; its strengths and weaknesses
► Finding alternative methods in use; actual and suggested
► Proposing alternative methods for calculating the pillar strength and the loading system
► Calibrating the proposed method with underground observations.
Current pillar design method: strengths and weaknesses
The Hedley-Grant pillar strength equation is based on the following relationship:

where k is the strength factor
w and h the width and height of the pillar
γ and α variable exponential 'constants', 0.5 and -0.75 for
hard rock mines
σstrpillar strength.
Except for the width and the height of the pillar, the strength factor is based on back-analysis of failed pillars. In the absence of such data, the strength factor is assumed to be a fraction of the uniaxial compressive strength of the rock mass in the pillar; the value varies from 0.3 to 0.8. This is sometimes increased without sound scientific basis when no pillar failure occurs. This type of approach is not only wasteful but could also lead to regional failures.
The uniaxial compressive strength, on which the strength factor is based, varies significantly in the industry, between mines, and individual mining areas. Numerous samples are required to obtain a statistical significant mean.
The stress imposed on the pillar is determined using the tributary area theory (TAT) based on the percentage extraction over an infinite area, depth below surface, and the rock mass density. The assumption of mining over an infinite area creates a condition of a 'soft' loading system affecting the pre- and post-failure behaviour of pillars.
The above argument presupposes that the values using TAT and the modified Hedley-Grant equation provides the correct answer. From personal observations over 40 years it was found that in the majority of cases the predicted failure does not materialise, suggesting that the input parameters are overly conservative and/or the pillar equation is suspect.
Planes of weakness as well as softer layers cannot be accounted for by using the Hedley-Grant equation.
It is the author's opinion that the major reason for using the Hedley-Grant equation is its simplicity and that it is generally accepted by the industry as well as the authorities.
These shortcomings have been recognized by other authors, and alternative design procedures that cover some of the weaknesses have been developed. These are discussed below.
Alternative methods, in use and suggested
Esterhuizen (2003) highlighted the degree of uncertainty associated with each design parameter and discussed the influence of the variability of input parameters in the Hedley-Grant equation, specifically the pillar strength factor k and the width, length, and height of a pillar. He ascribed the uncertainty to the inherent variability of the rock material and a lack of understanding of the way in which rock behaves.
Determining the mean and standard deviations for the relevant quantities, he used the point estimate method to calculate the mean pillar strength with the standard deviation permutation using the Hedley-Grant equation.
Subjecting the pillars to a uniform stress, using the TAT, he determined the factor of safety as well as the probability of failure (PoF) of the pillars and the reliability of the result as:

A brief sensitivity study showed that for the specific model the reliability did not increase significantly above a FoS of 2.0. Also, an increase in depth increased the reliability by decreasing the influence of the pillar dimension variation.
The limit equilibrium model proposed by Malan and Napier (2006) simulates the progressive fracturing of the pillar sidewall, illustrated in Figure 1. The progressively created wedges are restrained by the hangingwall and the footwall seam-parallel stress σ, the seam-normal stress σ , and the shear traction, which is proportional to the seam-normal stress on. The method has the advantage that it proposes a quantifiable failure mechanism, but has not been used in general mine pillar design.
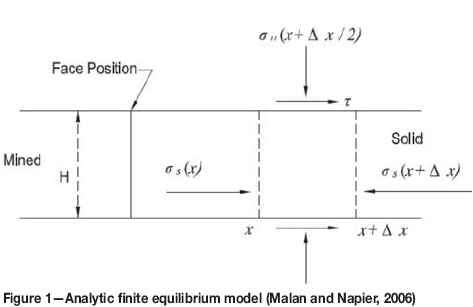
Although the model describes the progressive failure process of a pillar, the pillar strength is obtained by determining the onset of failure as well as the reduction in strength as failure progresses.
Martin and Maybee (2000) studied the brittle failure of pillars in the Canadian Shield hard-rock mines and concluded that the dominant mode of failure was progressive slabbing and spalling. They investigated the commonly used empirical equations listed in Table I, which are based on failed pillars confined to w/h ratios less than 2.5.
Martin and Maybee (2000) concluded that:
'Because at pillar w/h > 2 the confinement at the core of the pillar is increasing significantly, the use of Hoek-Brown brittle parameters will be less appropriate. It should be noted that the pillar-failure database shows that there are only a few pillar failures for pillar w/h > 2, hence, the empirical pillar strength equations should be limited to pillar w/h < 2'.
Joughin, Swart, and Wesseloo (2000) uses the risk-based approach to incorporate the effect of the variation in rock mass properties as well as pillar dimensions, using the Hoek-Brown failure criterion, to calculate the strength of individual pillars. They also used the point estimate method to evaluate the influence of variable rock mass conditions and pillar geometries.
The following parameters were included:
► The mean and standard deviation of the results from all permutations of the uniaxial compressive strength, geological strength index, and values for pyroxenite and chromitite
► Variation in pillar dimensions
► Span variation of bords
► Composite pillars consisting of chromitite and pyroxenite.
An axisymmetric nonlinear finite element model (PHASE 2) was used to calculate the individual pillar strength for all the abovementioned permutations, with the output given in terms of:
► Factor of safety
► Probability of failure
► Reliability.
The method was applied to an area where the results corresponded reasonably well with the number of collapsed pillars.
Leach (2008) and the author researched the validity of the Hedley-Grant equation on large pyroxenite pillars at Nkomati mine. During discussions it was decided to investigate the influence of mining span on pillar loading. On the basis of these discussions, Leach (2008) prepared a report for Nkomati mine dealing with pillar strength in thick orebodies with limited lateral extent using FLAC3D to calculate pillar strength and stress distribution.
The resultant force/closure curves and the calculated load line are shown in Figure 2. In all cases the local mine stiffness line crosses the pillar strength lines in the linearly elastic portion of the pillar curve, well before peak strength is reached.
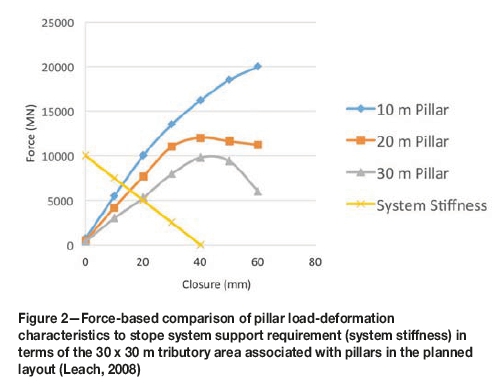
The procedure included the effect of small spans due to the limited lateral size of the orebody, strata stiffness, full pillar strength curves based on the Hoek-Brown failure criterion, and a comprehensive stress calculation using FLAC3D.
The author (Kersten, 2009) proposed a modified TAT for back-analysis of manganese ore pillars at Black Rock mines. The pillar stresses were calculated using the TAT, dividing the entire area by the number of pillars to obtain the tributary area for each pillar assuming a constant pillar centre spacing. The force over the average tributary area was then divided by the area of the individual pillar, giving the resultant individual pillar stresses. Using the Hedley-Grant equation, the strength of each pillar was calculated. The strength and stress values for individual pillars with their varying dimensions are shown in Figure 3 for a specific set of pillars at the mine. The individual FoS values as well as the frequency distribution of the FoS can be interrogated.
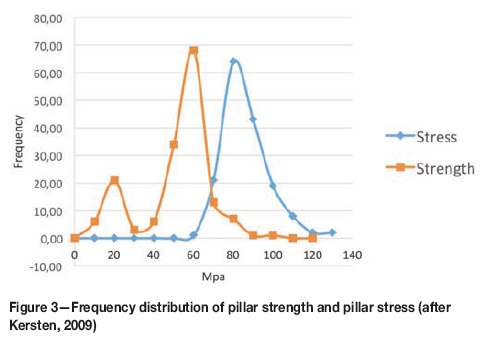
Deficiencies that were addressed are the variability of mine dimensions and the use of individual pillar strength values.
The above brief summary shows that bord and pillar layouts can be designed using available analytical procedures, inclusive of variation in pillar and bord dimensions, weaker layers, and the interaction between hanging/footwall and pillar. The use of system stiffness has been reserved for the analysis of the post-failure pillar behaviour (Ryder and Ozbay, 1990), but can be used in the design of stable, elastic pillars.
Proposed alternative method for calculating pillar strength
The proposed alternative method for calculating the pillar strength is based on a semi-analytical approach using a mathematical model in conjunction with an empirical failure criterion.
► Determining the pillar strength using FLAC2D, axial configuration, simulating a circular pillar
► Incorporating the modified Hoek-Brown failure criterion.
It is assumed that the pillar/rock mass remains elastic until pillar failure occurs.
Owing to its versatility, the FLAC2D programme can simulate the influence of the hanging- and footwall properties on pillar strength as well as complex interfaces. For the present study it was decided to confine the investigation to simple cases and calibrate these before embarking on more complex structures.
In the present study, relevant variables included in the FLAC2ZVHoek-Brown model were confined to:
► A homogeneous pillar
► Use of known geotechnical parameters
► Development of a simple program for a specific set of conditions
►The m{value, hence the value mr, was based on the widely used RocLab programme developed by Rocscience.
Details of the program are given in Appendix I. Using the FLAC2ZVHoek-Brown model, the following pillar behaviour was observed:
► The vertical stress is the lowest at the pillar edge after commencement of pillar failure.
► At the average peak pillar stress, apm, the vertical stress at the core of the pillar generally exceeds the uniaxial compressive strength of the rock.
► Pillar failure is a progressive process, moving gradually from the sidewall towards the centre of the pillar.
► Changes in pillar geometry result in the change in the slope of the load-deformation curves as well as the post-failure behaviour. A similar effect has been described by Vogler and Stacey (2016) for different specimen geometries in laboratory studies.
► The FLAC2ZVHoek-Brown model is an iterative process incorporating the influence of progressive failure as stepping proceeds.
► The volumetric strain increment could be a possible measure of the depth of fracturing in a pillar.
Loading system
In the platinum mines geological losses due to faulting and 'potholes' vary between 20% and 30% of the mining area, resulting in limited mining spans between the regional pillars caused by these losses. The influence of the limited span needs to be incorporated in the mine design and can be simulated using the concept of the load line of the system.
Since stable pillar design deals with the pre-failure state of the pillar, the theory of elasticity can be used to the point of pillar failure, allowing accurate calculation of the rock mass deformation and resultant pillar stresses.
To incorporate the influence of limited span geometries it was decided to make use of the load line of a system. Although this concept deals entirely with the post-failure region of pillars it can also be used for the design of stable geometries; stable implying a design with a safety factor in excess of unity.
To construct the load line, the force and displacement values need to be calculated.
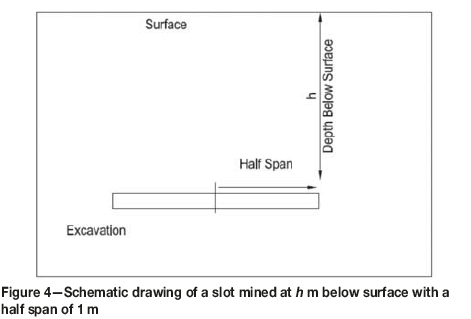
The closure can be calculated using the theory of elasticity. Figure 4 is a schematic drawing of an infinitely long slot in the third dimension cut at a depth of h m below surface having a half span of l m. The maximum elastic closure of a tabular excavation is given by equations for infinite as well as finite depth.
The equation for infinite depth is given by Budavari (1983):
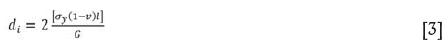
where dt= vertical or y-closure l = Half span (m)
ay= Vertical primitive stress component
v = Poisson's ratio
G = Shear modulus of the rock

Mining depth in the Bushveld Complex varies significantly, and for shallow mines Equation [3] needs to be modified to cater for tabular excavation at finite depths:
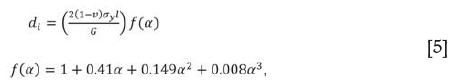
where α = 2l/h
Equation [5] is attributed to Budavari (1983) as used in his lecture notes. The difference of displacement values between the two equations varies with depth. For 100 m depth, the finite depth equation gives a closure that is 50% higher, while with increasing depth the closure values converge, differing by only 5% at 600 m. For the current investigation, Equation [5] was used.
The above equations deal with a two-dimensional geometry and the half span referred to above is the minimum span in plan of an excavation.
A simplified linear load line for a specific geometry can be determined in the following manner.
To prevent any vertical closure in an excavation, the total reacting force required has to be equal to the negative value of the product of the vertical primitive stress and the mined-out area. Applying this force at the centre of the excavation would have the same effect as a number of distinct units such as pillars, for which the sum of the individual forces is equal to the total required resisting force.
The load line can then be constructed. At zero displacement, the total force required is plotted on the y-axis of the graph shown in Figure 5. For maximum displacement/closure, the force will be zero and is plotted on the x-axis. Connecting the two points gives the linear load line of a system (Figure 5).
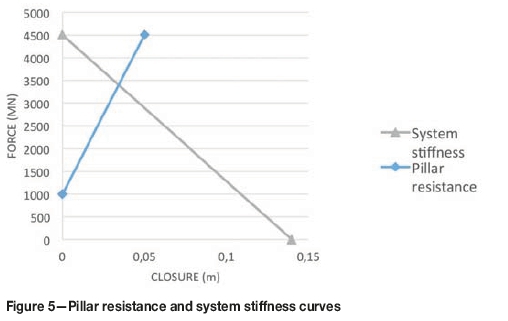
The pillar resistance curve is based on the stress and displacement curve obtained using the axisymmetric FLAC2D model and the Hoek-Brown failure criterion.
The intersection of the two curves gives the equilibrium condition of a specified two-dimensional geometry.
It must be pointed out that the slope of the FLAC2D/Hoek-Brown-determined pillar load deformation curve for individual pillar geometries differs with pillar width as well as pillar height. The span of the excavation also changes the slope of the load line, and in conjunction with the changes in pillar slope affects the value of the equilibrium point significantly and hence the safety factor, especially in limited span, high stope-width excavations such as are generally used in semi-massive ore deposits.
It must be noted that the system stiffness curve can also be determined by incremental load changes, generally resulting in a slightly curved form. For the current proposition, the linear assumption is deemed acceptable; the approach and illustrative portion of the research assumes linearity but the method can be expanded to nonlinear equations.
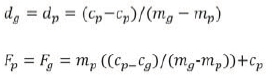
The pillar/strata system equilibrium point is determined by the intersection point of two equations, assuming the load lines to be linear.
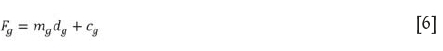
The ground reaction curve is given by

The pillar resistance curve for one or more pillars:
where Fg= System force
mg= Slope of the ground reaction curve
dg= System closure
Fp= Force on pillar
apm= Pillar strength
mp= Pillar stiffness
dp= Pillar closure
cg= Total overburden weight
cp= Primitive force on pillar
The force at the intersection of the two curves given by Equations [6] and [7] is given by:
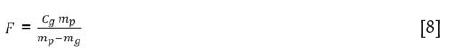
Since cghas been shown to be the overburden total load over the mined-out area Am, it can be expressed as:

The slope of the ground reaction curve, mg, is:
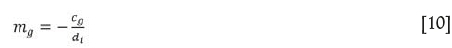
where is the maximum deflection of the opening as calculated by Equation [5]. Equation [8] can be extended to:

In practice, there would be a regular layout of approximately equally sized and spaced pillars. If the pillar centre distance is C, a strip with width equal to C can be created over a longer distance with span L.
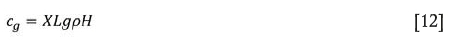
The maximum deflection in the absence of pillars is given by Equation [5]. The resistance required to prevent any deflection is the weight of the strip of width X over the panel length L.
The system load, cg, is:
The slope of the ground reaction curve is then:

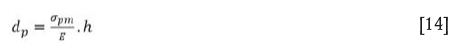
The pillars will still have individual closure response. If the maximum pillar stress at failure is apmthe pillar closure at the point of failure is:
where h is the stoping width. The pillar load at failure is:
where w is the pillar width.
As there is a system of pillars, the total number of pillars across the panel contained in the width X is  , then the total pillar resistance for the system is:
The slope of the pillar resistance curve is:

The equilibrium force, F, is obtained by substituting the values of Cg, mg, and mpin Equation [8]. The factor of safety is then:

Equations [8] to [18] were incorporated in an Excel spreadsheet to facilitate calculating the average pillar stresses and closures at the equilibrium point as well as the factor of safety.
An alternative formulation of the intersection of the force-displacement suited for incorporation in a spreadsheet model is:
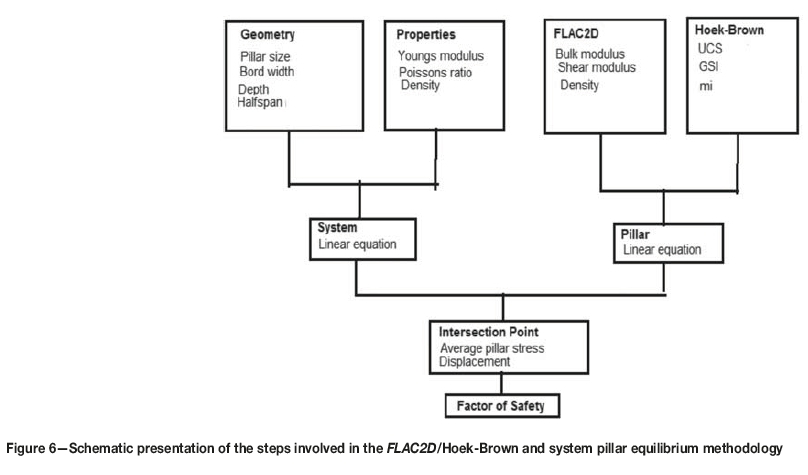
The flow chart in Figure 6 is a schematic presentation of the steps involved in the FLAC2D/Hoek-Brown and the system-pillar-equilibrium concept, SPEC.
Comparison of the proposed method with underground observations
For calibration purposes Impala Platinum Mines was selected because sufficient rock mass property data (Impala Platinum Mines, 2012), as well as experimental observations on pillar fracturing and closure, was available (Piper and Flanagan, 2005).
Data from a six-month monitoring programme at 12 Shaft, Impala Platinum Mine, conducted to quantify the in-situ performance of grid pillars by means of rock mass measurements and monitoring, was presented by Piper and Flanagan (2005). The two parameters relevant to the present discussion are the relationship between pillar size and extent of fracturing and closure measurements in individual panels as the span increased.
The pillar geometry was back-analysed as per the sequence illustrated in Figure 6.
A good correlation between the plastic strain component in the strain softening model (FLAC2D) and the measured inelastic deformations was found by Kersten and Leach (1996). Roberts (2017) introduced the concept of displacement ratio criteria for accurately predicting borehole breakout. It appears that the use of deformation/strain values offers an alternative approach for prediction of failure zones. In the current study the dimensionless volumetric stain increment (vsi) in the FLAC2D model was used.
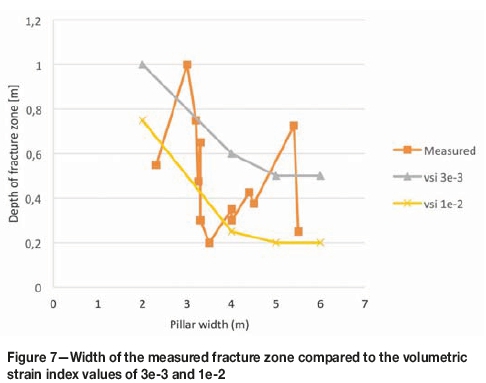
Figure 7 shows the width of the measured fracture zone and the bracketing vsi values of 1e-2 to 3e-3. The measured reduction in width of the fracture zone with an increase in the pillar width is mirrored by the vsi bracketing the actual values.
Closure measurements by Piper and Flanagan (2005; Figure 8) shows a reduction in closure rate at a span of approximately 30 m. This reduction is due to the effect of the barrier pillars, which are spaced at 60 m intervals on dip, while mining progresses further on strike, limiting the minimum span of the excavation.
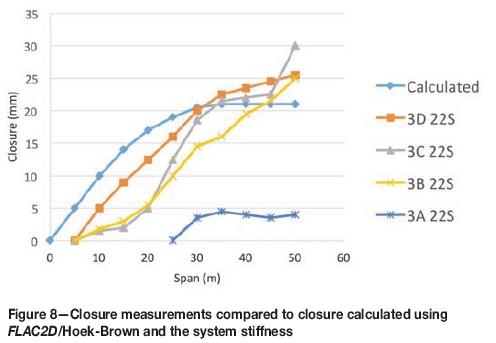
Figure 8 is a comparison of the measured closure values with calculated displacements using the proposed pillar system equilibrium concept given above for the different mining spans and specific pillar geometries.
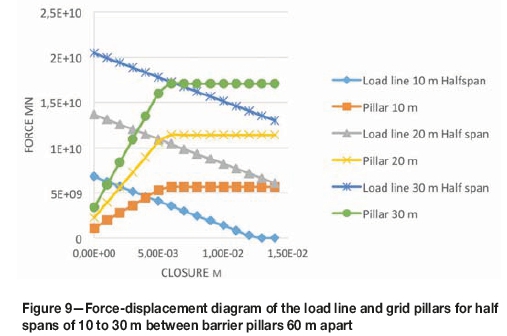
To illustrate the effect of change in span, Figure 9 shows the force-displacement curves for half spans of 10, 20, and 30 m where the intersection points give the FoS of 1.24, 1.05, and 0.98 respectively.
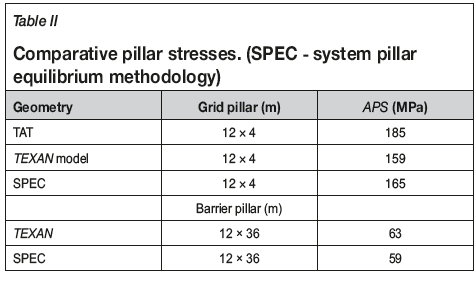
Malan and Napier (2007, 2011) conducted research in the same area as Piper and Flanagan (2005), after further mining had been done, using the TEXAN code to calculate the individual pillar stresses. The individual pillar stresses, calculated using the pillar system equilibrium methodology, and with the same elastic constants, compare well with the values obtained by the TEXAN code (Table II). As can be expected, the value obtained by the tributary area theory is higher.
In summary:
► The extent of the fracture zone can be predicted reasonably accurately using the volumetric strain increment criterion.
► The amount of closure can be predicted within reasonable accuracy.
► The average pillar stresses agree closely with those obtained using the more elaborate TEXAN code.
The combination of the FLAC2D/Hoek-Brown model and the system/equilibrium method can be used to obtain realistic values for the average pillar stress, strength, closure, and the factor of safety.
Summary and conclusions
It was found that the current bord and pillar design, using the generally accepted empirical Hedley-Grant equation in conjunction with tributary area theory, needs revision. With the availability of analytical methods and failure criteria, it was decided to determine whether it is possible to create an analytical solution to replace the empirical approach.
The proposed methodology uses the load line of the system in conjunction with FLAC2D and the Hoek-Brown failure criterion to calculate pillar deformation and failure strength. The intersection point of these two curves gives the equilibrium pillar stress and deformation of the bord and pillar configuration. The pillar edge failure, predicted using a strain-based criterion, as well the elastic deformation, agreed reasonably well with underground measurements.
The stage has been reached where the methodology can be used to predict the influence of rock mass characteristics, most likely failure of pillars at greater depth, and alternative pillar mining methods. The concept deals with intact pillars but can readily be extended to the nonlinear regime.
The results of the investigation dealt with simplified geometries and pillars only, but with the versatility of codes like FLACJD/FLAC2D/Hoek-Brown sets the stage for further investigation and calibration of the interaction between pillars and surrounding country rock using the above or similar available codes and failure criteria.
Acknowledgments
The author thanks Impala Platinum Mine for making available their rock mass database as well as some unpublished reports, and Professor Nielen van der Merwe for his guidance and patient support.
References
Budavari, S. 1983. Stresses and displacements induced by mining. Rock Mechanics in Mining Practice. Monograph Series 5. Southern African Institute of Mining and Metallurgy, Johannesburg. [ Links ]
Esterhuizen, G.S. 2003. Variability considerations in hard rock pillar design. Proceedings of Rock Engineering Problems Related to Hard Rock Mining at Shallow to Intermediate Depth, Rustenburg. South African National Institute of Rock Engineering. pp. 48-54. [ Links ]
Hedley, D.G.F. and Grant, F. 1972. Stope pillar design for the Elliot Lake uranium mines, CIM Bulletin, vol. 65. pp. 37-44. [ Links ]
Impala Platinum Mines. 2012. Composite data bank of rock properties. Personal communication. [ Links ]
Itasca Consulting Group 2011. Fast Lagrangian Analysis of Continua, online manual and user's guide. Minneapolis, MN. [ Links ]
Joughin, W.C., Swart, A.H., and Wesseloo, J. 2000. Risk based chromitite pillar design - Part II. Non-linear modelling. Proceedings of SANIRE2000, Keeping it up in the Bushveld and Advances in Support Technology. South African National Institute of Rock Engineering. [ Links ]
Kersten, R.W.O. 2009. Black Rock Mines; comments on the rock engineering requirements. Internal report. Assmang, Johannesburg. [ Links ]
Kersten, R.W.O. and Leach, A.R. 1996. The calibration of material models in FLAC for deep gold mine problems. Prediction and Performance in Rock Mechanics & Rock Engineering. Proceedings of the ISRM International Symposium EUROCK '96, Turin, September 1996. Vol. 2 Barla, G. (ed.). Balkema, Rotterdam. pp. 1179-1084. [ Links ]
Kersten, R.W.O. 2009. Comments on the rock engineering aspects of Black Rock Mining Operations. Contract report to mine management, BRMO operations. [ Links ]
Kersten, R.W.O. 2016. A probabilistic structural design process for bord and pillar workings in chrome and platinum mines in South Africa. PhD thesis, Faculty of Engineering and the Built Environment, University of the Witwatersrand, Johannesburg. [ Links ]
Leach, A R. 2008. Summary Report; Assessment of stability of proposed room and pillar workings for Nkomati Mine. Itasca Africa (Pty) Ltd. [ Links ]
Lougher, D.R and Ozbay M.U. 1995. In-situ measurements of pillars and rock mass behaviour in a moderately deep hard-rock mine. Journal of the South African Institute of Mining and Metallurgy, February 1995. pp. 19-24. [ Links ]
Malan, D.F. and Napier, J.A.L. 2006. Practical application of the TEXAN code to solve pillar design problems in tabular excavations. Proceedings of SANIRE 2006, Facing the Challenges in Rock Mechanics. South African National Institute of Rock Engineering. pp. 1-20. [ Links ]
Malan, D.F. and Napier, J.A.L. 2007 Numerical modelling of the bord and pillar layout at Impala no 12 Shaft. Contract report CR269/0307/IMP021. March 2007. [ Links ]
Mathey, M. 2015. Personal communication. [ Links ]
Martin, C.D. and Maybee, W.G. 2000. The strength of hard rock pillars. International Journal of Rock Mechanics and Mining Sciences, vol. 37. pp. 1239-1246. [ Links ]
Piper, P.S. and Flanagan, F.W. 2005. The in-situ performance of yielding pillars at Impala 12 Shaft. Proceedings of the 3rd Southern African Rock Engineering Symposium. South African National Institute of Rock Engineering. [ Links ]
Roberts, D. 2017. Calibration of numerical model for bore-and-fill mining. Journal of the South African Institute of Mining and Metallurgy, vol, 117, no. 7. pp. 705-718. [ Links ]
Ryder, J.A. and Ozbay, M.U. 1990. A methodology for designing pillar layouts for shallow mining. Proceedings of the International Symposium on Static and Dynamic Considerations in Rock Engineering, Swaziland. International Society for Rock Mechanics. pp. 273-286. [ Links ]
Salamon, M.D.G. and Munro, A.H. 1967. A study of the strength of coal pillars. Journal of the South African Institute of Mining and Metallurgy, vol. 68. pp 55-67. [ Links ]
Van der Merwe, J.N. and Mathey, M. 2013. Update of coal pillar strength formulae for South African coal using two methods of analysis. Journal of the Southern African Institute of Mining and Metallurgy, vol. 113, no. 11. pp. 841-847. [ Links ]
Vogler, W.W.O.L. and Stacey, T.R. 2016. The influence of test specimen geometry on the laboratory-determined Class II characteristics of rocks. Journal of the Southern African Institute of Mining and Metallurgy, vol. 116, no. 11. pp. 987-1000. [ Links ]
Watson, B.P., Ryder, J.A., Kataka, M.O., Kujpers, J.S., and Leteane, F.P. 2008. Merensky pillar strength formulae based on back analysis of pillars at Impala Platinum Mine. Journal of the Southern African Institute of Mining and Metallurgy, vol. 108, no. 8. pp. 449-461. [ Links ] ♦
 Correspondence:
R.W.O. Kersten
Email: rkersten@mweb.co.za
Received: 25 Jan. 2017
Revised: 16 Sept 2018
Accepted: 6 Nov. 2018
Published: May 2019
ORCiD ID: R.W.O. Kersten. https://orchid.org/0000-0001-6344-7510
The FLAC2D/Hoek-Brown model is fundamental to the approach adopted and is, therefore, given in detail in this Appendix. Below is the input file for a simple homogeneous pillar with given dimensions and properties. (This file can be transferred directly into FLAC2D).
new ti
Hoek Brown Model for calibration
config axi ; Axial symmetry, simulating a circular geometry
gr 24,20; Grid of 24 by 20
gen 0,0 0,2 2.5,2 2.5,0; Circular pillar 2.5 m high with a radius of 2 m. mod mo ;Pyroxenite
prop bu=54e9 sh=26.4e9 d=2800 *coh=14e6 ten=1e20 fric=46 ;
Shea and, bulk modulus
call hoek2.fis ;<--(associated rule)
set hb_mmi=12.876 hb_mmr=6.4;. Roclab Modified and residual
mr value
set hb_ssi=.1889 hb_ssr=.094 ;0.0010 ; Roclab Modified and residual s values.
set hb_sc=52.1e6 ; Strength value as per Roclab programme ; Circular pillar FISH function for calculating the total force def load
sum2=yforce(1,jgp)*x(2,jgp)*0.25
loop i (2,igp)
sum2=sum2+yforce(i,jgp)*x(i,jgp) end_loop
ftot = 2.*pi*sum2
; (Total area of strip pillar - axi-symmetric mode)
_area = pi*x(igp,jgp)*x(igp,jgp)
load = ftot
aps = ftot/_area
end
his yd i=1 j=20 ; Histories for selected points fix x y j=1; Setting boundary conditions fix x y j=21 fix x i=1
*ini yv 1e-7 j=1; Setting loading rates ini yv -1e-6 j=21
his aps; Results from FISHfunctions his load
his xd i=19 j=10
set nsup=3000 ns=10 ; note, FLAC will cycle nsup*ns times;
Number of steps
supsolve
end
Also included is the subroutine hoek2.fis Hoek-Brown failure criterion to be used in all the simulations of homogeneous pillars.
FISH routine for Hoek-Brown failure surface ; the dilation angle is specified using hoek_psi ; (hoek_psi = fi for an associated flow rule)
def cfi
loop i (1,izones) loop j (1,jzones) if state(i,j) > 0 then h_mm=hb_mmr h_ss=hb_ssr else
h_mm=hb_mmi
h_ss=hb_ssi
end_if
effsxx = sxx(i,j) + pp(i,j) effsyy = syy(i,j) + pp(i,j) effszz = szz(i,j) + pp(i,j)
tension(i,j)=0.5*hb_sc*(sqrt(h_mmA2+4*h_ss)-h_mm)
temp1=-0.5*(effsxx+effsyy)
temp2=sqrt(sxy(i,j)A2+0.25*(effsxx-effsyy)A2)
s3=min(temp1-temp2,-effszz)
if s3<0.0 then
s3=0. end_if
if s3<0.0 then
s3=0.
end_if

