


Services on Demand
Article
 English (pdf)
 Article in xml format
 Article references
Indicators

Related links
-
 Cited by Google
 -
 Similars in Google
Share

 Permalink
Journal of the Southern African Institute of Mining and Metallurgy
On-line version ISSN 2411-9717
Print version ISSN 2225-6253
J. S. Afr. Inst. Min. Metall. vol.119 n.5 Johannesburg May. 2019
http://dx.doi.org/10.17159/2411-9717/17/155/2019
PAPERS OF GENERAL INTEREST
Rock properties and machine parameters evaluation at Rössing Uranium Mine for optimum drill performance
B. AdebayoI, II; J.G.M. MukoyaI
IDepartment of Mining and Metallurgical Engineering, University of Namibia
IIDepartment of Mining Engineering, Federal University of Technology, Akure
SYNOPSIS
This work was carried out to determine the influence of rock properties and drilling machine parameters on the penetration rate at the SJ pit of Rössing Uranium Mine, Namibia. Rock properties (uniaxial compressive strength, tensile strength, and modulus of elasticity) of samples collected were determined in the laboratory. Drilling experiments were conducted in which feed pressure, air pressure, rotary speed, weight on the bit, and torque were varied to measure their effect on the penetration rate. The uniaxial compressive strength varied from 90-180 MPa for layered marble-quartzite and banded gneiss. Increases in feed pressure, weight on the bit, and rotary speed beyond the optimum level led to a decrease in penetration rate and caused the drill bit to 'stall'. Results of the study revealed that penetration rate increases with an increase in the feed pressure and air pressure. After reaching a maximum value, the penetration rate begins to decrease despite increasing feed pressure. A very high torque causes the drill bit to stall, since the feed pressure is too high and the air pressure is not sufficient to remove the cuttings from blast-hole at maxium bailing velocities. The average penetration rate varied from 19 to 45 m/h for phase 2 of the pit, and from 17 to 68 m/h for phase 3. The optimum drilling machine parameters obtained in phase 2 and phase 3 were slightly lower than those currently being used at the mine. The trials of the optimum machine parameters will assist in reducing the cost of drilling, which varied from N$29.48 to N$36.31 per metre for the tricone bit.
Keywords: rotary drilling, machine parameters, rock properties, penetration rate.
Introduction
Drilling and blasting contribute most to the operational cost in opencast mining and have the potential to influence the cost of downstream operations (Aipanda, 2011). The drillability of rocks depends not only on the rock properties, but also on the drilling tools and operational variables. In rotary drilling, rotational speed, thrust, and flushing are the operational variables, and are known as the controllable parameters. Rock properties and geological conditions are the uncontrollable parameters. Although, many attempts have been made to correlate drillability with rock properties, the rock characteristics affecting rotary drilling have not been entirely defined (Hartman, 1962; Kahraman, Bilgin, and Feridunoglu, 2003). The drill bit is forced into a rock surface from the rotary power head, hence creating stresses and cracks at the bit-rock interface. The performance of a particular bit in any formation is dependent on the properties of the rock and drill operating parameters (Adebayo and Akande, 2015).
The response to this stress field depends on the rock type and loading system. Kahraman, Bilgin, and Feridunoglu (2003) discovered that around the contact of the button with the rock a new state of stress is initiated. Around the contact four important destruction mechanisms can be distinguished: under the bit button a crushed zone of fine rock powder is formed (impact); starting from the crushed powder zone, radial cracks are developed (induced tensile stress); when the stress in the rock is high enough, larger fragments of the rock can be sheared off between the button grooves (shear stress) (Ozdemir, 1977). The penetration rate is considered as one of the primary factors that affect drilling costs and hence it must be given prior consideration when planning for the optimization of a drilling operation. The subject of the penetration rate has been extensively analysed from both the theoretical and the experimental standpoints with the objective of maximizing penetration rate and improving operating efficiencies (Lummus, 1969).
Clark and Shafto (1987) presented theoretical bit torque relationships derived by testing many types of rocks with coring and non-coring bits. They found that the penetration rate increases with torque and a critical value of torque exist, below which penetration does not occur. Increasing the fluid flow rate also results in an increase in the differential pressure (Garnier and Lingen, 1959). However, a drill has an optimum weight-on-bit (WOB) for maximum penetration which corresponds to proper indentation at the bit-rock interface. The optimum WOB also depends on the other optimal drilling conditions (Clark 1979). An increase in the bit rotary speed results in greater wear on the bit and may even cause chattering, micro-chipping, and cracking of the cutting indenters or teeth of the bit. The rotational speed may be restricted by the stability of the rig and the drill rods (Clark 1979).
The function of thrust in rotary-percussive drilling is to ensure that the percussion energy is transmitted to the rock. The relationship between thrust and penetration rate has been studied by Sinkala (1989) and Pearse (1985), who found that penetration rate increases with thrust until a peak penetration rate value is reached. The researchers suggested that as the thrust increases further the penetration rate will drop until the drill finally stalls. In addition, at low thrust the bit will not be in constant contact with the bottom of the hole. Low thrust results in free rotation of the bit and poor chip formation, and at higher thrust the torque required for bit rotation increases and sometimes reduces (Sinkala 1989). Excessive feed pressure in jointed rock causes rods to jam in weak rocks. The bit action cannot break the rock sufficiently for chip removal by the flushing medium, which results in a low penetration rate (Tandanand and Unger, 1975). The amount of reflected stress energy will depend on the rock properties and the magnitude of applied feed force. The feed force causes the bit to move back in contact with the rock before the next piston blow occurs (Jiao, 1989). An increase in air pressure improves the cleaning of the hole, and this consequently leads to a higher penetration rate. High loading forces may be due to excessive feed force, hardness of the rock, and improper cleaning of the hole; however, high torque will affect the machine performance (Nguyen 2011).
The majority of drill rig operators do not take into account the effect of adjusting drilling machine parameters in softer and harder rock formations. This leads to excessive bit wear, reduced penetration rate, breaking of roller cones and deck bushes, and straining of the rods and stabilizers. Therefore, there will be an increase in the drilling costs due to the reduction in the life of the drill consumables coupled with the longer time needed for drilling a blast-hole. The objectives of this paper are to determine the properties (strength parameters and Young's modulus) of selected rocks; measure machine parameters (air pressure, rotational speed, feed pressure, torque, weight on the bit); evaluate the penetration rates; and determine optimum machine parameter for improved drill performance.
Description of the study area
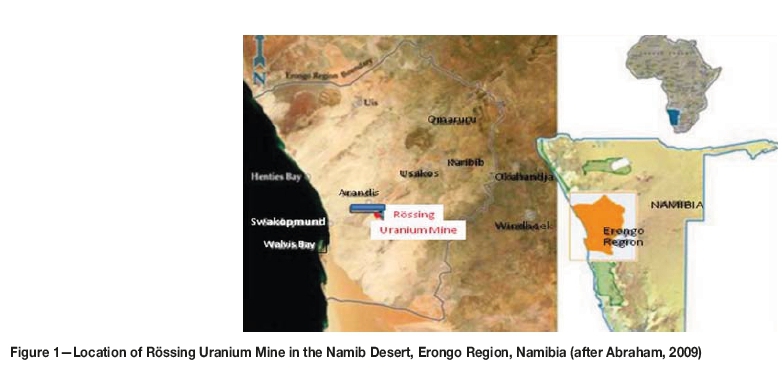
Rössing Uranium is located 70 km inland from the coastal town of Swakopmund in the Erongo region of Namibia, and 12 km from Arandis (Rössing Uranium, 2013) as shown in Figure 1.
Materials and methods
Determination ofpoint load strength index
Point load strength was determined following the standard method suggested by ISRM using Equation [1] (ISRM, 1989).

where P is the load exerted on the sample (kN), and D is the diameter of the sample (mm).
Determination of uniaxial compressive strength
The uniaxial compressive strength test was carried out in accordance with the standard method suggested by ISRM (1989). The uniaxial compressive strength was determined using Equation [2].

where UCS is the uniaxial compressive strength, P is the peak load (kN), and A is the cross-sectional area of the sample (mm). In cases where core length constrained L/D values to less than 2, the UCS values were corrected by applying Equation [3].
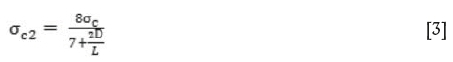
where acis the uncorrected measured UCS (MPa), D is the specimen diameter (mm), L is the specimen length (mm), and ac2 is the corrected UCS (MPa) of the specimen.
Determination of tensile strength
The tensile strength of the samples was determined using Equation [4] (Jimeno, Jimeno, and Francisco, 1995).
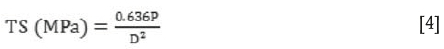
where P is the load exerted on the sample (kN) and D is the diameter of the sample (mm)
Determination of Young's modulus
The modulus of elasticity or Young's modulus, E (GPa), is the ratio of stress to corresponding strain. The relationship between UCS and Young's modulus expressed in Equation [5] (Horsrud, (2001) was used to determine the Young's modulus of the rock.
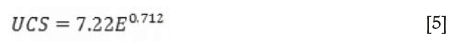
where UCS is the uniaxial compressive strength (MPa) and E is Young's modulus (GPa).
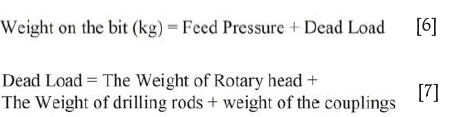
Determination of weight on bit
Weight on the bit was estimated using the expression in Equation [6], and the dead load is expressed in Equation [7].
Measurement ofdrilling machine parameters
The Pit Viper rig is a rotary drilling machine with a tricone bit 311 mm in diameter for drilling vertical holes in the rock. The machine parameters (air pressure, rotational speed, feed pressure) were recorded in phase 2 and phase 3 of the pit while the machine was drilling blast-holes 311 mm in diameter with a bench height of 15 m. Phase 2 and phase 3 refer to selected sections of the pit - phase 2 consists of lower banded gneiss and phase 3 consists of the upper marble and layers of marble and quartzite.
Results and discussion
Analysis ofstrength parameters and Young's modulus for the rocks
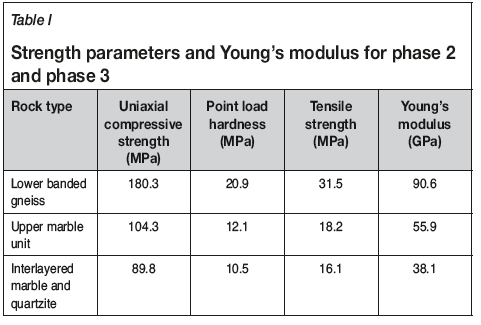
Table I presents strength parameters and Young's modulus for phase 2 and 3 of the pit. The uniaxial compressive strength varied from 89.8 MPa for the interlayered marble and quartzite to 180.3 MPa for the lower banded gneiss. Point load strength index varied from 10.5-30.9 MPa, tensile strength from 16.10-5 MPa, and Young's modulus from 38.1-90.6 GPa.
Effect ofrock properties on the penetration rates in phase 2 and phase 3
Figure 2 presents a plot of point load strength index versus
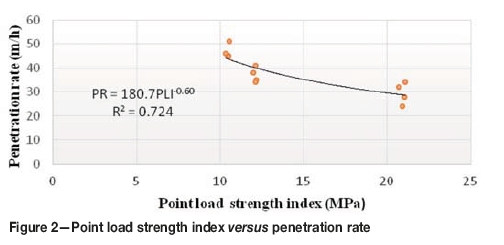
average penetration rate of the bits. A power relationship exists between the average penetration rate and point load strength index, with a coefficient of correlation R2 = 0.72. This means that a modest correlation exists, as shown in Figure 2, and the penetration rate will be faster in the weaker rocks. The net penetration rate varied from 47 to 29 m/h.
Figure 3 presents a plot of uniaxial compressive strength against the average penetration rate. A power relationship exists between average penetration rate and uniaxial compressive strength, with coefficient of correlation R = 0.71. This means that a modest correlation exists between the two variables, and the stronger rocks will be penetrated more slowly. It was observed that as the compressive strength of the rock increases, the penetration rate decreases.
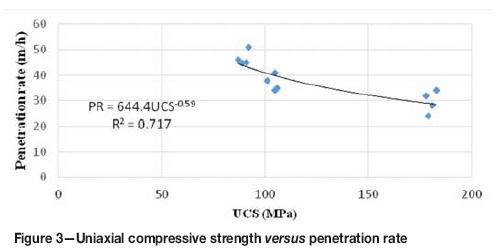
Figure 4 presents a plot of tensile strength against the average penetration rate of the bits. A power relationship exists between the average penetration rate and tensile strength with a coefficient of correlation R2 = 0.70. This indicates a modest correlation, and rock with a lower tensile strength will be drilled faster. The tensile strength varied from 16 to 31 MPa, and net penetration rate varied from 47 to 29 m/h.
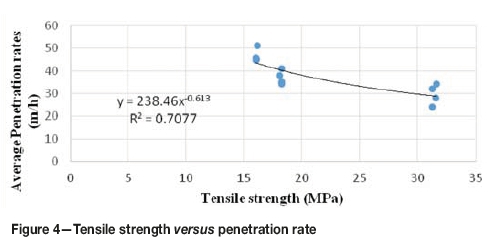
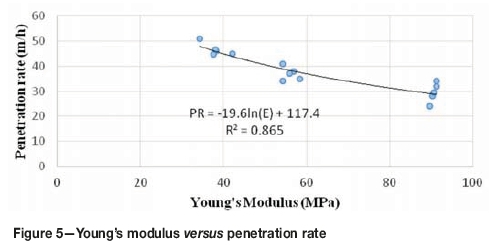
Figure 5 presents a plot of Young's modulus against the average penetration rate. A logarithmic relation exists, with a coefficient of correlation R2 = 0.865, indicating a good correlation. The more rigid rock drill more slowly.
Optimum drilling parameters for phase 2 and phase 3 of the pit
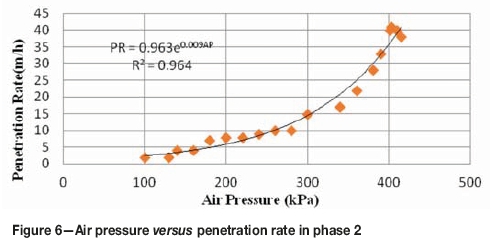
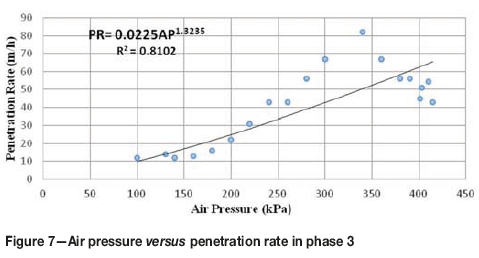
Figures 6 and 7 present the plots of air pressure against the penetration rate in phase 2 and phase 3 of the pit. The penetration rate increases with increasing air pressure until a peak value is reached, and then drops suddenly. However, 96% of the points for phase 2 and 81% for phase 3 fit into the equation of best exponential and power curves of fitness, respectively. Optimum air pressure value was observed to be 390 kPa with a corresponding penetration rate of 41 m/h in phase 2, and 330 kPa with an optimum penetration rate of 81 m/h in phase 3.
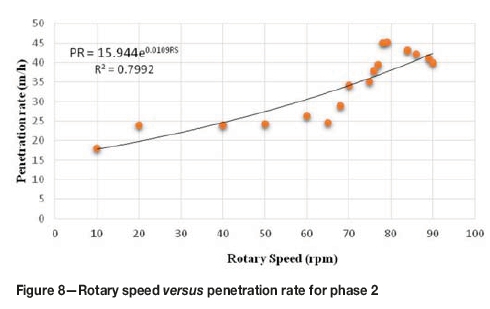
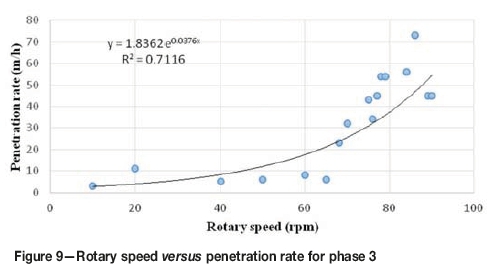
Figures 8 and 9 present the plots of rotation speed against penetration rate for phases 2 and 3 of the pit. Penetration rate is almost constant at 24 m/h at rotary speeds of between10 r/min and 62 r/min for phase 2, and almost constant at 8 m/h between rotary speeds of 10 r/min and 62 r/min for phase 3. A further increase in rotary speed from 63 to 79 r/min and 63 to 83 r/min caused a rapid increase in the penetration rates from 24 to 45 m/h and 9 to 73 m/h for phase 2 and phase 3 respectively. Then it started to drop again, to 39 m/h at a rotary speed of between 80 and 84 r/min for phase 2, and 47 m/h at 83 to 85 r/min for phase 3. More importantly, 79.9% of the points for phase 2 and 71% for phase 3 fit into the equation of the best exponential curve of fitness. The highest penetration rates of 36 to 45 m/h were attained at a rotational speed between 73 and 89 r/min
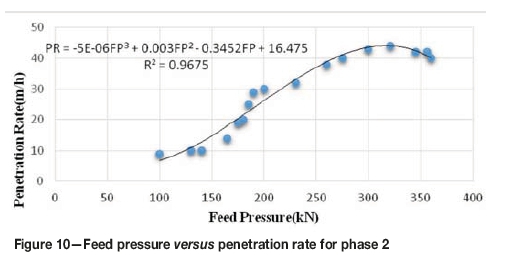
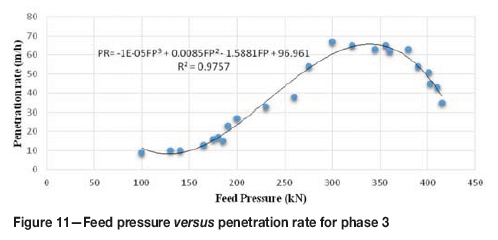
Figures 10 and 11 present the plots of feed pressure against penetration rate for phases 2 and 3. It can be seen that as the feed pressure increases, the penetration rate for both phases also increases until it reaches a peak value, after which it remains constant. The optimum feed pressure was 330 kN for phase 2, with a corresponding optimum penetration rate of 44 m/h, and 300 kN for phase 3, with a corresponding optimum penetration rate of 66 m/h. In addition, 96.8% and 97.6% of the points fit in the equation of best polynomial curves for phases 2 and 3 respectively.
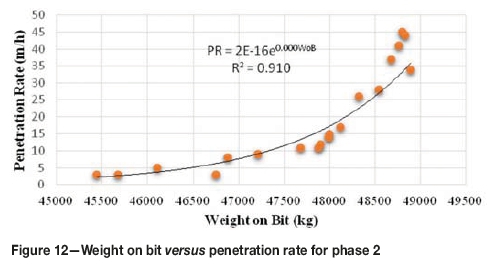
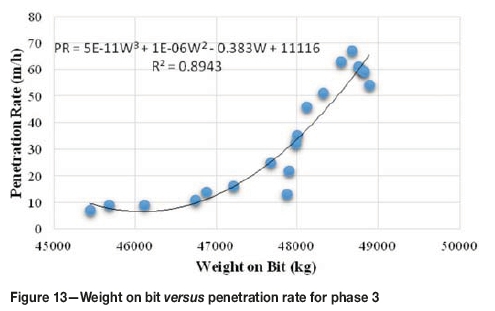
Figures 12 and 13 present the plots of weight on the bit against penetration rate. At between 45 400 and 46 800 kg force the penetration rate was hovering between 4 and 5 m/h for phase 2, and 8 to 11 m/h for phase 3. Increasing the weight from 47 900 to 48 850 kg force for phase 2 resulted in a rapid increase in the penetration rate from 10 to 45 m/h, and for phase 3 an increase from 47 200 to 48 700 kg force on the bit increased the penetration rate from 17 to 68 m/h. The optimum weight on the bit was recorded as 48 700 kg force for phase 2 and 48 600 kg for phase 3 for an optimum penetration rate of 69 m/h. Furthermore, 91.0% of the points for phase 2 and 88.0% for phase 3 fit the equation of best exponential and polynomial curves of fitness.
Statistical modelling
Tricone bit performance
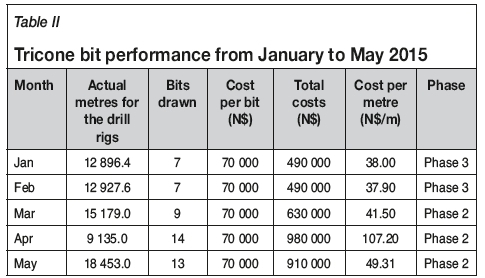
Table II shows the performance of the tricone bits tracked from January to May 2015 before the optimum machine parameters had been determined. The table also shows the actual metres drilled, number of bits drawn and, most importantly the drilling cost per metre. Drilling cost varied from N$37.90 per metre in February to N$107.20 per metre in April.
Tricone bit performance using new optimum machine parameters
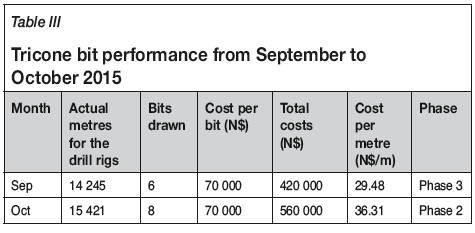
Table III shows the performance of the tricone bits that was recorded when the new optimum drilling machine parameters were tested in the field from September to October 2015.
Drill pipe performance
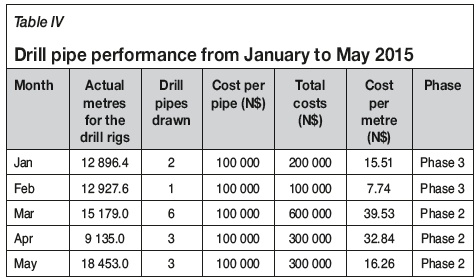
Table IV shows the performance of the drill pipes tracked from January to May 2015. The table shows the actual metres drilled before the drill pipes were changed, the number of drill pipes drawn, and the drilling cost per metre. The drilling cost varied from N$7.74 per metre in February to N$39.53 per metre in March
Drill pipe performance using new optimum machine parameters
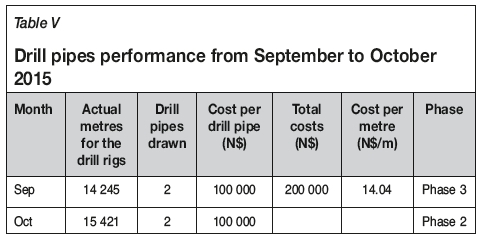
Table V shows the performance of the drill pipes that was recorded when the new drilling machine parameters were tested in the field from September to October 2015.
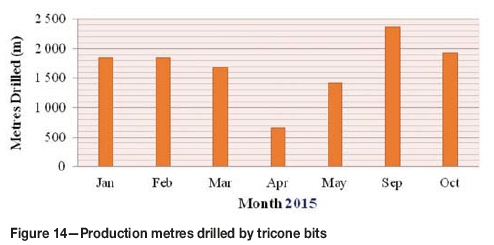
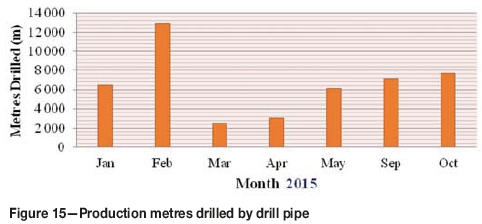
Figures 14 and 15 present production metres drilled by tricone bit and drill pipe respectively. All the blast-holes drilled from January to May were shorter than the holes drilled in September and October when the new optimum machine parameters were tested. This indicates that the optimum machine parameters improved the drilling performance in phases 2 and 3 of the pit.
Conclusion
The performance of the Pit Viper drill rig at Rössing Uranium Mine, Namibia was evaluated. The rock properties determined and the drilling machine parameters were correlated to obtain regression models to be used for predicting the penetration and the drilling rate. The uniaxial compressive strength, Young's modulus, and the tensile strength were all higher in phase 2 than in phase 3. It was observed that the optimum drilling parameters obtained were slightly lower than those used by the drill operators.
The optimum machine parameters in phase 2 are rotary speed 78 r/min, air pressure 400 kPa, and feed pressure 330 kN. The mine currently uses a rotary speed of 75 r/min, air pressure of 400 kPa, and feed pressure of 350 kN in phase 2. The optimum machine parameters in phase 3 are rotary speed 82 r/min, air pressure 330 kPa, and feed pressure 300 kN. The mine currently use a rotary speed of 84 r/min, air pressure of 350 kPa, and feed pressure of 300 kN in phase 3.
The trial of the new optimum machine parameters revealed that there is a reduction in the cost of drilling per metre, which varied from N$29.48 to N$36. 31 per metre for tricone bits using the new machine parameters, and N$7.74 to N$39.5 per metre for drill pipes as compared to N$37.90 to N$ 107.20 per metre for tricone bits and N$12.97 to N$14.04 per metre for drill pipe with the standard parameters.
Acknowledgements
We acknowledge the administration and technical personnel of Rössing Uranium Mine, Namibia for providing an enabling environment for acquisition of data for this work. Also, Mr Wulff-Dieter Wieland is acknowledged for his assistance during data collection at the mine.
References
Adebayo, B. and Akande, J.M. 2015. Analysis of button bit wear and performance of down-the-hole hammer drill. Ghana Mining Journal, vol.15, no. 2. pp. 36-41. [ Links ]
Abraham. I.M. 2009. Geology and spatial distribution of uranium mineralisation in SK anomaly area, Rössing, area Namibia, MSc thesis, University of the Witwaterstrand, Johanesburg, South Africa. 180 pp. [ Links ]
Aipanda, T. 2011. Personal communication facing challenges head-on. Rössing Uranium Mine, Report of Stakeholders. Swakopmund. 15 pp. [ Links ]
Clark, I.E. and Shafto, G.R. 1987. Core drilling with Syndax 3 PDC. Industrial Diamond Review, vol. 47, no. 521. pp. 169-173. [ Links ]
Garnier, A.J. and Lingen, N.H.V. 1959. Phenomena affecting drilling rate at depth. Journal of Petroleum Technology, Transactions of AIME, vol. 217. pp. 232-239. [ Links ]
Hartman, H.L. 1962. Crater geometry relations in percussive drilling - single blos studies. Mine Quarry Engineering, vol. 28. pp. 530-536. [ Links ]
Horsrud, P. 2001. Estimating mechanical properties of shale from empirical correlations. SPEDrill, no. 16. pp. 68-73. [ Links ]
ISRM. 1989. Rock characterization testing on monitoring. ISRM Suggested Methods. Brown, E.T. (ed.). Pergamon Press, Oxford. p. 211. [ Links ]
Jiao, D. 1989. Analysis of variables affecting the performance of a hydraulic rotary percussive drill. PhD thesis, University of Newcastle-on- Tyne, UK. [ Links ]
Jimeno, CL., Jimeno, E.L. and Francisco, J.A. 1995. Drilling and Blasting of Rock. Balkema, Rotterdam. [ Links ]
Kahraman, S., Bilgin, C., and Feridunoglu, C. 2003. Dominant rock properties affecting penetration rate of percussive drills. International Journal of Rock Mechanics and Mining Sciences, vol. 40, no. 2. pp. 711-723 [ Links ]
Lummus, J.L. 1969. Factors to be considered in drilling optimization. Journal of Canadian Petroleum, vol. 8, no. 4. pp. 138-147. [ Links ]
Nguyen, V.G. 2011. The effect of weight on bit on dogleg severity of the wellbore. Scientific-Technical Journal of Mining and Geology, vol. 34. pp. 16-19. [ Links ]
Ozdemir L., Miller, R., and Wang, F.D. 1977. Mechanical tunnel boring, prediction and machine design. Annual report, CSM APR 73-07776-A03. Transportation Research Board. 250 pp. [ Links ]
Pearse, G. 1985. Hydraulic rock drills. Mining Magazine. pp. 220-231. [ Links ]
Rössing Uranium. 2013. History and location of Rössing. https://www.rossing.com/history.htm [accessed 17 November 2018]. [ Links ]
Sinkala, T. 1989. Hole deviations in percussion drilling and control measures. PhD thesis, Luleá University of Technology, Sweden. [ Links ]
Tandanand, S. and Unger H.F. 1975. Drillability determination - A drillability index of percussive drills. RI 8073. US Bureau of Mines. pp. 47-52. [ Links ]
Warren, T.M. 1984 Factors affecting torque for roller bits. Journal of Petroleum Technology. pp. 1500-1508. [ Links ] ♦
 Correspondence:
B. Adebayo
Email: baayoakinola@googlemail.com
Received: 2 May 2017
Revised: 19 May 2018
Accepted: 6 Aug. 2018
Published: May 2019
ORCiD ID: B.Abebayo. https://orchid.org/0000-0001-8954-5768

