


Serviços Personalizados
Artigo
 Inglês (pdf)
 Artigo em XML
 Referências do artigo
Indicadores

Links relacionados
-
 Citado por Google
 -
 Similares em Google
Compartilhar

 Permalink
Journal of the Southern African Institute of Mining and Metallurgy
versão On-line ISSN 2411-9717
versão impressa ISSN 2225-6253
J. S. Afr. Inst. Min. Metall. vol.119 no.4 Johannesburg Abr. 2019
http://dx.doi.org/10.17159/2411-9717/18/090/2019
PAPERS OF GENERAL INTEREST
Limiting the influence of extreme grades in ordinary kriged estimates
A. FourieI; C. Morgan; R.C.A. MinnittII
IHarmony Gold Mining Company Limited, Welkom, Free State, South Africa
IIHarmony Gold Mining Company Limited, South Africa
SYNOPSIS
The management of outlier grades in positively skewed gold distributions is a contentious issue. Incorporating outliers in standard ordinary kriging (OK) estimation procedures in a way that honours the data without smearing extreme grades into surrounding areas has been problematic. Cutting or capping of outliers to mitigate their influence in estimation techniques is common practice, while methods that manipulate the OK system of equations fail to honour the data. We propose a method of post-processing of kriging weights that provides realistic OK estimates and mitigates smearing without manipulating kriging equations or changing the original grades. The method requires that the data is not clustered, is approximately equally spaced, and is of the same support. Positively skewed data is ordered on attribute grade and nonlinearly transformed to a Gaussian histogram of categorical bins whose frequency is based on their likelihood of occurrence and location in the sample distributions. Factors that restrict kriging weights are calculated by dividing the percentage frequency of data in each bin by the percentage frequency of data in the bin with the highest frequency. Restriction factors applied to the kriging weights in the OK estimation restrict the range of influence in proportion to their probability of occurrence in the distribution. Smear reduction post-processing is easy to implement and addresses issues arising from negative kriging weights while considering the spatial location of samples, the sample grades, and their probability of occurrence. The method mitigates both smoothing and conditional bias .
Keywords: Outliers, reduced smearing post-processing, range of sample influence.
Introduction
Outliers are sample observations that deviate considerably from the standard or expected (Hawkins, 1980). These deviations can be high or low in grade depending on the distribution. The presence of outliers in a mine sampling campaign could provoke mixed reactions. Mining engineers might view high-grade outliers as a promise of achieving higher grades, while the geostatisticians view outliers as affecting the accuracy and precision of the overall estimate, among other issues. Having identified outliers, the geostatistician must decide how to account for their presence and treat them so that true underlying estimates are not distorted. Advanced knowledge of the deposit allows the geostatistician to identify and treat outliers acceptably, especially where samples are limited in number and the true grade distribution is uncertain. If ignored, or treated incorrectly, outliers are likely to lead to smearing of extreme grades into the surrounding estimates, thereby steering regions towards potential under- or over-estimation.
Methods of identifying outliers, the way they arise, and ways of dealing with them are considered. A description of current approaches to dealing with the smearing effects of outliers in kriging estimates is followed by a new method for mitigating over- and under-estimation of grade in areas immediately adjacent to outliers. Restriction factors are calculated and applied in a post-processing step to all kriged values, constraining smearing effects to an appropriate area around the outliers. The effectiveness of the method is demonstrated using face chip sample results taken along a raise in a deep-level gold mine in the Free State Province of South Africa.
Kriging, as with all minimum mean-square error spatial estimators, tends to smooth estimates due to its weighted averaging routine (Isaaks and Srivastava, 1988; Deutsch and Journel, 1998). Smoothing of kriged estimates can be detected and modelled using cross-validation, but the method also results in systematic errors and an inability to reproduce the semivariogram (Olea and Pawlowsky, 1996). Ordinary kriged estimates using data containing uncapped outliers are compared with the newly proposed method of post-processing ordinary kriging (OK) weights. The method applies a weight reduction factor based on the likelihood of outlier occurrence and the restrictions on their spatial continuity. Issues related to honouring the data and negative kriging weights associated with an outlier are considered. This tool provides more reliable and realistic OK estimates in areas surrounding outliers.
Identifying and dealing with outliers
Outliers could be the result of sampling or assaying error, or could simply be due to the highly erratic nature of the grades in the orebody. Nevertheless, the user must decide whether to accept or reject unrepresentative or outlying observations in the data-set (Barnett and Lewis, 1979). Many orebodies display highly skewed distributions (Krige, 1999), with sample observations from the tail of the distribution often being considered as extreme grades or outliers. The presence of outliers in a small sample set introduces many problems, including excessive variability into measures such as mean and variance, and under- or over-estimation or smearing of extreme grades (Sinclair and Blackwell, 2004).
Outliers may be capped or removed from the data-set, or treated as a separate population (Sinclair and Blackwell, 2004), but assuming sampling and assaying are correct, the outlier must be considered a legitimate member of a continuous population distribution (Krige, 1999) and cannot be ignored. Ordinary kriging, a linear weighting estimation method, is known to smear outlier grades into surrounding areas (Pan, 1994), especially where sample numbers are limited. With limited data, outliers can disproportionately inflate the tail-end estimates of a distribution relative to the true grades. The proposed post-processing solution avoids the smearing of outlier grades into surrounding areas where sample coverage is limited once outliers in the sample data have been identified.
Sampling methods
Poor sampling methods introduce not only error or bias in sample assay results (Gy 1979, 1982; Pitard 1993), but may also result in outliers or extreme grades (Fourie and Minnitt, 2013). However, not all outliers are a result of poor sampling, but may be an integral part of the naturally occurring positively skewed distribution for gold. If the extreme value, defined here as an 'outlier', is part of a naturally occurring distribution, the grade is taken as true and must be honoured at that point. However, when performing an estimation, its influence on the surrounding areas should be restricted. For any estimation technique including kriging, the sample grades are the best unbiased estimators of grade at that point. So whatever estimation technique is used should honour the sample points unless it is known that there is sampling error associated with that value. If there is doubt about the validity of the outlier, it should be re-assayed or omitted. Sampling by diamond drill core generally results in better sample extraction, whereas chip sampling can introduce both errors and bias (Cawood, 2003; Freeze, Flitton. and Pillay, 2013; Magri and McKenna, 1986). The decision about how outliers should be treated, depends on whether they originate from natural causes, such as the occurrence of coarse gold nuggets (Dominy, 2010), or as a result of sampling errors. Erroneous outlying results that cannot be rectified should be removed.
Facies and geological domains
Sample data should be assigned to facies or domains, characterized by well-defined geological features or properties, before outliers are identified (Krige, 1999). Geostatistical problems related to outliers include inaccurate semivariogram modelling (Krige and Magri, 1982). Some practitioners have been known to ignore outliers during semivariogram modelling, but they reintroduce and include them during resource estimation (Sinclair and Blackwell, 2004). Exploratory data analysis should identify outlier grades as those that do not form part of the distribution. Extreme grades in a positively skewed distribution usually occur as discontinuous points at the very high-grade end of the tail.
Areas characterized by samples with distinctive spatial and grade attributes can be disaggregated into well-defined domains in which samples are treated differently from those in adjacent domains (Sinclair and Blackwell, 2004). Outliers are then classified as observations that deviate significantly from other members of the domain in which they occur (Barnet and Lewis, 1979).
Methods for identifying outliers
Once erroneous sample data has been corrected or removed, and remaining grades have been assigned to a specific geological domain, the outliers can be identified using graphical methods such as histograms, quantiles, probability plots, and semivariogram plots (Srivastava, 2001; Babakhani, 2014). Outliers can also be identified using a cross-validation plot. A popular industry method for identifying extreme values is to set a percentile threshold; any value exceeding this threshold is classed as an outlier (Parker, 1991).
Current methods of addressing smearing of outlier grades into kriging estimates
Once they have been identified, the options regarding the treatment of outliers include leaving them unchanged, removing or cutting them, or reducing their influence through capping (Sinclair and Blackwell, 2004). Sound judgement and good reasons should support whichever method is employed because hard-and-fast rules about treating outliers do not exist. Most practitioners quote a single value above or below which datapoints are classed as outliers. Although capping is a common technique (Sinclair and Blackwell, 2004; Babakhani, 2014), it is possible to use capping or lower percentiles to mask underlying mining issues. Consultants making a first visit to a mining operation, should probably accept current mine practice for handling outliers and suggest necessary changes once the effects of outlier treatment have been observed. OK is a linear weighting estimation technique that attributes kriging weights to samples within the defined search radius, and depending on sampling density and the range of influence, one extreme value in a set of data can produce a bias in many surrounding estimates. Despite the well-meaning intention of capping to reduce the influence of outliers in kriged estimation results, high grades are still smeared into surrounding areas (Leuangthong and Nowak, 2015), particularly if the data is limited. The smearing of kriged grade into areas adjacent to outliers is the problem addressed in this paper.
Cressie and Hawkins (1980) proposed robust kriging as a means of reducing the effect of outliers in Ore Reserve estimation, a technique that was confirmed by Costa (2003). According to Cressie (1991) the method involves downweighting outliers using neighbouring grades, and recalculation of the original OK weights before final estimation. The actual data grades are edited through a winsorizing approach, which according to Dixon (1960) involves replacing extreme grades of a data-set with a certain percentile value from each end to obtain a less skewed distribution. Winsorizing is acceptable if there is certainty that an extreme value is a legitimate member of the distribution, but for outliers belonging to a different distribution, trimming is more acceptable (Cross Validated, 2018).
Outlier restricted kriging, another method of mitigating the effects of outliers, was proposed by Arik (1992). This method edits the OK matrix by introducing the additional requirement that the weights of the outliers sums to the probability of their occurrence. In this approach, an additional Lagrange multiplier is used, and an additional row and column in the kriging matrix. Outlier restricted kriging adjusts the kriging weights through an additional requirement that the weights of the outliers sum to the probability of outlier occurrence. Other methods proposed by Deutsch, Boisvert, and Deutsch (2011) and Rivoirard et al., (2013) include moving outliers to a higher dimension and a decomposition of the grade variables, respectively. The outlier resistance of simulation approach was proposed by Babakhani (2014) as a means to determine the cutting level for kriging and other estimation techniques. This approach was further developed by Chiquini and Deutsch (2017), who proposed the use of simulation to calibrate a cutting level for estimation.
Both robust kriging and outlier restricted kriging modify the OK system prior to estimation, and neither approach is an exact interpolator of the outlier value. The approach taken in this paper does not adjust the OK system of equations, but rather applies a post-processing approach after estimation that honours all the sample points.
New proposed method for addressing smearing of outlier grades into kriging estimates
The post-processing method proposed here for overcoming the smearing effect of outlier grades into surrounding kriging estimates is based on the much lower probability of occurrence and sparsity of outliers in positively skewed distributions. Smearing of grade occurs because kriging weights are only related to the spatial distribution of sample points relative to the point being estimated, taking no cognizance of the actual sample grades. Based on their low probability of occurrence, outliers should also have a smaller range of sample influence (ROSI), meaning that kriging weights associated with outliers should also be reduced.
The proposed method is a three-stage post-processing procedure that does not interfere with the OK matrix. Based on probability of occurrence, both high- and low-grade outliers can occur in a positively skewed distribution, although low-grade outliers are not usually recognized or eliminated. Firstly, these high- and low-grade outliers in the highly positively skewed distribution must be identified; secondly, restriction factors based on the probability of outlier occurrence are calculated; and thirdly, factors that reduce the weights for the grade contribution to estimates are applied, so that the influence of extreme grades is constrained to an acceptable fringe around the outlier. The size of this acceptable fringe is somewhat subjective, but is determined by the qualified and experienced practitioner. This postprocessing procedure is demonstrated through a one-dimensional kriging example.
Successful application of the proposed technique requires firstly, that the data be approximately equally spaced since the method is not effective if outliers are clustered. If data is clustered, domaining should be considered so that the data in that domain provides a reliable indication of continuity of grade at the most common sampling distance. Secondly, the data should all be of the same support in order to mitigate the potentially erroneous mixing of distributions with different support.
Identifying low- and high-grade outliers
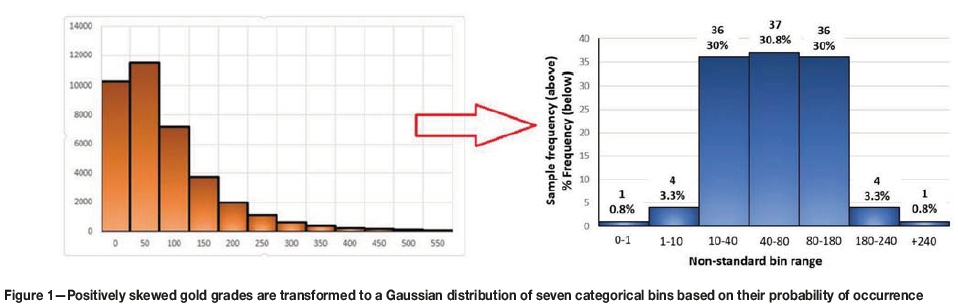
Rarely are outliers found adjacent to one another; they are typically very high or very low isolated grades with a low probability of occurrence and a low ROSI. This method uses the fact that gold grades in a positively skewed distribution can be transformed into a Gaussian distribution of categorical variables, as shown in Figure 1, based on their probability of occurrence. There is no hard-and-fast rule or template for undertaking this procedure. In this particular example seven bins were selected and a 0.8% probability of occurrence for extreme outliers was considered adequate. The choice of the number of bins and the probability of occurrence depends on the distribution of the data and should be supported by the final validation. This determines how much constraint one would like to place on the outlier influence. The sample frequency (above) and percentage frequency (below) are shown at the top of each bin in Figure 1. Implementation is subjective, as the application is potentially sensitive to the number of bins and the percentage used. However, it depends on the deposit type. The method is subjective, but it is no more subjective than selecting a capping threshold or selecting an appropriate estimation technique. Ultimately the results need to be validated by a knowledgeable practitioner. It is important, as far as possible, to verify that the method produces results that can be reconciled with production data. The mining practitioner's experience, knowledge of the orebody, and visual confirmation of sample behaviour is important for the choice of the number of bins and the probability of occurrence of outliers.
Grades at the ends of the distribution are identified by ordering the data from lowest to highest, so the low- and high-end bins, comprising the lower and upper 4.1% of the overall distribution, each contain five data grades classed as outliers, based on their probability of occurrence. This is a nonlinear transformation of positively skewed data to a Gaussian distribution of categorical bins. In this case, data is assigned to one of seven equally spaced categories from bin 1 to bin 7, depending on each sample's probability of occurrence in the distribution. Low-grade outliers, which occur only 0.8% and 3.3% of the time in the distribution, are assigned to bins 1 and 2, respectively, whereas high-grade outliers that only occur 0.8% and 3.3% of the time are assigned to bins 6 and 7 (Figure 1). The four bins containing outliers in this particular example occur in the upper and lower tails of the distribution. The central 90.8% of data is assigned to bins 3, 4, and 5, having percentage frequencies in this example of 30%, 30.8%, and 30%, respectively (Figure 1). These percentages are illustrative for this example, but it is left to the practitioner to determine the optimal bin frequencies for a particular mineral deposit.
Range ofsample influence (ROSI)
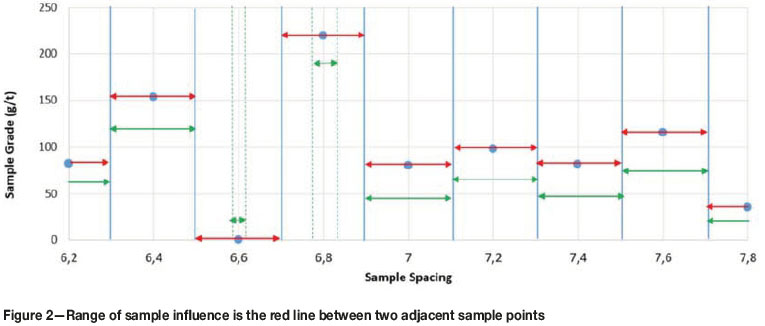
The ROSI is the influence range of the grade between two adjacent sample points and is defined as half the distance between the sample and its adjacent sample, as shown in Figure 2.
The ROSI for each sample in a standard kriging equation is shown as a red line in Figure 2. Samples with average grades, the green and red arrows, have the same range of sample influence. The range of sample influence for outliers, shown as short green lines, is reduced because their frequency of occurrence is low. Hence the very low outlier at 6.6 m and the very high outlier at 6.8 m (Figure 2), should have shorter ranges of influence than samples close to the average grade.
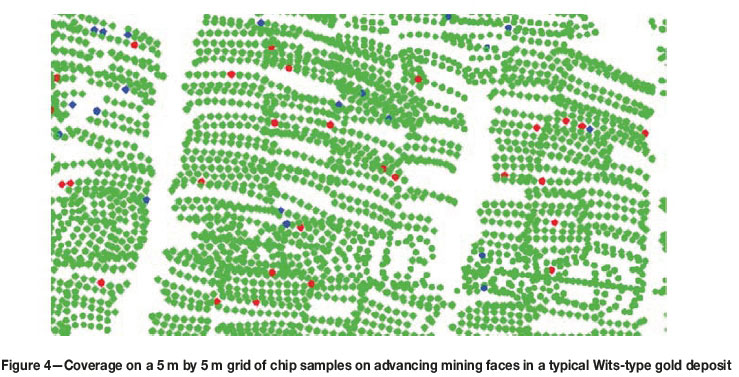
The ROSI for the one-dimensional, equally spaced samples at 20 cm intervals in Figure 3 is 20 cm, being 10 cm to the left and 10 cm to the right of each sample point. For the chip sampling shown in Figure 4 the ROSI is defined as a block centred on each sample extending 2.5 m north, east, south, and west of that sample, which is a 5 χ 5 m block. The colours of the samples in Figures 3 and 4 correspond to their probability of occurrence in the distribution. High and low outlier data, shown in red, occur infrequently and occupy bins 1 and 7 at the extreme ends of the distribution in the lowest 1% and highest 1% of the data grades. The next most frequently occurring data, shown in green, occupies bins 2 and 6 with a frequency of occurrence of 4% for the lowest 4% and highest 4% of data grades, whose spatial continuity and probability of occurrence is less than that for the yellow samples. The most frequently occurring grades, shown in yellow, lie between 10 g/t and 180 g/t in the central 90% of the distribution and occupy bins 3, 4, and 5 in the range between the 5% and 95% (Figure 3). The continuity from one sample and the next is high, meaning that the ROSI of 10 cm on either side is valid and restriction factors are null to low. Based on their probability of occurrence and limited continuity, the ROSI for the green and red samples should be less than 10 cm.
In typical mining situations the spacing between samples on the mining face, in winzes, shafts, and on conveyor belts is likely to be very similar for each sample setting. Evenly spaced chip samples on a two-dimensional 5 χ 5 m sample spacing over large areas is typical of the routine production or chip sampling that is conducted in Witwatersrand-type gold deposits in South Africa, shown in Figure 4. Shallow-dipping, narrow conglomeratic and carboniferous reefs contain pyrite and finely disseminated gold mineralization; no clustering of extreme grades is evident in Figure 4. The lowest 5% of grades are shown in blue and highest 5% in red. The remaining grades, between 5% and 95%, are shown in green.
The data is ordered from lowest to highest by attribute value and potential outliers are found in the upper and lower frequency bins holding 0.8% and 3.3% of the data, respectively. Based on their probability of occurrence, outliers have a shorter ROSI compared to other data in the set. For this reason, the OK weights assigned to extreme data should be restricted accordingly.
Calculation of restricted kriging weights
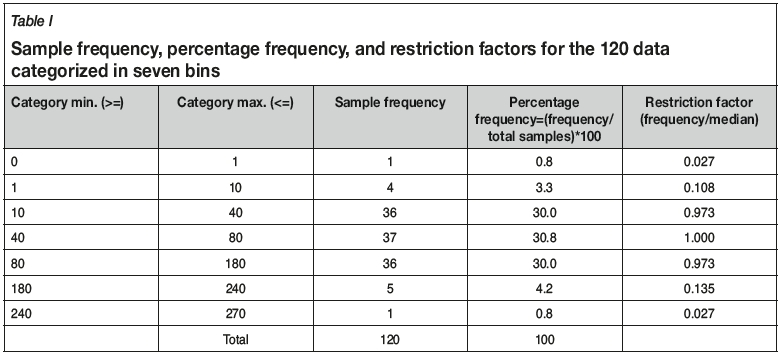
A kriging weight reduction factor is assigned to all sample grades lying within bins whose percentage frequency is less than the median frequency of bin 4, namely, 30.8% as shown in Table I. The weight restriction factors are calculated by measuring the frequency of occurrence of data in each of the categorical bins as a percentage of total frequency of bin 4. The frequency of data in bins 1 and 7 is 1 in 120 samples, so the percentage frequency is equal to 1/120, or 0.8%, and the weight restriction factor for each bin is therefore 0.8 % divided by 30.8%. or 0.027, as shown in Table I. Similarly, in bins 2 and 6 there are 4 and 5 samples respectively, with percentage frequencies of 3.3% and 4.2%, equating to weighting restriction factors of 0.108 and 0.135. The weight restriction factors for bins 3, 4, and 5 are likewise 0.973, 1.000, and 0.973, respectively (Table I).
Reduced smearing post-processing (RSPP)
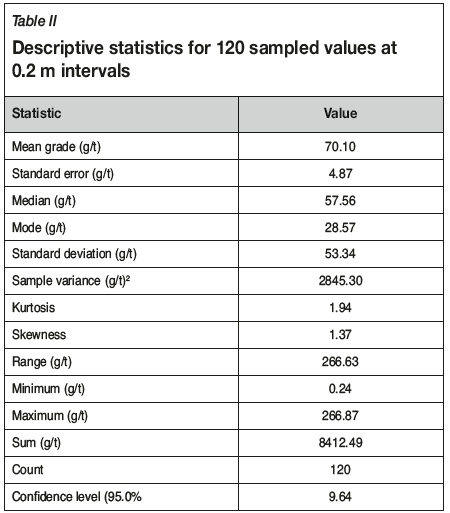
Due to the variability of grades typically found in gold deposits and because OK is a linear arithmetic averaging technique, the output is likely to be smoothed and subject to conditional bias, but the occurrence of outliers will exacerbate the problem. The RSPP approach applies a weight reduction factor to the OK weights for each sample, such that the estimate at a given sample point is honoured. The OK weight of each sample is recalculated based on the categorical bin in which it occurs. Using the percentage frequency and restriction factors provided in Table I, consider a basic example for a point informed and estimated by five nearby samples. The grades 3, 65, 83, 48, and 266 g/t have OK weights of 0.18, 0.25, 0.09, 0.31, and 0.17 respectively, so that the linear weighted sum of the grades is 84.4 g/t. The reduced smearing post-processing (RSPP) approach using the restriction factors listed in Table I returns a grade of 39.7 g/t using exactly the same sample data. Descriptive statistics for this data are shown in Table II.
Whereas OK weights must sum to 100% for each estimate, weights calculated by the RSPP method do not. The RSPP approach considers both the spatial positioning of a sample relative to the block being estimated and the value of samples used to make the estimate. A restriction factor is applied to all weights except those arising from samples occurring inside the median bin, namely bin 4 (Table I).
Implementation of reduced smear post-processing
The following examples illustrate the effectiveness of RSPP in mitigating an over-estimation of ordinary kriged grade around a high-grade outlier along a one-dimensional environment. It is assumed that the sampling was done correctly and that no sampling errors are included in the assay grades. This example is based on actual face-chip sampling results from a deep-level gold mine in the Free State Province of South Africa. The data forms part of an investigation into the effect of chip sampling of carboniferous reef types (Fourie and Minnitt, 2013), where the samples were extracted at 0.2 m intervals to model the variability of grades over very short intervals.
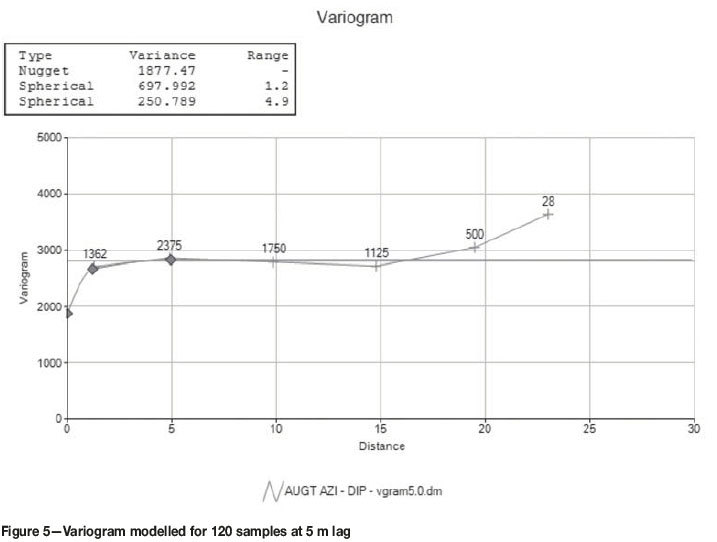
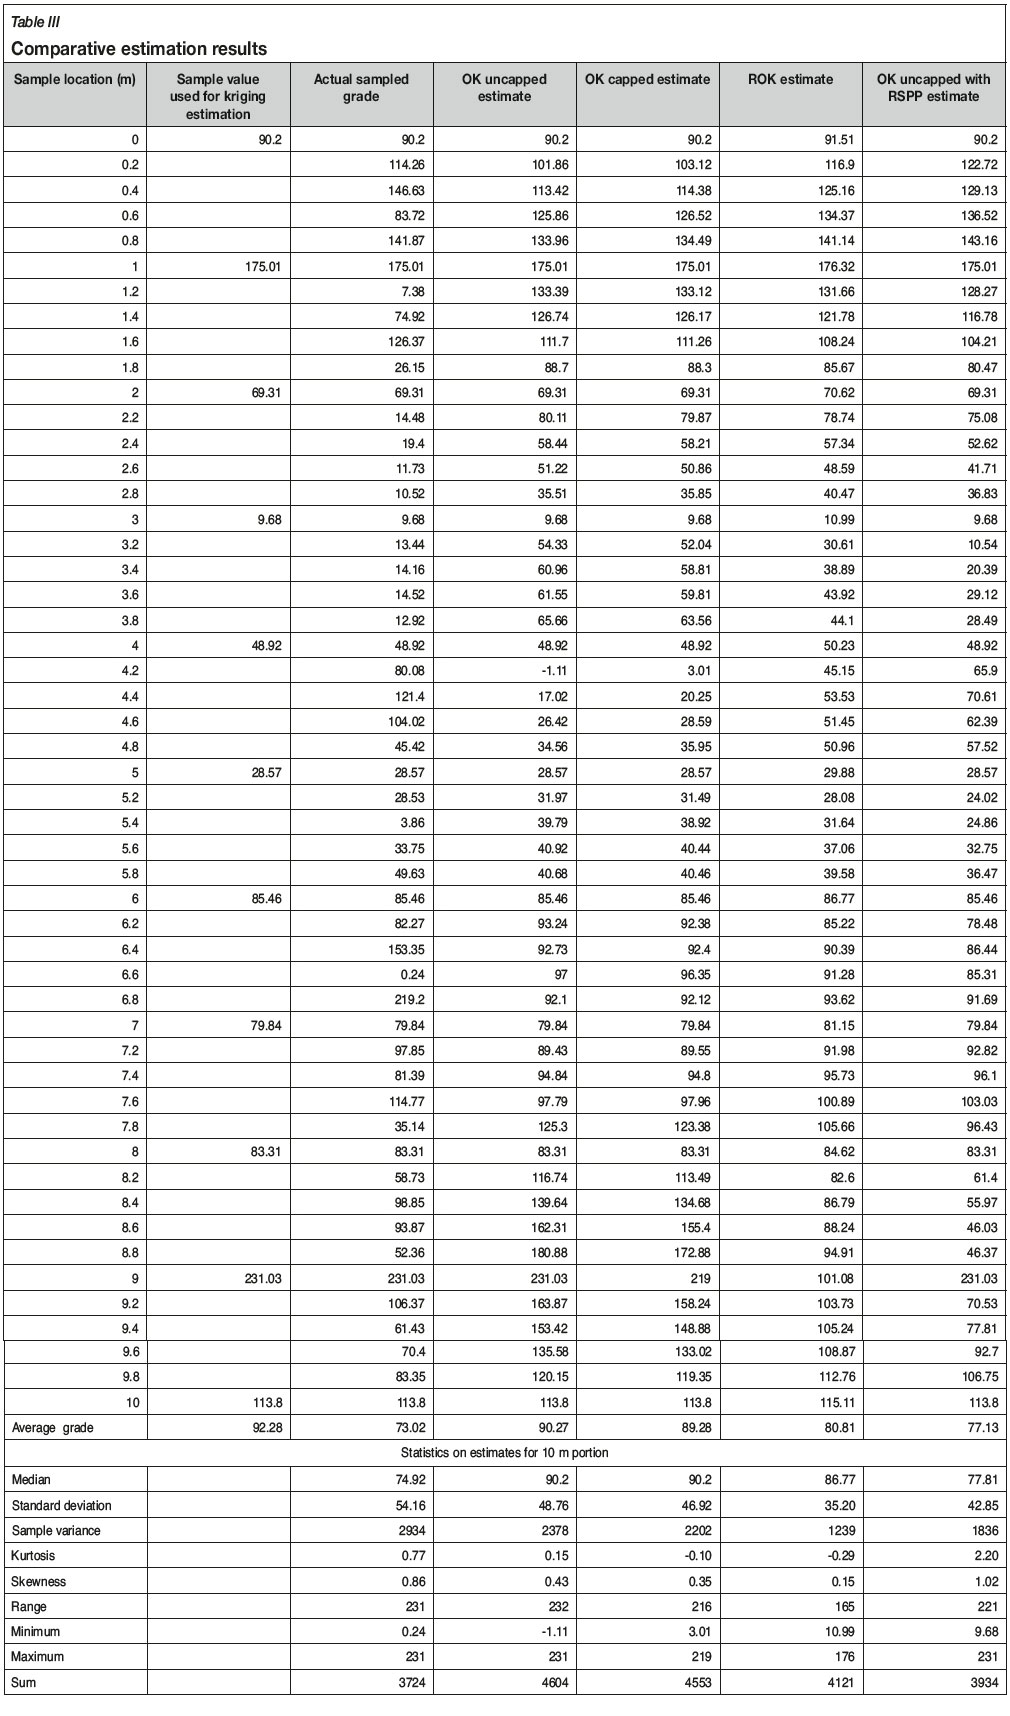
A variogram (Figure 5) was compiled from the sample data, and OK was used to estimate grades selected at 1 m intervals (starting at zero metres). Four different estimation regimes were considered: OK with uncapped data, OK with data capped to the 98th percentile, restrictive ordinary kriging (ROK), and finally OK of uncapped data with the RSPP technique proposed. The sample data and OK estimates obtained are listed in Table III.
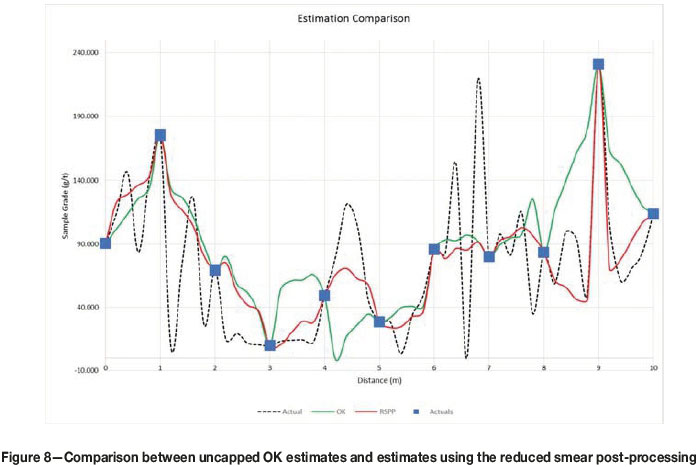
Of the four methods applied, the RSPP technique provides a mean grade of 77.13 g/t Au, which is closer to the actual sampled grade of 73.02 g/t Au than any of the other methods. The estimates obtained from the four different methods are plotted in Figure 8.
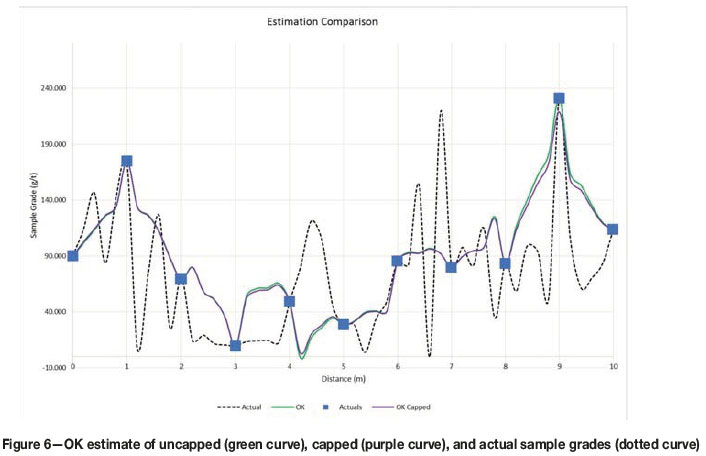
OK estimate of uncapped and capped versus actual sample grade
The visual representation of estimates obtained using OK without capping is shown as the green curve in Figure 6, and indicates a poor match between the variability of sample data and variability of block grade estimates.
This well-known smoothing characteristic of kriged estimates means that OK cannot reproduce the local variability in the original sample data in the estimated block grades. Instead there is smoothing of the estimated block grades such that Var Z* = Var Z0 - SKVAR (Chiles and Delfiner, 2012). The erroneous spread of the estimated grade (smearing) between positions 8 and 10 is due to the single high-grade sample at position 9. This single outlier results in an over-estimation of the gold content in regions adjacent to sample 9 between points 8 and 10. In addition to the problems associated with the outlier at sample location 9, negative kriging weights in the region to the right of sample 4 will result in poor estimation between sample points 3 and 5 (Figure 6). Because this is a simple linear one-dimensional point estimate example, a well-defined qualitative kriging neighbour analysis was not relevant to the illustration and therefore negative weights appear. Nevertheless, the RSPP method reduces the negative weights accordingly.
The OK estimates using sample data capped to the 98th percentile and uncapped sample data are compared in Figure 6. Capping the data, one of the most common techniques for mitigating the effects of high-grade outliers, smears the estimates between sample positions 8 and 10. Neither does it resolve problems associated with the negative OK weight occurring between samples 3 and 5. Thus, capping alone does not alleviate the smoothing or the estimation effect of the negative kriging weights.
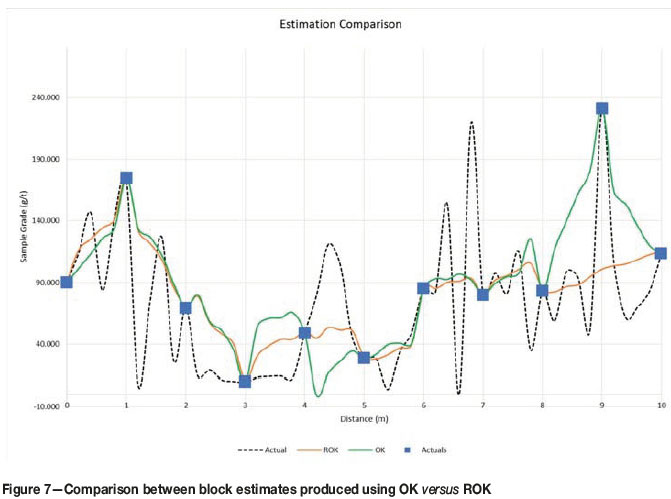
OK estimate of uncapped data versus restrictive OK (ROK)
The difference in OK and ROK block estimates, especially in regard to the influence of outliers between samples 3 and 5 and at sample location 9, as shown in Figure 7, is noteworthy. ROK mitigates the over-estimation of block grades between samples 8 and 10, and returns a quite different estimate to OK in the region affected by negative kriging weights, between samples 3 and 5.
The average ROK estimate of 80.81 g/t Au is significantly less than the 90.27 g/t Au OK estimate using uncapped data. The actual average grade of 73.02 g/t Au is the true in-situ grade (based on the 0.2 m sampling distance) and is lower than both kriging estimates at 1 m sample intervals. However, ROK does not honour the sample value at point 9, and furthermore requires a restructuring of the kriging system of equations (Arik, 1992).
Uncapped OK estimate versus RSPP of the same estimate
Results obtained from the RSPP method applied to the OK estimates of uncapped data are shown in red in Figure 8. Again, the high-grade smearing between locations 8 and 10 is mitigated, while still honouring the data at location 9 and not requiring any changes to the OK system of equations. The estimates between sample locations 3 and 5 are also improved, as the negative OK weights assigned to the outlying value is reduced by the postprocessing reduction factor.
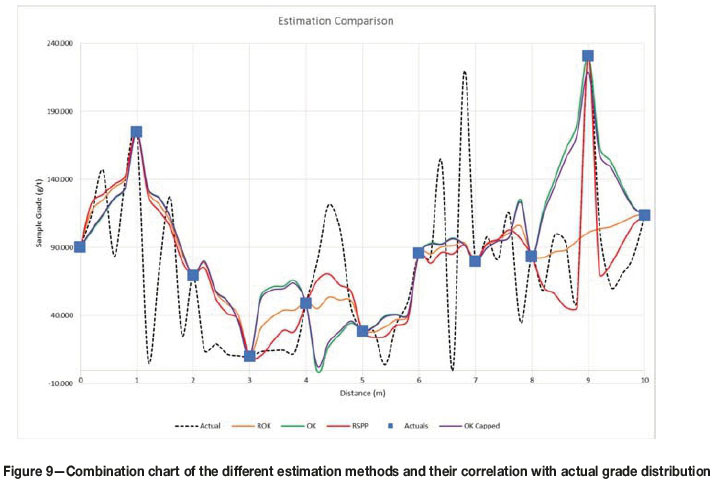
Estimates produced by all four kriging techniques are compared in Figure 9, showing the superior results of the RSPP in terms of smearing and dealing with negative kriging weight associated with an outlier. The benefit of RSPP over the ROK is that no adjustments need to be made to the OK system of equations. This implies that RSPP can be applied to any commercial package offering OK without any additional editing of source code. The RSPP estimates have an average grade of 77.13 g/t Au, which is much nearer to the true grade 73.02 g/t and is significantly lower than the OK estimate of 90.27 g/t Au.
Conclusions
The capping of high-grade sample grades prior to kriging estimation in an attempt to mitigate the smearing of higher grades into lower grade areas is inefficient in this worked example, and does not achieve much by way of improvement in the estimates. Restricted OK (ROK) fails to honour the sample data and requires manipulation of the OK system of equations.
The method proposed here involves an adjustment of the OK weights that identifies outliers and calculates a weight reduction factor based on the likelihood of occurrence. This significantly removes smearing while still honouring the data and addresses issues arising from negative kriging weights associated with an outlier. It is easy to implement with most software, because it is merely a post-process and does not require additional computing time to changes the OK system of equations. The smear reduction post-processing method complements the OK weight calculation process by considering the spatial location of samples relative to one another and the point being estimated, as well as the actual sample grades and their probability of occurrence.
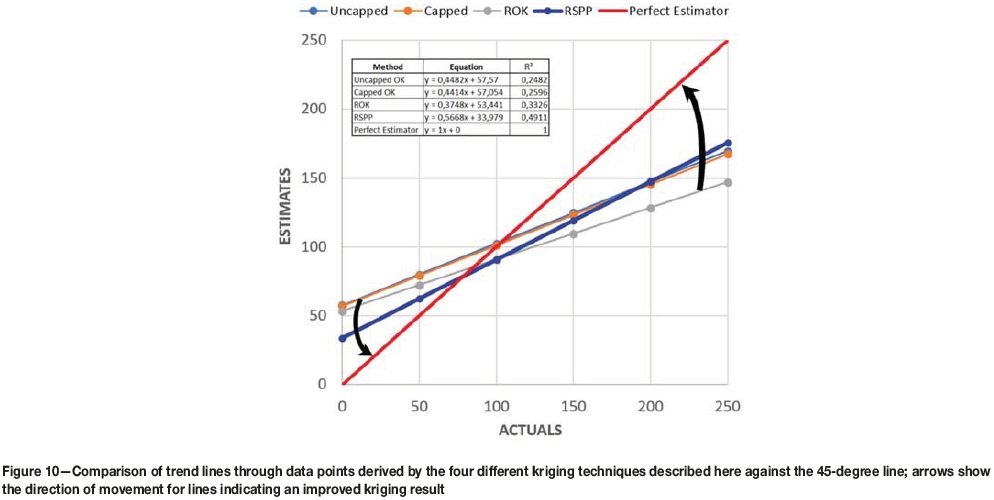
The RSPP method will not remove the conditional bias, but it will definitely mitigate this age-old problem in geostatistical estimation techniques, as illustrated in Figure 10.
Figure 10 shows a comparison of the outcomes of the different kriging methods using trend lines for the different data-sets and the 45-degree line representing perfect correlation between actual and estimated grades. This plot indicates that the thick blue line, representing the RSPP method, is rotated considerably more towards the 45-degree line than any of the other trend lines. Another important aspect is that the R2 value for the correlation coefficient of the RSPP method is about twice that for the uncapped and capped OK methods, and significantly better than for the ROK technique. This indicates that the RSPP estimates are considerably less smoothed than the kriging outputs from the other techniques and hence RSPP goes a long way towards balancing the tensions between smoothing and conditional bias.
References
Arik, A. 1992. Outlier restricted kriging: a new kriging algorithm for handling of outlier high grade data in ore reserve estimation. Proceedings of the 23rd International Symposium on the Application of Computers and Operations Research in the Minerals Industry. Kim, Y.C. (ed.). Society of Mining Engineers, Littleton, CO. pp. 181-187 [ Links ]
Barnett, V. and Lewis, T. 1979. Outliers in statistical data. Physics Today, vol. 32, no. 9, September 1979. p. 73. [ Links ]
Babakhani, M. 2014. Geostatistical modeling in presence of extreme values. MSc thesis, Department of Civil and Environmental Engineering, University of Alberta, Edmonton, Canada. 85 pp. [ Links ]
Cawood, F.T. 2003. Underground face sampling on narrow gold reefs. Sampling practice and its impact on the Mine Call Factor on Witwatersrand gold mines: Lessons learned. Journal of the Institute of Mine Surveyors of South Africa, vol. XXXI, no. 7. pp. 202-216. [ Links ]
Chiles, J.P. and Delfiner, P. 2012. Geostatistics: Modeling Spatial Uncertainty. Wiley, New York [ Links ]
Chiquini, A.P. and Deutsch, C.V. 2017. A simulation approach to determine the cutting level. Geostatistics Lessons. Deutsch, J.L. (ed.). http://www.geostatisticslessons.com/lessons/simulationcutting [ Links ]
Costa, J.F. 2003. Reducing the impact of outliers in ore reserves estimation. Mathematical Geology, vol. 35, no. 3, April 2003. pp. 323-345. [ Links ]
Cressie, N.A.C. 1991. Statistics for Spatial Data. Wiley, New York. 920 pp. [ Links ]
Cressie, N.A.C. and Hawkins, D.M. 1980. Robust estimation of the variograms. Mathematical Geology, vol. 12, no. 2. pp. 115-125. [ Links ]
Cross Validated. 2018. What are the relative merits of Winsorizing vs. Trimming data? https://stats.stackexchange.com/questions/90443/what-are-the-relative-merits-of-winsorizing-vs-trimming-data [accessed 20 January 2018]. [ Links ]
Deutsch, J., Boisvert, J., and Deutsch, C. 2011. New dimension to account for sample error and volume support in resource estimation. Transactions of the Society for Mining, Metallurgy, and Exploration, vol. 330. pp. 598-605. [ Links ]
Deutsch, C.V. and Journel, A.G. 1998. GSLIB: Geostatistical Software Library and User's Guide. 2nd edn. Applied Geostatistics Series. Oxford University Press, New York. 369 pp. [ Links ]
Dixon, W.J. 1960. Simplified estimation from censored normal samples. Annals of Mathematical Statistics, vol. 31. pp. 385-391 [ Links ]
Dominy, S. 2010. Sampling high-nugget effect gold deposits workshop. Snowden Mining Industry Consultants Limited, Ballarat, Australia. September 2010 [ Links ]
Fourie, D. and Minnitt, R.C.A. 2013. The simulated chip-sample model as a method for quantifying error and bias in sampling thin carboniferous reef type, South Africa. Proceedings of Sampling and Analysis: Best-practice in African Mining 2013, Misty Hills, Muldersdrift. Southern African Institute of Mining and Metallurgy, Johannesburg. [ Links ]
Freeze, Β., Flitton, T., and Pillay, A. 2013. Quality control and assurance of underground chip sampling at Kopanang Mine, South Africa. Proceedings of Sampling and Analysis: Best-practice in African Mining 2013, Misty Hills, Muldersdrift. Southern African Institute of Mining and Metallurgy, Johannesburg. [ Links ]
Gy, P.M. 1979. Sampling of Particulate Materials, Theory and Practice. Developments in Geomathematics 4. Elsevier Scientific Publishing. [ Links ]
Gy, P.M. 1982. Sampling of Particulate Materials Theory and Practice. 2nd revised edn. Elsevier, Amsterdam. 431 pp. [ Links ]
Hawkins, D.M. 1980. Identification of Outliers. Chapman and Hall, London and New York. 188 pp. [ Links ]
Hawkins, D.M. and Cressie, N.A.C. 1984. Robust kriging - A proposal. Journal of the International Associationfor Mathematical Geosciences, vol. 16, no. 1. pp 3-18. [ Links ]
Isaaks, E.H. and Srivastava, R.M. 1988. Spatial continuity measures for probabilistic and deterministic geostatistics. Mathematical Geology, vol. 20, no. 4. pp. 313-341. [ Links ]
Krige, D.G. 1999. Essential basic concepts in mining geostatistics and their links with geology and classicwal statistics. South African Journal of Geology, vol. 102, no. 2. pp. 147-151. [ Links ]
Krige, D.G. and Magri, E.J. 1982. Studies on the effects of outliers and data transformation on variogram estimates for a base metal and a gold ore body. Mathematical Geology, vol. 14, no. 6. pp. 557-564. [ Links ]
Leuangthong, O. and Nowak, M. 2015. Dealing with high-grade data in resource estimation. Journal of the Southern African Institute of Mining and Metallurgy, vol. 115. pp. 27-36. [ Links ]
Magri, E.J. and McKenna, P. 1986. A geostatistical study of diamond-saw sampling versus chip sampling. Journal of the South African Institute of Mining and Metallurgy. vol. 86, no. 8. pp. 36-37. [ Links ]
Olea, R.A. and Pawlowsky, V. 1996. Compensating for estimation smoothing in kriging. Mathematical Geology, vol. 28, no. 4. pp 407-417. [ Links ]
Pan, G. 1994. Restricted Kriging: A link between sample value and sample configuration. Mathematical Geology, vol. 26, no. I. pp. 135-155. [ Links ]
Parker, H.M. 1991. Statistical treatment of outlier data in epithermal gold deposit reserve estimation. Mathematical Geology, vol. 23, no. 2. pp. 175-199. [ Links ]
Pitard, F.F. 1993. Pierre Gy's Sampling Theory and Sampling Practice. 2nd edn, July 1993. CRC Press, Boca Raton, FL. [ Links ]
Rivoirard, J., Démange, c., Freulon, X., and Lécureuil, A, 2013. A top-cut model for deposits with heavy-tailed grade distribution. Mathematical Geosciences, vol. 45, no. 8. pp. 967-982. [ Links ]
Sinclair, A.J. and Blackwell, G.H. 2004. Applied Mineral Inventory Estimation. Cambridge University Press, UK. [ Links ]
Srivastava, R.M. 2001. Outliers - A guide for data analysts and interpreters on how to evaluate unexpected high values. Contaminated Sites Statistical Applications Guidance Document no. 12-8. Province of British Columbia, Canada. 4 pp. https://www2.gov.bc.ca/assets/gov/environment/air-land-water/site-remediation/docs/guidance-documents/gd08.pdf [ Links ]
 Correspondence:
A. Fourie
Dries.fourie@vodamail.co.za
Received: 25 May 2018
Revised: 26 Sep. 2018
Accepted: 21 Aug. 2018
Published: April 2019

