


Services on Demand
Article
 English (pdf)
 Article in xml format
 Article references
Indicators

Related links
-
 Cited by Google
 -
 Similars in Google
Share

 Permalink
Journal of the Southern African Institute of Mining and Metallurgy
On-line version ISSN 2411-9717
Print version ISSN 2225-6253
J. S. Afr. Inst. Min. Metall. vol.119 n.4 Johannesburg Apr. 2019
http://dx.doi.org/10.17159/2411-9717/605/2019
GEOMETALLURGICAL EDITION
Key aspects of bench flotation as a geometallurgical characterization tool
V. RossI, II
IMintek, Randburg, South Africa
IIUniversity of the Witwatersrand, Johannesburg, South Africa
This paper was first presentedat the Furnace Tapping 2018 Conference, 15–16 October 2018, Nombolo Mdhluli Conference Centre, Kruger National Park, South Africa.
SYNOPSIS
Bench-scale flotation tests play a major role in the geometallurgical process value chain. Despite their apparent simplicity, these tests pose pitfalls in terms of operation, as well as the interpretation and modelling of results. In this paper we highlight key aspects to consider in generating accurate and reproducible experimental results, and critically review some assumptions relating to the estimation of entrainment and froth recovery. We subsequently focus on first-order equations to model kinetics and propose a method that accounts more realistically for the decay in kinetics over the duration of a float, and the contributions of froth stability and hence mass pull. The method was applied to three case studies on platinum group metal (PGM) ores and matched or outperformed first-order, two-component models. Also, it allows for a deeper analysis of the integrity of the bench-scale flotation results.
Keywords: flotation kinetics, modelling, froth stability, mass pull.
Introduction
Geometallurgy is a structured, multidisciplinary approach that integrates key data from the geological, mining, mineralogical, and metallurgical aspects of the value chain to construct spatial models of an ore deposit such that the overall economic benefit and sustainability of an operation can be optimized. Process geometallurgy is aimed primarily at enhancing metallurgical efficiency and plant throughput by the application of appropriate mining and processing strategies, as well as supporting production planning and operational strategies to reduce the impact of highly variable ores. With flotation being the dominant concentrating process in the mineral value chain, the bench-scale flotation test is an important characterization tool - a relatively cheap, simple, and rapid way to obtain key information about the ore and its amenability to economic extraction of valuable minerals. This includes the evaluation of different ore types and the implications of mineralogical composition and texture for comminution and floatability, the effect of the grinding environment on the liberation of minerals, the electrochemical environment in the pulp (Bradshaw et al., 2006), the screening of reagents to improve floatability (Ekmekçi et al., 2003), and the role of hydrodynamics in the recovery of valuables and the entrainment of gangue (Amini et al., 2016; Wang et al., 2016). It is also a critical tool in auditing the performance of a flotation plant by hot floats, paving the way for concept and feasibility studies and providing essential data on kinetics for the purposes of scale-up, optimization, and simulation of flotation circuits.
Bench test best practice
While it appears to be a reasonably straightforward procedure, bench testing poses pitfalls that can result in unacceptable repeatability, misleading results, and hence costly mistakes when the findings are applied at plant level. As explained succinctly by Lotter, Whiteman, and Bradshaw (2014), a flotation test programme should produce 'clear, unambiguous results ... that are significant, cogent, reproducible, and have a good probability of successful scale-up'. In support of these fundamental principles, Table I lists a collection of best practices to be considered in laboratory bench test campaigns.
Interpretation
In the interpretation and modelling of bench flotation results for scale-up to pilot and commercial applications, two factors are of notable relevance, viz. the froth recovery and the contribution of entrainment to total recovery. Both these factors involve considerable effort and time to establish experimentally and a pertinent question is thus to what extent this could, or should, form part of a geometallurgical study.
Froth recovery
Froth recovery (Rf) is defined as the fraction of floated material that enters the froth attached to bubbles and is transported into the concentrate. The relevance of Rf is in deriving suitable scale-up parameters for converting bench batch data into plant prediction, based on the assumption that the pulp kinetics in the bench test represents that of the plant-scale equivalent. Rf is also used in research studies that seek to decouple the flotation rate constant into its key components, such as, for example, work in the AMIRA P9 programme (Amini, Bradshaw, and Xie, 2016).
A common assumption in bench tests is that the froth recovery is 100%, the main reasoning behind this being the notion that because the froth is comparatively shallow and being scraped, all floating material is being recovered. Amelunxen et al., (2014), however, in a series of bench tests on a sulphide ore, showed conclusively that in a typical test, the figure is closer to 30 to 40% only. This finding can be substantiated by considering, for example, a laboratory flotation cell at a typical superficial gas velocity Jg of 1 cm/s and froth being scraped every 15 seconds to a depth of 1.5 cm. The froth therefore is replenished to its full height in approximately 1.5 seconds after the scrape and for the 13-odd seconds until the next scrape, floatable material is thus entering that top layer of the froth. Since the recovery of air, Rg, towards the end of a test approaches zero as bubbles burst at the froth surface and are not recovered into the concentrate, a portion of the attached particles will start dropping back in the froth. It follows that, unless they all re-attach to bubbles in the froth and remain in the top layer, froth recovery will be less than 100%.
In the case of there being no such accumulation, Rf amounts to a mere 1.5/15, or 10%. For Rf to approach 100%, the scraping interval under these conditions should be less than 1.5 seconds, as also suggested by the data of Amelunxen et al., (2014).
Another key aspect, but one that is rarely considered in assessing Rf at bench scale, is the systematic decay in the froth stability as the float progresses, due to the depletion of the pulp in floatable material. The bubbles therefore coalesce more readily, and the ability of the froth to retain floatable material drops accordingly. This results in an increased proportion of the floated material not reaching the top layer in the first instance, further reducing Rf and therefore the overall rate of flotation. Finally, a factor that should also be taken cognisance of in modelling and scale-up exercises is that froth recovery is also dependent on particle size, the finer fractions being recovered to the concentrate more readily than coarser particles (Rahman, Ata, and Jameson, 2012).
Entrainment
An estimation of the contribution of entrainment to the total recovery of valuable mineral and gangue is often required in studies on froth mechanisms where the extent of true flotation needs to be quantified, but this is also sometimes incorporated in tests aimed at plant auditing and scale-up. The dominant mechanism of entrainment is by the hydraulic transport of particles in the wake of bubbles and into the froth across the pulp-froth interface. Several factors affect entrainment, major ones being the size and density distributions of particles in the pulp (Wang et al., 2016), their concentration below the interface, the stability and depth of the froth, as well as the cell design and operation in terms of concentrate lip length and agitation.
Over the years, several angles have been explored at bench scale to better quantify entrainment, most of which involve the relationship between the recovery to the concentrate of water and that of particles. These vary from comparisons of recoveries through experimental design, the development of empirical relationships, or the use of hydrophilic, non-floatable gangue as tracer or proxy for entrainment {e.g., Wang et al., 2016). These tracer tests are normally done with pure minerals in the absence of floatable material - and therefore the absence of a stable froth - and the extent to which the froth stability affects the degree of entrainment is thus not readily determinable. In this regard, the spiking of an ore with hydrophilic, uniquely identifiable material and inferring the entrainment behaviour of the ore itself from the relative particle sizes and densities is recommended.
From a geometallurgical perspective, however, the above techniques are time-consuming and can be relatively costly, and do not lend themselves readily to producing adequate information when limited sample is available. In this regard, the use of a parameter Cfi that expresses the classification between solids in species i and water across the froth has found use (Johnson, 2005); for ultrafine particles, Cfi approaches unity, and zero for coarse particles. The mass flow rate Ment,i of species i into the concentrate due to entrainment can thus be expressed as

where φΐ is the solids/water mass ratio in the pulp just below the pulp-froth interface (since the pulp phase is well mixed in a bench cell, it can reasonably be assumed to refer to the entire pulp volume) and Mw is the mass flow rate of water into the concentrate. The product Cfi*φΐ is commonly referred to as ENTi, or the degree of entrainment for species i. The value of Cfi is estimated from experimentally derived data for a given ore and corrected for density, or by plotting Cfi against flotation time and assuming that the predominant mechanism of recovery towards the end of a flotation test is entrainment. An important point to note in this approach is that entrainment is largely independent (or so it is assumed) of the surface properties of particles, and hence their grade. The value of Cfi is therefore to be expressed in terms of the mass ratios of solids and water rather than the grade ratios of a valuable species, as it refers to the entrainability of solids, and not floatability.
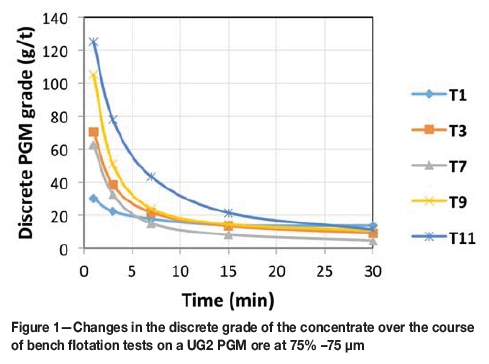
The assumption of entrainment being the predominant contribution to recovery towards the end of the test is, however, one that requires careful analysis. As shown for example in Figure 1 for a range of tests on an Upper Group 2 (UG2) PGM ore ground to 75% -75 μm, the discrete concentrate grade decreases consistently over the course of the float and flattens out with the final samples averaging between 5 and 15 g/t, the corresponding tailings grades varying from 0.6 to 0.9 g/t only. It is thus clear that even after 30 minutes of flotation, a fair quantity of slow-floating material was still being extracted into the concentrate, strongly challenging the validity of the above assumption.
The second point to be considered is the assumption that Cf is independent of flotation time, i.e., that the classification occurring across the pulp-froth interface and in the froth towards the end of the float is representative of the rest of the test. This is debatable to the extent that it, for instance, does not account for the decay in the stability of the froth as the pulp is being depleted of particles of various sizes and densities at different rates during the test, resulting for instance in especially coarser particles being less likely to be entrained in an unstable froth towards the end of the test.
The above observations suggest a need for approaches to better account for the contribution of entrainment, and especially to reduce the additional effort and cost. It is the opinion of the author that this would best be pursued in academic studies focusing on a better understanding of the underlying mechanisms. There appears to be ample scope for simplifying laboratory procedures or developing more sophisticated proxies that can provide fast and reliable indicators of entrainment. In the next section of the paper, which deals with the interpretation and modelling of bench flotation kinetic data, the contribution of entrainment is thus not separately accounted for.
Modelling of kinetics
A variety of models have been developed over the years to analyse flotation kinetics, being derived from chemical reaction kinetics theory and assuming different orders of reaction, distributions of rate constants, and ultimate recovery (Alvarez-Silva et al., 2016; Ramlall and Loveday, 2015; Bu et al., 2017). Despite the substantial research on different ores and experimental conditions, currently there does not seem to be a 'one-model-fits-all' solution. Arising from this is the drawback that the use of a specific model for a data-set invariably locks the analysis into the model framework and does not provide a means for relating the analysis with those of other fitted data-sets. Also crucial to the debate is the number of model parameters and the accuracy that they provide, as well as their physical significance and implications for scale-up.
Bench flotation kinetic data is modelled mostly by using different versions of a first-order rate equation, a preferred approach to account for the fact that not all valuable material is recoverable, mainly due to a certain portion of valuable mineral being locked within (usually, coarser) gangue particles which cannot float, and which are also unlikely to be recovered by entrainment (Zhang and Subasinghe, 2016). The first-order flotation rate equation thus takes the form

where Ri(t) is the recovery of species i after flotation time t, Rmax,i is the maximum attainable recovery, and Ki the flotation rate constant (min-1). Rmax is a fitted value suggested by the shape of the kinetics curve up to the end of the test and thus has little practical bearing, although introducing the important concept of less than 100% recovery. The overall rate constant K lumps together a host of factors, including the degree to which the valuable component is liberated and thus floatable, the hydrodynamics of the cell (the degree of agitation, aeration rate, bubble size, surface area flux, energy dissipation etc.), the effect of the electrochemical environment on floatability (Eh, reagent dosage, ionic strength), and all the parameters impacting on froth stability, residence time, and froth recovery. The AMIRA P9 programme decouples it into the following key drivers:

which incorporates the key effects above, including floatability (Pi), bubble surface area flux (Sb), froth recovery (Rfi), and recently, the addition of turbulent kinetic energy (denoted by the term œ.EVF, the latter representing the 'efficient volume for flotation') (Amini, Bradshaw, and Xie, 2016). Typically, an overall K for each valuable component in the ore and gangue is established by a least-squares regression on experimental recovery data (the regression minimizing the sum of squared residuals), and only in detailed research studies are the feed and various products analysed in terms of discrete particle size fractions or floatability classes, due to this being a laborious, complex, and costly route with difficult-to-reconcile mass balances due to errors in sizing and assaying.
Due to the inherent limitations of the single-component model when applied to the overall flotation response, which is characterized by a distribution of rate constants, the use of one of two variants of the two-component Kelsall model has become the platform for a variety of research studies. These models account for a 'fast-floating' and a 'slow-floating' fraction of the valuable component(s) as well as for the gangue, the classic version being based on an assumed Rmax of 100% and in the modified version, Rmax <100% due to the mineralogical constraints discussed above. Equation [2] thus extends to the form

where Qf is the fraction of fast-floating material, Kf is the rate constant of the fast-floating fraction, and Ks that of the slow-floating fraction. Later versions even discretize the floating component into three fractions, viz. 'fast', 'medium', and 'slow'. Interestingly, Hay and Rule (2003) make specific mention of the fact that the classic Kelsall (or Jowett) equation was chosen as basis for their kinetic modelling and simulation, seemingly specifically due to it not involving the concept of Rmax. While the reasoning for this is not clear (apart perhaps from the model having fewer variables), the concept of infinite flotation time is in our opinion not the issue at stake, but rather the fact that Rmax is an important metallurgical concept and indicator, especially regarding the fineness of grind and thus the liberation of the valuable mineral.
While both versions of the model are simple to use and the modified (four-parameter) version in particular provides accurate fits of experimental data, it remains somewhat of a 'number-crunching' exercise in which the 'fast-floating' rate constant is, for instance, often inflated strongly in model fitting to straighten the kinetics curve during the early stages of flotation. In construct it not only bears only a distant resemblance to reality, where a flotation feed presents not one or two, but a distribution of floatability classes due to the confluence of particle size and liberation classes, but can also turn the interpretation into a daunting task.
Novel approach
The above context prompted us to investigate an alternative approach to more reliably benchmark different ores, also as far as the principles and requirements for geometallurgical classification are concerned. One challenge was to negate the obstacles posed by individual models and rather present a metallurgically more representative view of the process kinetics. For example, instead of the over-simplification of a single component or two components only in the feed that float at the same respective rates for the duration of the experiment, we chose to reflect the changes in the rate of flotation as the cumulative result of a multitude of floatability components and also the mass pull. To simplify the practical implementation, the approach also combines the contributions of flotation and entrainment.
The approach is based on the principle that, for each successive concentrate intervalj, the maximum obtainable recovery Rmaxj reduces according to what has been recovered cumulatively by the end of the previous interval. For interval j:

where Rmax(j) is the residual maximum recovery after interval j. Assuming first-order kinetics of the material remaining within each interval, the overall rate of recovery K(j) is thus:

where R'(j) is the discrete recovery in intervalj, i.e.

Due to the continued depletion of the faster-floating material in the pulp over the course of the test, the kinetics should always display a consistent decay with time, similar to the mass pull. A significant body of research and operational evidence points to the fact that the rate of flotation is a function not only of the floatability distribution, but also the froth stability and hence the mass pull MP(t) at any point in the float, and a relationship between the rate of flotation and mass pull such as the one depicted in Figure 2 (Set 1) should therefore be evident. This relationship can be approximated by the following equation:
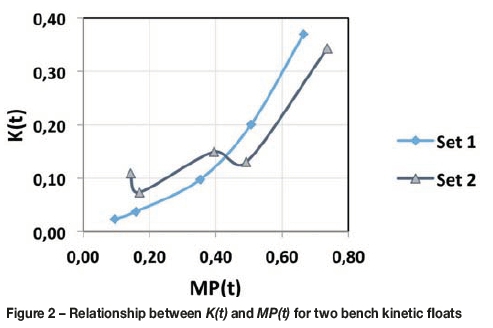

where K0 denotes the initial rate of flotation, b expresses the rate at which the kinetics are decreasing with the float, and Kmp is a coefficient that relates the kinetics to the discrete rate of mass pull MP(t) (%/s) within each concentrate interval. The equation is applied to each interval successively to reflect the cumulative overall kinetic response.
An added potential benefit of this method is that it could also enable an initial analysis of the accuracy of bench flotation data, such as identifying deviations from the asymptotic K(t) vs MP(t) relationship caused, for instance, by inconsistent operating procedures or incorrect assays or mass recovery measurements. Such an example is shown in Figure 2 (Set 2), where the first-order rate of flotation increased in intervals 3 and 5 over that in intervals 2 and 4 respectively, for the particular Rmax (the time axis in this case running from right to left, interval 1 represented by the maximum K(t)-MP(t) coordinate). This could, for instance, be the result of a change in operating conditions such as a shallower froth or the operator scraping more deeply into the froth, resulting in faster apparent kinetics, or an over-assay of the concentrates. Further investigation is under way to understand these aspects in more detail; worth noting, however, is that while a kinetic model such as Equation [4] would still be able to fit the recovery kinetics reasonably well under these circumstances, it would not highlight the suspected anomaly in the recovery-mass pull data and as such, the resulting values of parameters may not be valid.
Results
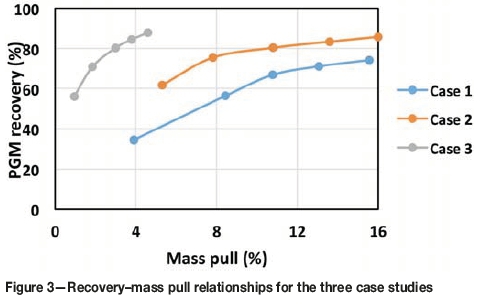
The recovery-mass pull relationships of case studies on three PGM ores under different experimental conditions are shown in Figure 3. Case study 1 represents an altered UG2 ore from the Bushveld Complex with a 4E head grade of 3.1 g/t, yielding a lower overall recovery and slower initial kinetics but a consistent tail and characterized by a high mass pull to the concentrate. Case study 2 used a good quality and easily floatable UG2 ore (4E head grade of 4.0 g/t), characterized by a strong fast-floating component and consistent slow-floating behaviour. Case study 3 was conducted on a UG2 ore similar in head grade to case study 2, but instead of a mechanical Denver cell, the sample was floated in a pneumo-mechanical cell of the same 8 L volume. The float was characterized by significantly reduced mass pulls and improved PGM kinetics, and even after 30 minutes of flotation the PGM recovery-mass pull relationship was still strong.
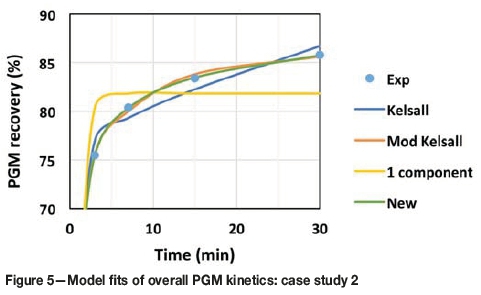
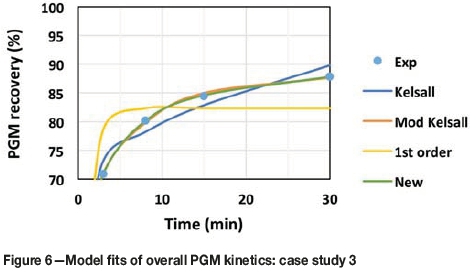
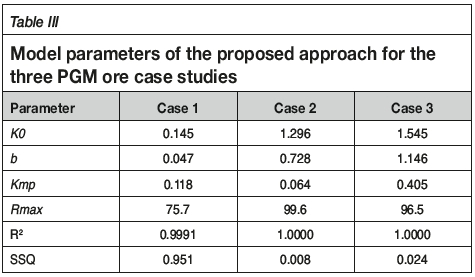
The fits of the first-order model variants in Equations [2] and [4] and that of the new 'exponential decay, mass-pull-linked' method are shown in Figures 4 to 6. For maximum graphical resolution, only the inflection of the curve and the slow-floating kinetics are shown. Table II details the model parameters for the three first-order models, while Table III provides the parameters for the newly proposed method. In each case the experimental data-points each represent a single flotation test; further work is under way to investigate the model fits with replicate tests where the variance in data-sets also affects the fit.
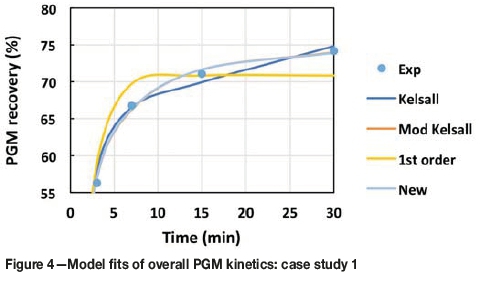
As shown in Figure 4 (case study 1), the single-component, first-order model returned an Rmax of just over 70%, and clearly did not provide a good fit to the overall kinetics, returning an R2 value of 0.9711 and a sum of squares (SSQ) of 34.1. (We have included the SSQ values in each case to provide a better resolution of the extent to which the various models were able to fit the experimental data). Typical of the application of this model, the kinetics are overestimated as the Rmax constitutes a ceiling to the recovery. Under these conditions, the classic (three-parameter) Kelsall model also did not cope well and, reflecting the experience on a database of other PGM ores, it tends to under-predict the kinetics up to around halfway in the float, subsequently compensating by overshooting the experimental recovery after 30 minutes. It does not offer a good description of the slow-floating fraction and it is to be expected that in cases where the kinetics are lower than in this case, the model fit would be worse. As expected, the modified (four-parameter) Kelsall model provided the best fit of the three with an R2 of 0.9991 (SSQ 0.96) for the five experimental data-points, tracking the overall kinetics well throughout the duration of the experiment. (Note that the fit of this model is obscured on the graph by that of the proposed 'new' approach, the two being very similar.)
The results in Table II highlight the disconnect between the rate constants and ultimate recoveries in the various models. While the value of Rmax for the single-component model, at 70.8%, is clearly a significant underestimation and has no relevance for interpretation or modelling, the modified Kelsall returned a value of 74.3% which, judging from visual extrapolation of the experimental data and the 74.25% final experimental recovery, is conservative. The latter is due to a correction of the slight overshoot of the experimental recovery after 15 minutes, thereby flattening the predicted kinetics. The proposed mass-pull-related model, with four parameters, was able to match the fit of the modified Kelsall with an R2 of 0.9991 and Rmax of 75.7%, which from visual observation appears to be more representative of the experimental data. It should be noted that the value of Rmax is adjusted according to Equations [5] to [7] to provide the optimum description of the experimental kinetic data as per Equation [8].
Case study 2 (Figure 5) shows that, as before, the firstorder single-component model is not able to cope with the overall kinetics, returning an R2 of 0.8767 (SSQ 45.7) but, as expected from the nature of the ore, significantly enhanced K and Rmax values compared to those of case study 1. The classic Kelsall model was even less able to cope with the shape of the kinetics curve than before, again a significant underestimation of recovery at the middle of the test being compensated by an overshoot of the experimental recovery after 30 minutes of flotation. As before, the modified Kelsall was the best of the three conventional models, with an R2 of 0.9990 (SSQ 0.38) and Rmax of 85.9% which, from the final experimental recovery of 85.8% and the relatively steep slope of the recovery curve, again seems to be underestimated. As seen from comparison of the regression values in Tables II and III, the new (four-parameter) model was able to fit the experimental data very well for this ore and outperformed the modified Kelsall, with an R2 of 1.000 (SSQ 0.008). The optimum kinetic fit was achieved at an Rmax of 99.6%, which seems to be a significant overestimation which was related to erratic experimental results and is an aspect that needs further improvement in the model.
Case study 3 (Figure 6) again highlighted that the single-component model is not a feasible option for this ore. As observed earlier, the three-parameter Kelsall model displayed a consistent drawback in these UG2 case studies by overshooting the initial fast-floating kinetics to compensate for its inability to describe the slow-floating kinetics well. The interpretation of model parameters in this case therefore needs to be approached with caution. Consistent with the other two studies, the modified Kelsall model tracked the kinetics profile well (R2 of 0.9992); a point of note, though, being the overestimation of the recovery after the fourth (second-last) interval and that of the last being fitted closely, leading to an Rmax of 88% which is again clearly conservative in view of the final experimental recovery of 87.9%. Fitting of the kinetic profile with the new model proved the most successful, outperforming the modified Kelsall by a substantial margin (R2 of 1.000). As with case study 2, the Rmax of 96.5% at which the model fitted the experimental kinetics best suggests that further improvement in the model formulation should be pursued.
This also allows for initial observations as to the interpretation of the results of the 'exponential decay, mass-pull-linked' model. The parameter K0 is the key determinant of the recovery-mass pull curve, an increasing value indicating improved recovery at a given mass pull and translating into an increased concentrate grade. Parameter b represents the rate at which the kinetics decay during the test and thus, in conjunction with K0, provides a measure of the extent of the fast-floating component of the ore. As evidenced from Table III, this was the highest for case study 3 where the conditions of high shear in the pneumo-mechanical cell resulted in very fast kinetics. The mass pull coefficient Kmp defines the relationship between the kinetics of the slow-floating fraction and that of mass pull towards the end of the float, and from the limited initial data appears to be sensitive to scenarios both of high recovery-low mass pull and low recovery-high mass pull. This can be explained by the steepness of both the recovery-mass pull curves. For case study 1 it was to be expected that the high mass pull, but low grade of the feed, would combine into a strong kinetic dependency on mass pull and probably a higher contribution by entrainment, while for case study 3, the steep recovery-mass pull relationship was clearly driving the high Kmp.
Conclusions
Bench flotation tests play a crucial role in the process geometallurgical value chain and are a relatively cheap, simple, and quick approach to obtain key information about an ore and its amenability to economic extraction of valuable minerals. Despite their apparent simplicity, a good understanding of potential pitfalls with respect to operation and interpretation of results is required. In this paper, some key practical considerations to ensure the integrity and reproducibility of data were reviewed. Subsequently, the validity of assumptions common to estimating entrainment and froth recovery at bench scale was addressed, suggesting that these can lead to errors in scale-up. The added effort and cost entailed in estimating the contribution of entrainment to overall recovery is deemed not worthwhile in a geometallurgical context, and scope exists for the development of better techniques to quantify these parameters.
A brief review was also made of first-order models for bench flotation kinetics, and a method has been proposed that accounts for the distribution of rate constants in an ore and also the fact these are driven by the froth stability, as proxied by the mass pull to the concentrate. An expression K(t) = K0*exp (-b*t) + Kmp*MP(t), where K0 and b describe the floatability of the valuable mineral and Kmp incorporates the rate of mass pull at time t (MP(t)), was used. An added potential benefit of this method is that it enables analysis of the accuracy and quality of bench flotation data, such as deviations from an asymptotic K(t) vs MP(t) relationship caused by inconsistent operating procedures, and incorrect assays or concentrate mass measurements.
The application of the four-parameter kinetic model has been demonstrated for case studies on three PGM ores, achieving overall kinetics fits that matched, or outperformed, the three-and four-parameter first-order, two-component (Kelsall) kinetic models. The strongest relationship between the PGM recovery and mass pull was indicated for the case in which a UG2 ore was processed in a pneumo-mechanical cell and was characterized by fast PGM kinetics and low mass pull. The altered ore exhibited the slowest kinetics but was relatively strongly dependent on mass pull. The unaltered ore, on the other hand, showed stronger initial kinetics but coupled with a faster decay, and the smallest dependency on the mass pull.
Acknowledgements
The permission of Mintek management to publish the results, the support of the School of Chemical and Metallurgical Engineering at the University of the Witwatersrand, and that of the Department of Process Engineering at the University of Stellenbosch to generate metallurgical results, is gratefully acknowledged.
References
Alvarez-Silva, M., Vinnett, L., Langlois, R., and Waters, K.E. 2016. A comparison of the predictability of batch flotation kinetic models. Minerals Engineering, vol. 99. pp. 142-150. [ Links ]
Amelunxen, P., Sandoval, G., Barrigab, D., and Amelunxen, R. 2014. The implications of the froth recovery at the laboratory scale. Minerals Engineering, vol. 66-68. pp. 54-61. [ Links ]
Amini, E., Bradshaw, D.J., and Xie, W. 2016. Influence of flotation cell hydrodynamics on the flotation kinetics and scale up, Part 1: Hydrodynamic parameter measurements and ore property determination. Minerals Engineering, vol. 99. pp. 40-51. [ Links ]
Bradshaw, D.J., Buswell, A.m., Harris, P.J., and Ekmekçi, Z. 2006. Interactive effects of the type of milling media and CuSO4 addition on the flotation performance of sulphide minerals from Merensky ore Part I: Pulp chemistry. International Journal of Mineral Processing, vol. 78. pp. 153-163. [ Links ]
Bu, Χ., Xie, G., Peng, Y., Ge, L., and Ni, C. 2017. Kinetics of flotation. Order of process, rate constant distribution and ultimate recovery. Physicochemical Problems in Mineral Processing, vol. 53, no. 1., pp. 342-365. [ Links ]
Buswell, A.m., Bradshaw, D.J., Harris, P.J., and Ekmekçi, Z. 2002. The use of electrochemical measurements in the flotation of a platinum group minerals (PGM) bearing ore. Minerals Engineering, vol. 15. pp. 395-404. [ Links ]
Corin, K.C., Reddy, Α., Miyen, L., Wiese, J.G., and Harris, P.J. 2011. The effect of ionic strength of plant water on valuable mineral and gangue recovery in a platinum bearing ore from the Merensky reef. Minerals Engineering, vol. 24, no. 2. pp. 131-137. [ Links ]
Deglon, D.A., Egey-Mensah, D., and Franzidis, J.P. 2000. Review of hydrodynamics and gas dispersion in flotation cells on South African platinum concentrators. Minerals Engineering, vol. 13, no. 3. pp. 235-244. [ Links ]
Ekmekçi, Z., Bradshaw, D.J., Allison, S.a., and Harris, P.J. 2003. Effects of frother type and froth height on the flotation behaviour of chromite in UG2 ore. Minerals Engineering, vol. 16. pp. 941-949. [ Links ]
Hay, M.P. and Rule, C.M. 2003. Supasim: A flotation plant design and analysis methodology. Minerals Engineering, vol. 16, no. 11. pp. 1103-1109. [ Links ]
Johnson, N.W. 2005. A review of the entrainment mechanism and its modelling in industrial flotation processes. Proceedings of the Centenary of Flotation Symposium. Jameson, G.J. (ed.). Australasian Institute of Mining and Metallurgy, Melbourne. pp. 487-496. [ Links ]
Lotter, N.O., Whiteman, Ε., and Bradshaw, D.J. 2014. Modern practice of laboratory flotation testing for flowsheet development - A review. Minerals Engineering, vol. 66-68. pp. 2-12. [ Links ]
Rahman, R.M., Ata, S., and Jameson, G.J. 2012. The effect of flotation variables on the recovery of different particle size fractions in the froth and the pulp. International Journal of Mineral Processing, vol. 106-109. pp. 70-77. [ Links ]
Ramlall, N.V. and Loveday, B.K. 2015. A comparison of models for the recovery of minerals in a UG2 platinum ore by batch flotation. Journal of the Southern African Institute of Mining and Metallurgy, vol. 115. pp. 221-228. [ Links ]
Runge, K.C., Tabosa, Ε., and Jankovic, Α. 2013. Particle size distribution effects that should be considered when performing flotation geometallurgical testing. Geomet 2013: Proceedings of the Second AusIMM International Geometallurgy Conference, Brisbane, 30 September - 2 October. Australasian Institute of Mining and Metallurgy, Melbourne. pp. 335-344. [ Links ]
Wang, L., Runge, K., Peng, Y., and Vos, C. 2016. An empirical model for the degree of entrainment in froth flotation based on particle size and density. Minerals Engineering, vol. 98. pp. 187-193. [ Links ]
Zhang, J. and Subasinghe, N. 2016. Development of a flotation model incorporating liberation characteristics. Minerals Engineering, vol. 98. pp. 1-8. [ Links ]
 Correspondence:
V. Ross
VictorR@mintek.co.za
Received: 16 Jan. 2019
Revised: N/A
Accepted: 26 Mar. 2019
Published: Alpril

