


Services on Demand
Article
 English (pdf)
 Article in xml format
 Article references
Indicators

Related links
-
 Cited by Google
 -
 Similars in Google
Share

 Permalink
Journal of the Southern African Institute of Mining and Metallurgy
On-line version ISSN 2411-9717
Print version ISSN 2225-6253
J. S. Afr. Inst. Min. Metall. vol.119 n.3 Johannesburg Mar. 2019
http://dx.doi.org/10.17159/2411-9717/2019/v119n3a9
PAPERS OF GENERAL INTEREST
Optimization of conditions for the preparation of activated carbon from olive stones for application in gold recovery
M. LouarratI; G. EnaimeI; A. BaçaouiI; A. YaacoubiI; J. BlinII; L. MartinII
ILaboratory of Applied Chemistry, Department of Chemistry, Morocco
IICentre for International Cooperation in Agronomic Research for Development (Cirad), France
SYNOPSIS
The purpose of this study is to prepare a new activated carbon from olive stones for use in gold recovery by carbon-in-leach (CIL) and carbon-in-pulp (CIP). The preparation method chosen was physical activation using steam. The effect of four process parameters: the residence time for carbonization, the activation temperature, the residence time for activation, and steam flow, were studied by the mean of response surface method (RSM) in order to optimize the yield, iodine index, and attrition characteristics. These two last responses were used as primary indicators of gold recovery capacity and mechanical strength. The results obtained show that optimal activated carbon can be prepared under the following conditions: a carbonization time of 157 minutes, activation at 921°C for 53 minutes, and a water vapour flow of 0.18 mL/min. This optimum carbon has an iodine value greater than 1100 mg/g and an attrition index in the order of 0.74%. These values reflect the quality of the precursor (olive stones) as a raw material for the development of an effective new activated carbon for the gold mining industry.
Keywords: olive stones, activated carbon, response surface method (RSM), physical activation, gold recovery.
Introduction
Activated carbon is an effective adsorbent widely used in industry due to its high surface area, well-developed reproducible microporous structure, and high degree of surface reactivity and adsorption capacity. World consumption of activated carbon is steadily increasing. It is primarily used in industrial wastewater and gas treatment. and also for silver and gold recovery from cyanide solutions (Syna and Valix, 2003; Soleimani and Kaghazchi, 2008; Buah and Williams, 2010; Eddy et al., 2011). However, activated carbon is expensive and it needs to be regenerated after each adsorption cycle. In order to decrease the cost of manufacturing activated carbon, low-cost forest and agricultural wastes are considered promising new materials. In recent years considerable research has been reported on activated carbon from agricultural wastes, such as olive stones (Yavu et al., 2010), acorn shells (Sahin and Saka, 2013), peanut shells (Wu, Guo, and Fu, 2013), grape seeds (Jimenez-Cordero, 2014), coconut shells (Yalcin and Arol, 2002; Gratuito, 2008), palm shells (Sumathi, 2009), cherry stones (Jaramilloa, Gomez-Serrano, and A'lvareza, 2009), macadamia nut shells (Eddy, 2011), apricot stones (Soleimani and Kaghazchi, 2008), and bagass (Syna and Valix, 2003).
There are basically two methods of preparing activated carbon: physical or chemical activation. Physical activation is most commonly used. This thermal gas process is a two-step process. The production of activated carbon by the thermal route starts with carbonization, followed by activation. During activation the carbonized product develops an extended surface area and a porous structure of molecular dimensions. Activation is generally conducted at temperatures between 800 and 1100°C in the presence of a suitable oxidizing agent such as steam, air, or carbon dioxide.
Activated carbon has had a tremendous impact on the technology and economics of gold recovery. The main advantages of activated carbon are: its high selectivity towards gold relative to base metals, its ease of elution, and its large particle size (Arriagad and Garcia, 1997). It should be noted that the physical and chemical properties of the activated carbon used can strongly affect the amount of gold adsorption. The primary criteria for activated carbon intended for use in a gold adsorption process are as follows (Yalcin and Arol, 2002; Gergova, Petrov, and Minkova, 1993):
> High adsorption capacity
> High adsorption rate
> Good resistance to abrasion.
In gold recovery plants, activated coconut-shell carbons have been the preferred adsorbent for many years, due to their resistance to abrasion and selectivity for gold. However, increasing gold production necessitates the exploitation of other sources. Many research investigations published recently used low-cost precursors such as apricot stones, peach stones, hazelnut shells, bagasse, and macadamia nut shells (Yalcin and Arol, 2002; Syna and Valix, 2003; Souza et al., 2004; Mansooreh Soleimani et al., 2008; Gerrard Eddy et al, 2011; Raminez-Muniz, 2010; Mpinga et al, 2014) to produce an adequate activated carbon.
The aim of this study was to evaluate olive stones as an alternative raw material to coconut shells for the production of activated carbon used in gold metallurgy. The characteristics of the activated carbon prepared under optimal conditions were compared with those of the commercial carbon (GoldSorb). To our knowledge, this is the first time that olive stones have been used as a precursor for the preparation of activated carbon for gold applications.
Materials and methods
Raw material
Olive stones from Marrakech Province in Morocco were used. The material was crushed to between 3.15 and 4 mm, rinsed with water to remove traces of olive pulp, and dried in the drying oven overnight at 105°C.
Carbonization and activation
Carbonization was carried out in a Carbolite type CTF 12/65/650 programmable electrical furnace. A mass of 30 g of olive stones was introduced into the reactor, which was heated to the desired temperature of 500°C and maintained for different residence times in a nitrogen flow.
The activation process was carried out in the same furnace. The activation time was between 30 to 120 minutes, and the activation temperature was between 800 and 950°C in a steam flow of 0.1 to 0.2 mL/min.
The resulting activated carbon was rinsed for 30 minutes with distilled water and dried. A portion was ground and sifted to obtain a powder with a particle size smaller than 45 μm, and the powder was then dried and kept in a hermitic bottle for iodine testing. The rest of granular activated carbon was used for attrition, bulk density, and kinetic activity testing.
The activated carbon mass yield was determined from the following equation:
(Yield = (Activated carbon weight)/(Raw material weight)) χ 100
Characterization
Elemental analysis
The determination of the total content of carbon, hydrogen, and nitrogen for the raw material (in our case olive stones) is based on the standard method (XP CEN/TS 15104, Afnor Group, 2005), but for activated carbon the determination is based on the standard method ASTM D5373 (ASTM, 2016).
Initial analysis
The initial analysis (moisture, ash content, volatile matter, and fixed carbon) allows prediction of certain behaviours in the pyrolysis processes based on a standard method (Norme AFNOR XP CEN/TS 14 774-3).
TG/DTAand FT-IR
The thermogravimetric analyses of olive stones were conducted by a simultaneous TGA-DTA instrument (Setaram Instrumentation) in an air atmosphere at a heating rate of 10°C/min to attain a maximum temperature of 930°C.
FTIR spectroscopy provides information about chemical characterization of the functional groups in olive stones and the resulting activated carbon. The FTIR spectra were recorded between 400 and 4000 cm-1 using a PerkinElmer spectrometer.
Morphology analysis
The morphology of the activated carbon prepared under the optimal conditions was observed using scanning electron microscopy (VEGA3 TESCAN instrument).
Iodine number
The iodine number of the prepared activated carbon was measured by titration based on the standard method ASTM D 4607-94 (ASTM. 2006).
Attrition
Activated carbon hardness was determined using a wet attrition test as described by Toles et al. (2000). The fraction of granular activated carbon between 0.5 and 2 mm was used for the attrition tests. One gram of granular activated carbon was added to 100 mL of acetate buffer in a 150 mL beaker. The solution was stirred for 24 hours at 25°C on an IKA magnetic stirrer at 500 r/min using 0.500 stir bars. The samples were then poured onto a 0.3 mm screen and the retained carbon was washed with 250 mL distilled water. After washing, the retained carbon was dried at 110°C for 2 hours. The sample was removed and allowed to cool in a desiccator and weighed. The percentage attrition was calculated as:
% Attrition=([(initial wt (g)-final wt (g)))/(initial wt (g)]) χ 100
Bulk density
Apparent or bulk density is a measure of the weight of the material that is contained in a given volume under specified conditions. A 10 mL cylinder was filled to a specified volume with activated carbon that had been dried in an oven at 80°C for 24 hours. The cylinder was weighed. The bulk density was then calculated according to the method of Snell and Ettre (1968):
Bulk density = (weight of dry material(g))/(volume of packed of dry material(ml))
Adsorption test
Essentially, all procedures used to determine the kinetic activity involve contacting a known mass of carbon with a solution of known initial gold concentration, collecting and analysing samples of the solution over a period of time, and then calculating the activity of the carbon sample based on the data obtained.
In this study, the activated carbon activity was usually determined based on the Mintek method (Staunton, 2016).
The activated carbon was separated from the solution by filtering, and the gold concentration of the solution was measured by atomic absorption spectrophotometry (AAS) (Unicam model 939 instrument) using an air-acetylene flame and absorbance peak at a wavelength of 242.8 nm. The quantity of gold absorbed onto the activated carbon was calculated from the difference between the initial and final gold concentration in the solution.
CIL cyanidation tests
The cyanidation tests using the CIL technique were carried out according to the experimental methodology used by various authors (Staunton, 2016).
The gold ore used in this study was a residue from cobalt extraction, containing 24% moisture. The samples were pulped with water. Cyanidation was carried out in beakers at a pulp density of 1.24, stirring for 12 hours in the presence of a solution of 0.8 g/l free cyanide at a pH of 10.5 adjusted with quicklime. Periodic checks of free cyanide and pH were carried out and the desired values were maintained by the addition of cyanide and quicklime. For adsorption of the gold cyanide complex, activated carbon of particle size between 1.4 and 2 mm was added at a dosage of 20 g per litre of solution. The pulp was then screened at 1 mm to recover the activated carbon. The solution was filtered and the solids dried. Samples of the solution, solids, and activated carbon were taken to determine the gold concentration by AAS.
Methodology of experimental design
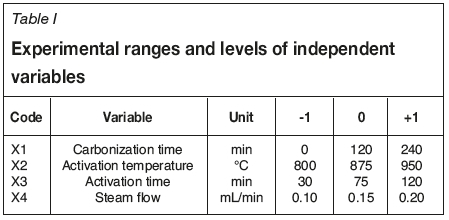
The carbonization and activation optimization were studied using response surface methodology and multi-criteria optimization with a Doehlert design and desirability function (Doehlert, 1970). This method helps to optimize the individual and interaction effects of various parameters. Four variables were investigated in this study: residence time for carbonization (X1), temperature of activation (X2), residence time for activation (X3), and steam flow (X4). Table I shows the ranges and levels of the four independent variables with actual coded values of each parameter. The independent variables are coded to two levels, namely low (-1) and high (+1). The yield of activated carbon (Y1), iodine number (Y2), and attrition (Y3) were analysed as responses.
For this study, response surface methodology based on empirical mathematical modeling was used. More precisely, a second-order polynomial model was postulated to capture the possible nonlinear effects and curvature in the domain:
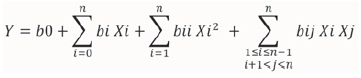
where Y is predicted response, Xi ( i = 1,2...n) the unidimensional variables.
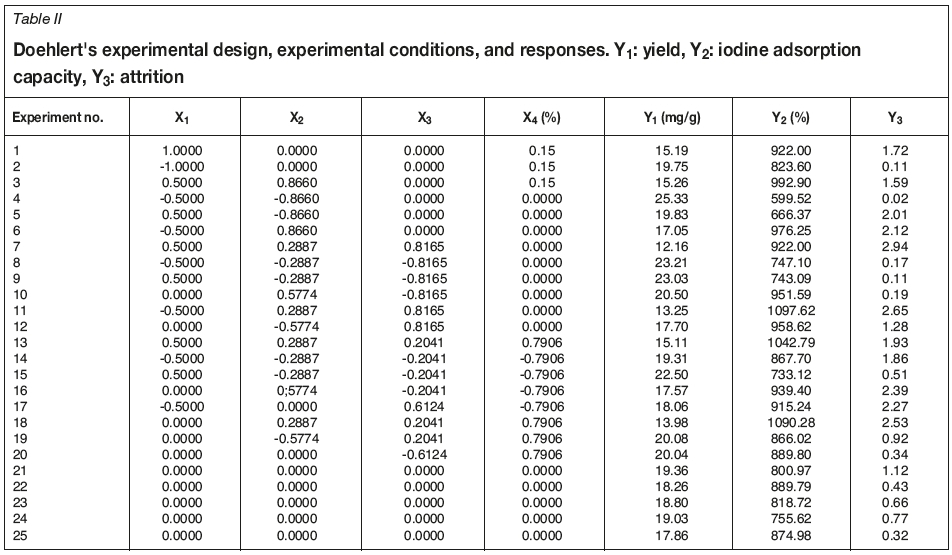
The Doehlert experimental design and the corresponding experimental conditions and responses are given in Table II.
The centre points are repeated five times in order to calculate the variance of experimental error and to test the reproducibility of the data. The experiments were carried out in a random order to minimize the effect of systematic errors.
The models were validated using analysis of variance (ANOVA). They were also checked by the correlation coefficient (R2) and the adjusted determination coefficient (R2A) in order to measure the proportion of the total observed variability described by the model (Bacaoui et al., 1998, 2001; Hameed, Tan, and Ahmad, 2009).
Results and discussion
Characterization ofraw material
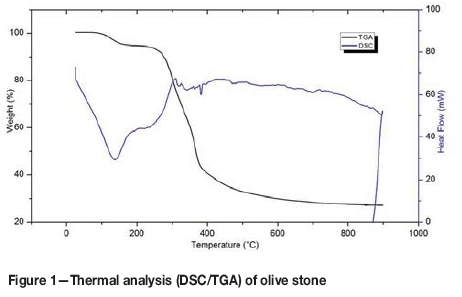
The TG/DTA curves for olive stones are shown in Figure 1. The first endothermic event was due to water loss, and the second to loss of mass. The mass loss curves make it possible to visualize and decouple different phenomena distinguished as a function of the temperature level in the reactor. Two losses of mass are shown: the first is a loss of 5.59% in the drying phase from 43.9°C to 161°C, during which time the residual moisture is driven off. The second is a loss of 67.4% in the range from 162°C to 801.4°C. In this phase several zones may be associated with the degradation of the principal constituents of olive stones (hemicelluloses, cellulose, lignin) (Guinesi and Cavalheiro, 2006; Aigner et al., 2012). This process begins with the most thermally unstable compound. Hemicelluloses degrade between 162°C and 325°C, followed by celluloses between 325°C and 375°C. The change in the slope of the curve reflects a change in chemical kinetics. Lignin degrades between 375°C and 500°C; its kinetics of degradation are slower than those of other compounds. Finally, the end of degradation is located at 500°C and above.
The FT-IR spectrum of olive stones is shown in Figure 2. The broad band observed at 3425 cm-1 corresponds to the stretch vibration of hydroxyl groups involved in hydrogen bonding (O-H), possibly due to absorbed water. A small band located at 2920 cm-1could be assigned to the (C-H) stretch vibration in methyl and methylene groups, and the band at 1739 cm-1 is ascribed to the vibration of (C=O), mainly from the esters, carboxylic acids, or aldehydes derived from cellulose and lignin (Saidatul, Jamari, and Howse, 2012, Sevilla and Fuertes, 2009). The vibration stretching (C=C) from the aromatic rings present in lignin caused the emergence of the bands at about 1639 and 1508 cm-1. The vibration at 1463, 1425, 1380, 1330 cm-1 can be allocated to the asymmetric and symmetric bending (C-H) due to the bands of methylene and methyl groups (Sundqvist, Karlsson, and Westermark, 2006). The band at 1253 cm-1 can be attributed to (C-O) asymmetric stretching of aromatic ethers, esters, and phenols. The stretch vibration from acids, alcohols, phenols, and esters are observed in the relativity intense bands at 1157 and 1041 cm-1. The deformation of the (C-H) bond in aromatic compound gives rise to the last band at 603 cm-1.
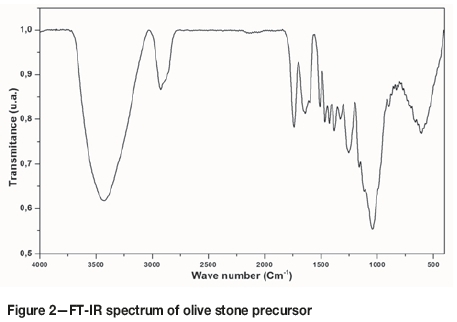
The FT-IR and TG/DTA spectra of olive stones are similar to those of other lignocellulosic materials such as coconut shell (Sahin and Saka, 2013). The high fixed carbon, volatile content, and carbon concentration (Table IV) indicate that this material a good precursor for preparing a hard activated carbon to be used in gold adsorption.
Evaluation of the responses
Activated carbon yield (Y1)
The carbon yield varied between 12.16 and 25.33% (Table II). These high yields are due to the nature of olive stones, which are very rich in carbon and volatiles materials as noted in Table IV, which in turn favours the production of pores during carbonization by the volatilization of volatile matter in the form of gas and tar.
The total yield in carbon can be described as follows:
Yi = 18.57 - 1.931 X1 - 3.786 X2 - 4.275 X3 - 0.361 X4
The coefficients of correlation (R2= 0.939, R2A = 0.832) between the theoretical and experimental response, calculated by the model, are satisfactory.
Analysis of the results shows, as expected, that the activation temperature (X2) and the activation time (X3) have a very negative influence on yield.
Adsorption capacity for iodine (Y2)
It is known that the iodine number is a reliable measurement of the microporosity of activated carbons, with higher iodine number defining a higher microporosity and higher internal surface area (Eddy et al., 2011). The adsorption capacity of iodine (Y2) can be described by the model:
Y2 = 846.116 - 77.348 Xi + 164.326 X2 + 109.336 X3 + 76.581 X4 - 100.107 X12- 72.962 X22+ 129.363 X32+ 129.009 X42- 127.206 X1X2 - 110.279 X2X3 + 147.090 X1X4 + 86.287 X2X4 + 131.671 X3X4
The coefficients of correlation (R2 = 0.976, R2A = 0.950) between the maximum capacities of adsorption calculated by the model and those determined experimentally are satisfactory.
Analysis of this response (Y2) shows that the activation temperature (X2) and the time of activation (X3) have a strong impact on the development of the porous texture during activation. These factors therefore influence the adsorption behaviour of the activated carbon. Moreover, temperature seems to be more influential during a long activation time. It seems that more micropores are opened with increased activation temperature and activation time.
The iodine adsorption test is normally used as a performance indicator for gold adsorption, with the minimum recommended iodine number required for activated carbons for use in the gold industry being 1000 mg/g (Buah and Williams, 2010).
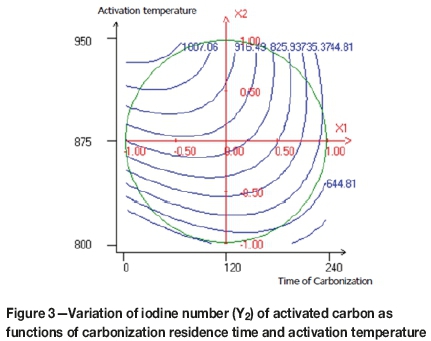
Figures 3-6 illustrate the interaction between the variables in contour plots. Figure 3 shows the combined effect of time of carbonization (Xi) and temperature of activation (X2) on the iodine number. The highest iodine number (>1000 mg/g) was achieved at approximately 940°C and 60 minutes of carbonization time. The figure shows that the iodine number increased with increasing temperature and decreasing time of carbonization. The increased temperature causes an increase in the release of low molecular weight volatiles from the matrix structure, which in turn causes pore development. The numbers of pores and porosity will increase indirectly by this volatilization process (Bansal, Donnet, and Stoeckli, 1988; Suhas, Carrott, and Ribiero-Carrott, 1988; Lua and Guo, 2000).
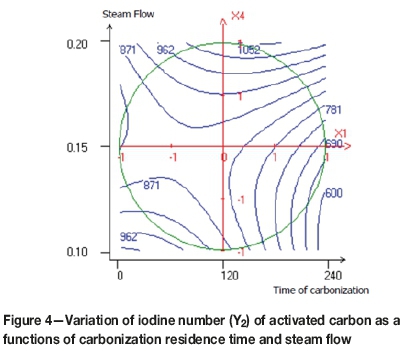
The effects of steam flow and carbonization residence time are shown in Figure 4. The highest iodine number determined in this case was of 1052 mg/g. An increase in steam flow and an average time of carbonization (approx. 2 hours) improved the capacity of iodine adsorption. However, when the carbonization time was too long, the iodine number decreased. This is related to the excessive burn-off the carbon content, which affects the quality of pores in the activated carbon and causes enlargement of the micropores (Bansal, Donnet, and Stoeckli,. 1988; Lua and Guo, 2000; Gratuito et al., 2008).
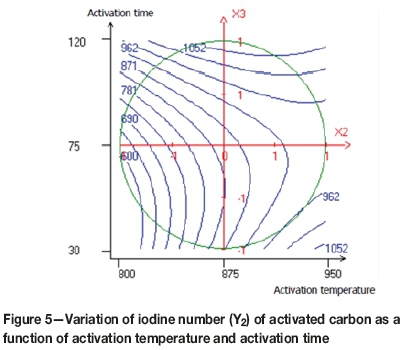
Figure 5 shows the interaction between the temperature and the activation time. The highest iodine numbers were obtained at high temperatures with short activation times, and lower temperatures for longer activation times. An increase in the activation time increases the porosity and modifies the pore structure, and also promotes the formation of active sites within the activated carbon (Lua and Guo, 2000).
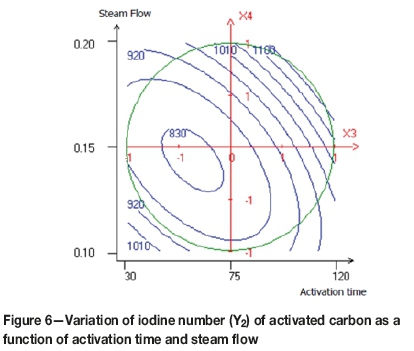
Figure 6 shows the combined effects of activation time and steam flow on the iodine adsorption capacity. It seems that the maximum iodine number was achieved when the time of activation and the steam flow were increased. Physical activation is a process in which the carbonized product develops a porous structure of molecular dimensions and an extended surface area. At high temperature in the presence of a steam activating agent, the loss of mass increases proportionally to the reactivity of the carbon atoms with the activating agent. This causes the unblocking of the pores, which makes the activated carbon structure more open. Subsequently, the carbon of the aromatic ring structures starts burning, producing active sites and wider pores (Sahin and Saka, 2013)
Attrition (Y3)
Another parameter that is important for assessing the suitability of the activated carbon for gold adsorption is resistance to attrition. This response is described by the following equation:
Y3 = 0.633 + 0.574 Xi -+ 0.601 X2 + 1.193 X3 - 0.647 X4 + 0.976 X22+ 1.729 X42- 1.455 X1X2 + 1.281 X2X3 + 1.285 X3X4.
The coefficients of correlation (R2= 0.945, R2A = 0.848) between the attrition responses calculated by the model and those determined experimentally are satisfactory.
The activation residence time (X3) has a strong positive correlation with attrition resistance, the temperature of activation (X2) also has a positive effect on this parameter, and the steam flow (X4) has a negative one.
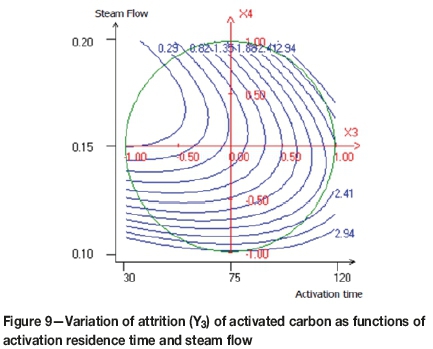
Figures 7, 8, and 9 demonstrate the relationships between the variables in contour plots. Figure 7 shows the combined effects of carbonization time and activation temperature on attrition resistance of the activated carbon, the lowest attrition value (0.5%) being achieved at approximately 850°C and 60 minutes. A brittle activated carbon was obtained when both variables were increased. When the activation temperature is average and the carbonization residence time is minimal, a rigid activated carbon was obtained. The effect of activation temperature and activation time on attrition of the activated carbon is shown in Figure 8. The lowest point of attrition (0.2%) was determined. It seems that at the average activation temperature and the minimal activation time, the resistance to attrition increases. Furthermore, Figure 9 shows that the lower attrition value is obtained when the steam flow is increased and the activation time decreased.
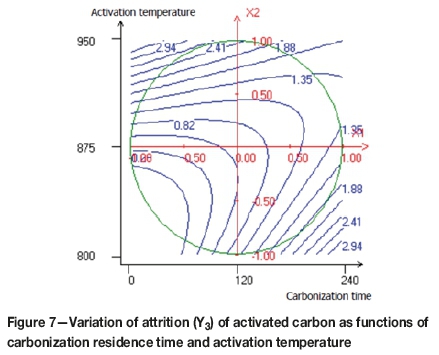
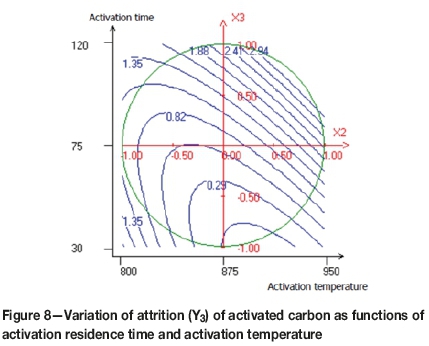
The attrition test is a critical performance indicator for activated carbon, with resistance to attrition depending mainly on preparation conditions. Resistance to attrition can be improved by reducing the activation time. Indeed, a long activation time leads to the weakening of the carbon structure and increases the surface area by opening up the micropores, as indicated by a higher iodine number.
Multi-criteria optimization using desirability function
The aim of this study was to identify the optimal conditions for preparation of activated carbon with good characteristics for use in gold adsorption. The comparison of optimal conditions for responses Y1, Y2, and Y3 shows that the maximization of each response was not obtained at the same conditions. To determine an acceptable compromise zone, responses were simultaneously optimized by using the desirability functions approach (Derringer and Suich, 1980) included in the NEMROD software (Mathieu et al., 2000).
Desirability function approach
This method first converts each estimated response Yi into an individual scale-free desirability function di that ranges from zero (outside of the desired limits, if Yi < Yi,min) to unity, the target (desired) value (if Yi > Yi,max), where Yi,min and Yi,max are the lower and upper acceptability bounds for response i, respectively.
The lower and upper acceptability bounds were set at the extreme values, which were selected according to quality criteria for the activated carbon used in the gold industry. Since the response surface had been reasonably explored in the range of studied variables, the weights for the first two responses, Y1 (yield) and Y2 (iodine number), were set to unity. The third response, Y3 (attrition), was set to two because the friability of activated carbon is the most important criterion to monitor during preparation.
Once the function di is defined for each response of interest, an overall objective function (D), representing the global desirability function, is calculated by determining the geometric mean of individual desirabilities. Therefore, the function D over the experimental domain is calculated using the relationship D = (d1.d2.31)1/3.
The maximum of the function D gives the best global compromise in the studied domain and corresponds to optimal experimental conditions.
Optimized conditions
It was necessary to establish domains of variation of each response in relation to the material characteristics required. The activated carbon should have a yield mass between 12 and 30%, the iodine number should be greater than 1000 mg/g, and the attrition should be lower than 2%. To optimize all responses under the same conditions was difficult, because most of the regions of interest are different. For example, if the iodine number (Y2) increases the attrition number (Y3) also increases, which is unsatisfactory. Therefore, in order to find a compromise, we have resorted to the function of desirability.
The compromise domain for the preparation of activated carbons with a high yield level, high iodine number, and low attrition number is depicted in Figures 10, 11, and 12.
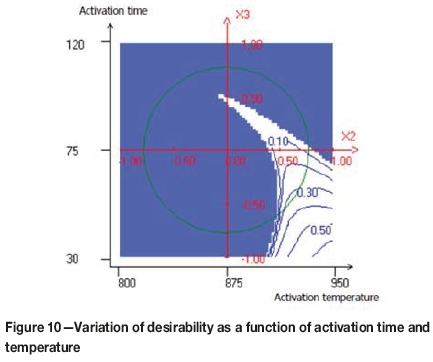
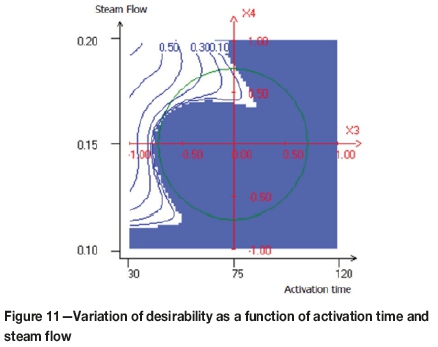
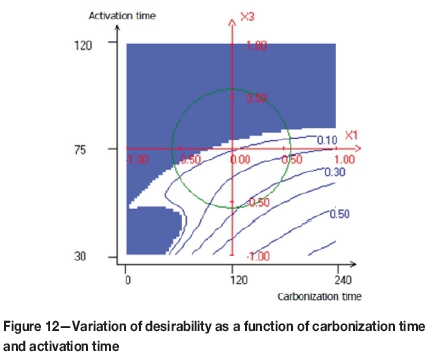
As can be observed in Figure 10, the maximum value of the desirability function was obtained when the activation time was less than 60 minutes and the activation temperature greater than 900°C. Figure 11 shows the variation of the desirability as a function of the activation time and steam flow. It seems that, the maximum desirability was obtained at a higher value of steam flow and an activation time less than 60 minutes. Figure 12 shows the combined effect of carbonization time and activation time. The maximum value of the desirability function was obtained when the carbonization time increased and the activation time decreased.
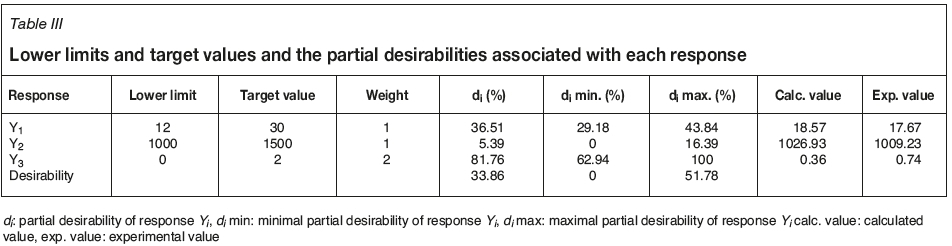
The optimal point indicated by the model corresponds to a carbonization residence time of 157 minutes, an activation temperature of 921°C, an activation time of 53 minutes, and a steam flow of 0.18 mL/min. In order to test the validity of this method, three samples of activated carbon were prepared under the optimal experimental conditions. The characteristics of are samples are shown in Table III, together with those calculated from the model. The experimental values agree well with those calculated from the model.
Physical and chemical properties of the optimum carbon
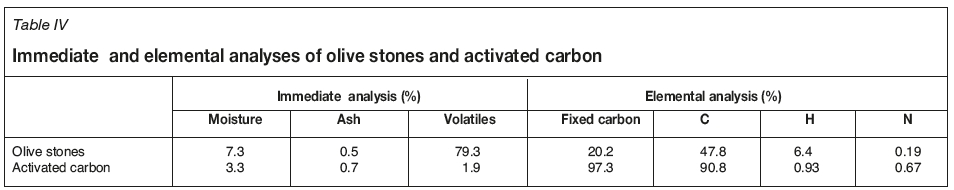
The immediate and elemental analyses of the olive stones and activated carbon prepared under the optimum conditions are given in Table IV.
As can be seen, the fixed carbon content was greater in activated carbon (97.3%) than in the raw material (20.2%), due to the release of volatile components during the activation step, as shown by the decrease in volatile content in the activated carbon sample (1.9%). After activation, a significant reduction was observed for many bands in the FT-IR spectrum. For example, in the spectrum of activated carbon (Figure 13), a significant decrease in the intensity of the band located at 3425 cm-1, assigned to the reduction of hydrogen bonding, was observed. Due to the dehydrating effect of activation, the decrease of the bands at about 2374 and 2923 cm-1, ascribed to asymmetric (C-H) stretching, indicated that the hydrogen content decreases, which is confirmed by the elemental analysis given in Table IV. The decrease of the band at 1700 cm-1 corresponding to C=O may be due to the decomposition of these groups during activation. The disappearance of the band located at 1639 cm-1 corresponding to olefines, and the appearance of the band at 1569 cm-1 attributed to the aromatic C=C bond, can be explained by the fact that the structure of activated carbon becomes richer in aromatics. The vibration at 1433.79 cm-1 is assigned to the asymmetric and symmetric bending of (C-H). A significant reduction was observed for the bands located between 850 and 1300 cm-1, which include (C-O) in carboxylic acids, alcohols, and esters. The intense band at 592 cm-1 was ascribed to the stretching vibration (C-C).
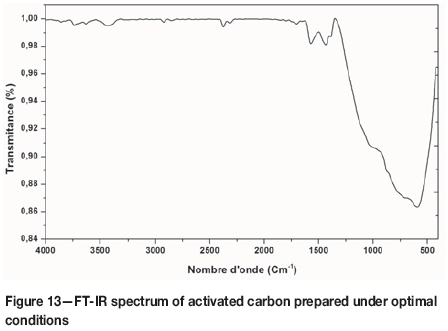
FT-IR and chemical analysis demonstrate that during this study, an activated carbon with good properties was prepared from olive stone.
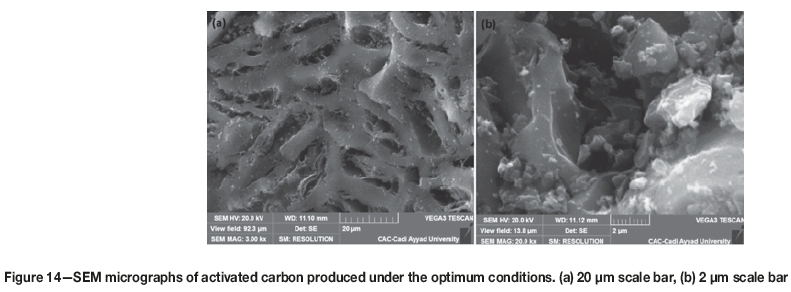
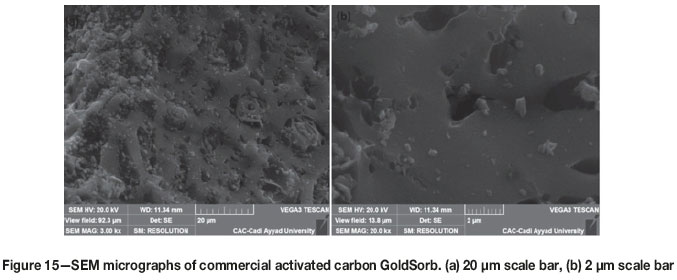
The porous nature and surface structure of the activated carbon were examined using scanning electron microscopy (SEM). The specific surface area (SBET) was determined from the adsorption-desorption isotherm of N2 at 77K (Brunauer, Emmett, and Teller, 1951). The activated carbon produced under the optimal conditions had a specific surface area of 1073 m2/g with an average pore size of 1.4 nm. The specific surface area of our activated carbon is similar to that of commercial activated carbon (1100 m2/g). The SEM images presented in Figures 14 and 15 show the morphologies of the two activated carbons (GoldSorb and the optimal activated experimental carbon). A porous surface can be seen, with mainly a microporous and mesoporous structure, which will provide the maximum number of possible gold loading sites for both activated carbons.
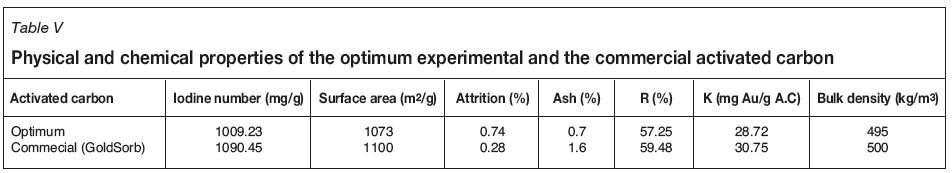
The textural characteristics of the activated carbon obtained from olive stones are similar to those of the commercial activated carbon GoldSorb, which is used extensiveily in the gold industry (Table V). It was found that the prepared activated carbon has a high iodine number, very low ash content, low attrition, and a strong affinity for gold. From Table VI it can be seen that the particle size and the size distribution of the activated carbon prepared from olive stones were lower than those of the commercial activated carbon. Consequently, the size of granules of the raw material during the crushing stage must be increased.
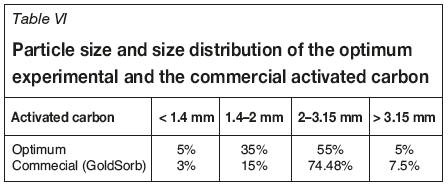
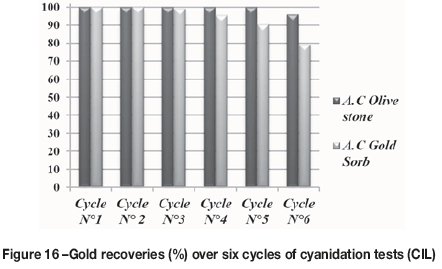
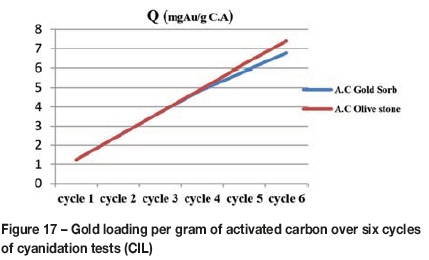
Figure 16 illustrates the percentage gold recovery in the cyanidation test (CIL) after having recycled the activated carbon six times. It can be seen that the prepared activated carbon based on olive stones performs comparably to the commercial carbon (GoldSorb). The percentage gold recovery with commercial activated carbon decreases from the third cycle and reaches 79.2% at the last cycle. The activated carbon based on olive stones achieved a 100% gold recovery in cycles 1 to 5, and 96% in the sixth. This result was confirmed by analysis of the carbon after each cycle. Figure 17 shows the gold loading per gram of activated carbon. It is concluded that the adsorption capacity of the activated carbon prepared from olive stones is superior to that of the commercial carbon.
Conclusion
The response surface method (RSM) was used to optimize the process conditions for the preparation of activated carbon based on olive stones and its affinity for gold.
> Olive stones are a good precursor for producing efficient activated carbon with high performance for use in the gold industry.
> Experimental design and the response surface methods were used to determine the acceptable compromise zone of preparation conditions. Analysis of the effects of carbonization time, activation temperature, activation time, and steam flow showed that the most important factors affecting the iodine number and attrition are the activation temperature and the activation time.
> Doehlert design, response surface methodology, and multi-criteria optimization using desirability functions were used to determine the acceptable compromise zone for yield, iodine number, and attrition. The optimal conditions were identified as a carbonization residence time of 157 minutes, an activation temperature of 921°C, an activation time of 53 minutes, and a steam flow of 0.18 mL/min.
> The activated carbon produced under the optimal conditions had a high iodine number and a low attrition rate. The gold adsorption capacity was similar to that of the commercial activated carbon and the carbon performed well in CIL tests.
The studies suggest that olive stones can serve as a precursor for activated carbon to be used as an alternative to the imported commercial activated carbon (coconut-shell based) used in the Moroccan gold extraction industry.
Acknowledgments
The authors gratefully acknowledge the Higher Education Ministry of the Kingdom of Morocco, the Center for International Cooperation in Agronomic Research for Development (CIRAD), and the Department of Chemistry, Science Faculty, Semlalia Marrakech, Cadi Ayyad Marrakech University.
References
Aigner, Z., Berkesi, O., Farkas, G., and Szabo-Revesz, P. 2012. DSC, X-ray and FTIR studies of a gemfibrozil/dimethyl-beta-cyclodextrin inclusion complex produced by cogrinding. Journal of Pharmaceutical and Biomedical Analysis, vol. 57. pp. 62-67. [ Links ]
Afnor Group. 2005. Biocombustibles solides - Détermination de la teneur totale en carbone, hydrogène et azote - Méthodes instrumentals. Paris. [ Links ]
Arriagad, R. and Garcia, R. 1997. Retention of aurocyanide and thiourea-gold complexes on activated carbons obtained from lignocellulosic materials. Hydrometallurgy, vol. 46. pp. 171-180. doi: 1016/S0304-386X(97)00010-8 [ Links ]
ASTM. 2006. D 4607-94. Standard test method for determination of iodine number of activated carbon. ASTM International, West Conshohocken, PA. [ Links ]
ASTM. 2016. D5373-16. Standard test methods for determination of carbon, hydrogen and nitrogen in analysis samples of coal and carbon in analysis samples of coal and coke. ASTM International, West Conshohocken, PA. [ Links ]
Baçaoui, A., Yaacoubi, A., Dahbi, A., Bennouna, C.. Ayele, J., and Mazet, M. 1998. Characterization and utilization of a new activated carbon obtained from Moroccan olive wastes. Journal of Water Supply: Research and Technology, vol. 47, no. 2. pp. 68-75 [ Links ]
Baçaoui, A., Yaacoubi, A., Dahbi, A., Bennouna, C., Phan-tan-Luu, R., Modano-Hodar, F.J., River-Utrilla, J., and Moreo-Castilla, C. 2001. Optimization of conditions for the preparation of activated carbons from olive-waste cakes. Carbon, vol. 39, no. 3. pp. 425-432. [ Links ]
Bansal, R.C., Donnet, J.B., and Stoeckli, F. 1988. Active Carbon. Marcel Dekker, New York. [ Links ]
Brunauer, S., Emmett, P.H., and Teller, E. 1938. Journal of the American Chemical Society, vol. 60. p. 309 . [ Links ]
Buah, W.K. and Williams, P.T. 2010. Activated carbons prepared from refuse derived fuel and their gold adsorption characteristics. Environmental Technology, vol. 31, no. 2. pp. 125 137. doi: 10.1080/09593330903386741 [ Links ]
DERRiNGER, G. and SuiCH, R. 1980. Simultaneous optimization of several response variables. Journal of Quality Technology, vol. 12. pp. 214-219. [ Links ]
Doehlert, D.H. 1970. Uniform shell design. Applied Statistics, vol. 19, no. 3, pp. 231-239. doi: 10.1155/2103/549729. [ Links ]
Gergova, K., Petrov, N., and Minkova, V. 1993. A comparison of adsorption characteristics of various activated carbon. Journal of Chemical Technology & Biotechnology, vol. 56. pp. 77-82. doi: 10.1002/jctb.280560114 [ Links ]
Gratuito, M.K.B., Panyathanmaporn, T., Chumnanklang, R.-A., Sirinuntawittaya, N., and Dutta, A. 2008. Production of activated carbon from coconut shell: optimization using response surface methodology. Bioresource Technology, vol. 99. pp. 4887-4895. doi: 10.1016/j.biortech.2007.09.042 [ Links ]
Guinesi, L.S. and Cavalheiro, E.T.G. 2006. The use of DSC curves to determine the acetylation degree of chitin/chitosan samples. Thermochimica. Acta, vol. 444. pp. 128-133. doi: 10.1016/j.tca.2006.03.003 [ Links ]
Guinesi, L.S. and Cavalheiro, E.T.G. 2006. The use of DSC curves to determine the acetylation degree of chitin/chitosan samples. Thermochimica. Acta, vol. 444. pp. 128-133. doi:10.1016/j.tca.2006.03.003 [ Links ]
Hameed, B.H., Tan, I.A.W., and Ahmad, A.L. 2009. Preparation of oil palm empty fruit bunch-based activated carbon for removal of 2,4,6- trichlorophenol: optimization using response surface methodology. Journal of Hazardous Materials, vol. 164. pp. 1316-1324. doi: 10-1016/j.hazmat.2008.09.042 [ Links ]
Jamari, S.S. and Howse, J.R. 2012. The effect of the hydrothermal carbonization process on palm oil empty fruit bunch. Biomass & Bioenergy, vol. 47. pp. 82-90. doi: 10.1016/j.biombioe.2016.09.061 [ Links ]
Jaramillio, J., Gomez-Serrano, V., and A'lvareza, P.M. 2009. Enhanced adsorption of metal ions onto functionalized granular activated carbons prepared from cherry stones. Journal of Hazardous Materials, vol. 161. pp. 670-676. doi: 10/1016/j.jhazmat2008.04.009 https://www.sciencedirect.com/science/article/pii/S030438940800530X [ Links ]
Jimenez-Cordero, D., Heras, F., Alonso-Morales, N., Gilarranz, M.A., and Rodriguez, J.J. 2014. Preparation of granular activated carbons from grape seeds by cycles of liquid phase oxidation and thermal desorption. Fuel Processing Technology, vol. 118. pp. 148-155. doi: 10.1016/j.fuproc.2013.08.019 [ Links ]
Lua, A.C. and Guo, J. 2000. Activated carbon prepared from oil palm stone by one-step Co2 activation for gaseous pollutant removal. Carbon, vol. 38. pp. 1089-1097. doi: 10.1016/S0008-6223(99)00231-6 [ Links ]
Mathieu, D., Nony, J., and Phan-tan-Luu, R. 2000. NEMROD-W software. Société LPRAI, Marseille, France. [ Links ]
Mpinga, C.N., Bradshaw, S.M., Akdogan, G., Snyders, C.A., and Eksteen, J.J. 2014. The extraction of Pt, Pd, and Au from an alkaline cyanide simulated heap leachate by granular activated carbon. Minerals Engineering, vol. 55. pp. 11-17. doi: 10.1016/j.mineng.2013.09.001 [ Links ]
NORME. AFNOR XP CEN/TS 14 774-3. [ Links ]
Poinern, G.E.J., Senanayake, G., Shah, N., Thi-Le, X.N., Parkinson, G.M., and Fawcett, D. 2011. Adsorption of the aurocyanide, Au(CN)2- complex on granular activated carbons derived from macadamia nut shells - A preliminary study. Minerals Engineering, vol. 24. pp. 1694-1702. doi: 10.1016/j.mineng2011.09.011 [ Links ]
Raminez-Muniz, K., Song, S., Berber-Mendoza, S., and Tong, S. 2010. Adsorption of the complex ion Au(CN)2- onto sulfur-impregnated activated carbon in aqueous solutions. Journal of Colloid and Interface Science, vol. 349. pp. 602-606. doi: 10.1016/j.cis.2010.05.056 [ Links ]
Sahin, O. and Saka, C. 2013. Preparation and characterization of activated carbon from acorn shell by physical activation with H2O-CO2 in two-step pretreatment. Bioresource Technology, vol. 136. pp. 163-168. doi: 10.1016/j.biortech.2013.02.074 [ Links ]
Sevilla, M, and Fuertes, AB. 2009. The production of carbon materials by hydrothermal carbonization of cellulose. Carbon, vol. 47. pp. 2281-2289. doi: 10.1016/j.carbon.2009.04.026 [ Links ]
Snell, F.D. and.ETTRE, L.S. 1968. Encyclopedia of Industrial Chemical Analysis. vol. 8. Interscience, New York. p. 179. [ Links ]
Soleimani, M. and Kaghazchi, T. 2008. Adsorption of gold ions from industrial wastewater using activated carbon derived from hard shell of apricot stones - An agricultural waste. Bioresource Technology, vol. 99. pp. 5374-5383. doi: 10.1016/j.biortech.2007.11.021 [ Links ]
Souza, C., Majuste, D., Dantas, M.S.S., and Ciminelli, V.S.T. 2014. Selective adsorption of gold over copper cyanocomplexes on activated carbon. Hydrometallurgy, vol. 147-148. pp. 188-195. doi: 10.1016/j.hydromet.2014.05.017 [ Links ]
Staunton, W.P. 2016. Gold recovery (carbon-in-pulp). Development in Mineral Processing, vol 15, chapter 30. Elsevier. [ Links ]
Suhas, G.V.K. Carrott, P.J.M., and Ribeiro Carrott, M.M.L. 2007. Lignin - from natural adsorbent to activated carbon: a review. Bioresource Technology, vol. 98. pp. 2301-2312. doi: 10.1016/j.biortech.2006.08.008 [ Links ]
Sumathi, S., Bhatia, S., Lee, K.T., and Mohamed, A.R. 2009. Optimization of microporous palm shell activated carbon production for flue gas desulphurization: Experimental and statistical studies. Bioresource Technology, vol. 100. pp. 1614-1621. doi: 10.1016/j.biortech.2008.09.020 [ Links ]
Sundqvist, B., Karlsson, O., and Westermark, U. 2006. Determination of formic-acid and acetic acid concentrations formed during hydrothermal treatment of birch wood and its relation to colour, strength and hardness. Wood Science and Technology, vol. 40. pp. 549-561. doi: 10.1007/S00226-006-0071-z [ Links ]
Syna, N., and Valix, M. 2003. Modelling of gold (I) cyanide adsorption based on the properties of activated bagasse. Minerals Engineering, vol. 16. pp. 421-427. doi: 10.1016/S0892-6875(03)00053-0 [ Links ]
Toles, C.A., Marshall, W.E., Johns, M.M., Wartelle, L.H., and Aloon, A.M. 2000. Acid-activated carbons from almond shells: physical, chemical and adsorptive properties and estimated cost of production. Bioresource Technology, vol. 71. pp. 87-92. doi: 10.1016/S0960-8524(99)00029-2 [ Links ]
Wu, M., Guo, Q.J., and Fu, G.J. 2013. Preparation and characteristics ofmedicinal activated carbon powders by Co2 activation of peanut shells. Powder Technology, vol. 247. pp. 188-196. doi: 10.1016/j.powtec.2013.07.013 [ Links ]
Yalcin, M. and Arol, A.I. 2002. Gold cyanide adsorption characteristics of activated carbon of non-coconut shell origin. Hydrometallurgy, vol. 63. pp. 201-206. doi: 10.1016/S0304-386X(01)00203-1 [ Links ]
Yavuz, R., Akyildiz, H., Karatepe, N., and Çetinkaya, E. 2010. Influence of preparation conditions on porous structures of olive stone activated by H3PO4. Fuel Processing Technology, vol. 91. pp. 80-87. doi: 10.1016/j.fuproc.2009.08.018 [ Links ]
Paper received Jun. 2018
Revised paper received Aug. 2018

