


Services on Demand
Article
 English (pdf)
 Article in xml format
 Article references
Indicators

Related links
-
 Cited by Google
 -
 Similars in Google
Share

 Permalink
Journal of the Southern African Institute of Mining and Metallurgy
On-line version ISSN 2411-9717
Print version ISSN 2225-6253
J. S. Afr. Inst. Min. Metall. vol.119 n.3 Johannesburg Mar. 2019
http://dx.doi.org/10.17159/2411-9717/2019/v119n3a7
PROFESSOR DICK MINNITT SPECIAL EDITION
Mapping hydrothermal minerals using remotely sensed reflectance spectroscopy data from Landsat
M.A. MahboobI; B. GencI; T. CelikII; S. AliIII; I. AtifIII
ISchool of Mining Engineering, University of the Witwatersrand, South Africa
IISchool of Computer Science and Applied Mathematics, University of the Witwatersrand, South Africa
IIISchool of Advanced Geomechanical Engineering, National University of Sciences and Technology (NUST), Pakistan
SYNOPSIS
Mapping of hydrothermally altered areas, which are usually associated with mineralization, is essential in mineral exploration. In this research, open source reflectance spectroscopy data from the multispectral moderate-resolution Landsat 8 satellite was used to map altered rocks in the Gauteng and Mpumalanga provinces of South Africa. The unique spectral reflectance and absorption characteristics of remotely sensed Landsat data in the visible, near-infrared (NIR), shortwave-infrared (SWIR) and thermal infrared (TIR) regions of the electromagnetic spectrum were used in different digital image processing techniques. The band ratios (red/blue, SWIR 2/NIR, SWIR 1/NIR), spectral band combinations (Kaufmann ratio, Sabins ratio) and principal component analysis (Crosta technique) were applied to efficiently and successfully map hydrothermal alteration minerals. The results showed that the combination of spectral bands and the principal component analysis method is effective in delineating mineral alteration through remotely sensed satellite data. The validation of results by using the published mineral maps of the Council for Geoscience South Africa showed a good relationship with the identified zones of mineralization. The methodology developed in this study is cost-effective and time-saving, and can be applied to inaccessible and/or new areas with limited ground-based knowledge to obtain reliable and up-to-date mineral information.
Keywords: remote sensing, mineral mapping, reflectance spectroscopy, Landsat, mineral exploration, hydrothermal alteration.
Introduction
Many developing nations depend on exploration and exploitation of mineral resources to sustain their economic growth. Usually, the traditional mineral exploration techniques require enormous finances, prolonged time, and tremendous manpower, particularly in areas that are not easily reachable (Maduaka, 2014). Furthermore, mineral exploration required state-of-the-art techniques and expertise along with geological, geochemical, and geophysical data-sets, which may not be easily available or may be lacking where access is problematic (Kaiser et al., 2002; Bemis et al., 2014). Modern remote sensing technology has proved to be one of the highly efficient and robust techniques used for mineral exploration. The use of remote sensing satellite images for geological mapping and mineral exploration usually involves studying the physicochemical properties of rocks and weathering soils, such as mineralogy, landforms, geochemical signatures, and the spatiall distribution of lineaments (Bhattacharya et al., 2012).
A fundamental principle of mineral exploration is that it is quite possible that undiscovered deposits will be located in the close vicinity of discovered ones. For example, if mining is taking place in a particulat area, then similar minerals will be more likely found nearer to the discovered deposit, and as the distance increases, the likelihood of new discoveries will decrease. In that situation, before drilling exploratory boreholes at new locations, remote sensing can be used effectively to identify regions with higher chances of mineralization, mainly through multi- or hyperspectral remote sensing images (Gholami, Moradzadeh, and Yousef, 2012; Ciampalini et al., 2013). The use of reflectance spectroscopic information derived from remote sensing data allows effective localization of mineral exploration and reduces the cost and time spent on fieldwork for geological, geophysical, and geochemical studies (Short and Lowman Jr, 1973; Tedesco, 2012; Marjoribanks, 2010). Several remote sensing studies for mineral exploration and lithological mapping have been done in arid and semi-arid regions. In areas with good geological exposure, satellites in orbit are capable of acquiring spectral reflectance data directly from rock or/and soils (Sabins, 1999; Di Tommaso and Rubinstein, 2007; Zhang et al., 2007; Pour and Hashim, 2012; Mahboob, Iqbal, and Atif, 2015).
Hydrothermal alteration minerals with diagnostic spectral absorption properties in the visible and near-infrared through the shortwave length infrared regions can be identified by multispectral and hyperspectral remote sensing data as a tool for the initial stages of porphyry copper and epithermal gold exploration (Di Tommaso and Rubinstein, 2007; Zhang, Pazner, and Duke, 2007; Ramakrishnan and Bharti, 2015). In general, porphyry copper deposits are formed by hydrothermal alteration of fluids. These altered rocks can be identified through their spectral characteristics in the visible and infrared wavelengths (Pour and Hashim, 2012). Many minerals have unique and characteristic spectral properties, with a specific amount of electromagnetic (EM) energy reflected and/or absorbed at a particular wavelength, which can be used to identify them with a high degree of confidence. The portion of the electromagnetic spectrum from 0.4 to about 2.5 μm (the visible, near-infrared, and shortwave-infrared region) is useful to sense the geological features with moderate and low-temperature properties because most of the sunlight is reflected in this portion of the spectrum (Mahboob, Iqbal, and Atif., 2015a).
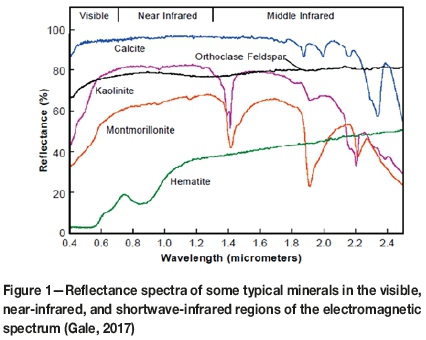
Usually, Iron oxides, oxyhydroxides, and ligands can be mapped very well in this range of the electromagnetic spectrum because of their high- or low-temperature alteration characteristics (Clark et al., 1990). This portion of the spectrum can also be used for differentiation between silicate (clay) minerals and other features. This spectral differentiation of minerals has been the basis for the use of this technique in mineral exploration (Calvin, Littlefield, and Kratt, 2015). The thermal infrared (TIR) portion of the spectrum, usually from 7 to 14 μm, senses the energy emitted from the Earth's surface. In addition to water, carbonates, and sulphates, this region of the electromagnetic spectrum is also sensitive to Si-O bonds in silicates (Repacholi, 2012; Udvardi et al., 2017; Manley, 2014). The spectral signatures of some typical minerals (calcite, orthoclase feldspar, kaolinite, montmorillonite, and haematite) that can be clearly and confidently mapped using reflectance spectroscopy data ( i.e. hyperspectral data) are shown in Figure 1.
In this study, the identification of hydrothermally altered rocks and features associated with hydrothermal mineralization in South Africa's Gauteng and Mpumalanga provinces is examined using Landsat 8 (originally known as Landsat Data Continuity Mission (LDCM)) remote sensing reflectance spectroscopy.
Material and methods
Study area
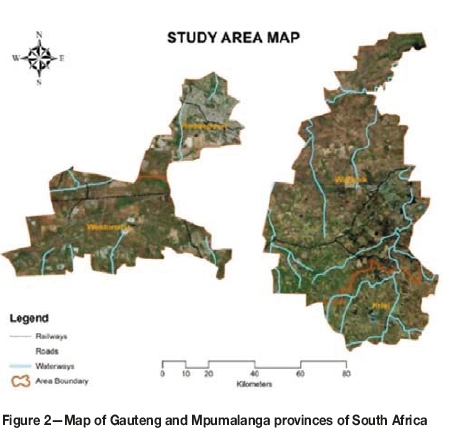
The study areas for this research were Roodepoort and Westonaria in Gauteng Province and Witbank and Kriel in Mpumalanga Province, as shown in Figure 2.
Gauteng's name is derived from the Sotho, 'Gauta' which means 'gold', with the local suffix '-eng'. Gauta has been taken from the Dutch word for gold, 'goud'. The main economic sectors are financial services, business services, logistics, communications, and mining. The most significant geological formation in Gauteng is the Witwatersrand Supergroup. Gold in this region was derived from granite-greenstone terranes and transported to and concentrated in the Witwatersrand Basin by fluvial activity. Gauteng was built upon the wealth of gold found deep underground, i.e. almost 40% of the world's reserves (Durand, 2012).
Mpumalanga is another mineral-rich province of South Africa. The general geology of of this area consists of mudrock, siltstones, sandstones, conglomerate, and several coal seams. Mpumalanga accounts for 83% of South Africa's coal production. Ninety per cent of South Africa's coal consumption is used for electricity generation and the synthetic fuel industry (Dabrowski et al., 2008).
Remote sensing data
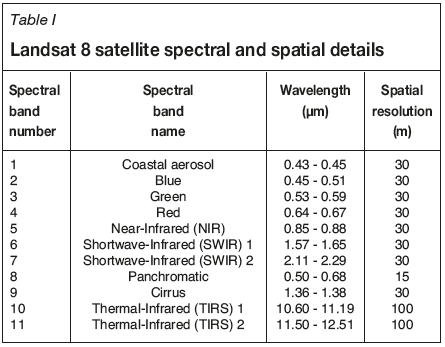
Usually, ASTER is the most commonly used satellite data for hydrothermal mineral mapping and exploration. However, since 2008, ASTER's six SWIR sensors have not been operational because of malfunctioning (Wessels et al., 2013). Landsat data is also free and is used in mapping and exploration of hydrothermally altered minerals and rocks. In this research, the cloud-free level 1T (L1T) data from the Landsat 8 satellite (path 170 / row 78) recorded in August 2017 was used. Landsat images are processed in units of absolute radiance using 32-bit floating-point calculations. These values are then converted to 16-bit integer values in the finished Level 1 product (Chander and Markham, 2003). Landsat 8 is equipped with the Operational Land Imager (OLI) and the Thermal Infrared Sensor (TIRS); their spatial and spectral characteristics are shown in Table I. A single Landsat 8 image covers an area of 170 km (north-south) by 183 km (east-west).
Satellite image pre-processing
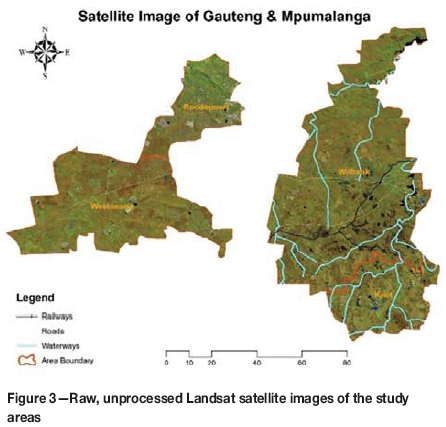
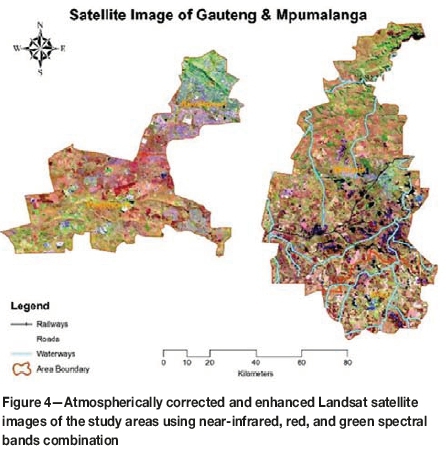
The pre-processing of raw satellite images is necessary to obtain geometrically and atmospherically corrected images so that the spectral information can be extracted and analysed. The raw satellite images of the study areas are shown in Figure 3.
The geometric correction entails the georeferencing of satellite images with respect to ground control points in order to obtain pixels with the same dimensions. For atmospheric corrections there are two different approaches: relative normalization (Schroeder et al., 2006) and absolute correction (Chavez, 1996; Song and Woodcock, 2003). Relative normalization includes radiometric correction of the Landsat data-sets with respect to a reference image based on the correlation between pseudo-invariant objects from multi-date images (Song et al., 2001). Absolute correction can be subdivided into two more categories: empirical and physical-based methods. In the empirical approach, the spectral properties of the ground features are used for transforming the spectral data from the sensor's radiance to ground reflectance. Empirical methods are simple but do not incorporate the pixel-to-pixel variation in atmospheric effects, whereas the physical-based methods, such as Atmospheric/Topographic CORrection or ATCOR (Richter, 1997), MODerate resolution atmospheric TRANsmission or MODTRAN (Berk et al., 1998), and the Satellite Signal in the Solar Spectrum (6S) code (Vermote et al., 1997), incorporate the heterogeneity of the atmosphere but require several complicated and manual procedures, which make it difficult to process large amounts of satellite data. On the other hand, the Landsat Ecosystem Disturbance Adaptive Processing System (LEDAPS) software (Masek et al., 2006), which has implemented the 6S code, made atmospheric correction for Landsats 4-7 fully automated. Recently, Vermote et al. (2016) derived an improved atmospheric correction algorithm for Landsat 8 (L8SR), which has shown an improvement over the ad-hoc Landsat 5-7 LEDAPS product. The modified LEDAPS product was applied in this study for atmospheric corrections as shown in Figure 4.
Spectral sub-setting
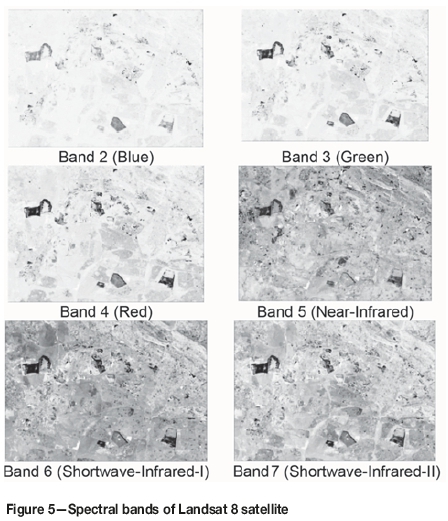
As OLI band 1 (coastal aerosol) is useful for imaging shallow waters and band 9 (cirrus) for detecting high-altitude clouds and tracking fine particles like dust and smoke, these two bands were not included in further analysis. Moreover, according to the literature, for mineral exploration mapping the most appropriate bands are located in the visible, NIR, and SWIR regions. In this research study, OLI bands 2-7 and TIRS bands 10-11 were used for advanced processing. All these bands were stacked as a single image using the layer stacking digital image processing technique (Mahboob, Atif, and Iqbal, 2015).
Conversion ofdigital number to reflectance
Usually, the L1T images of Landsat 8 consist of the digital numbers (DNs), which cannot be used due to lack of physically meaningful information and should be converted to surface reflectance. This conversion is required for quantification of different features in remote sensing data as it incorporates solar conditions (geometry, illumination, and intensity) when the images were captured. In this study, the data was converted to Top of Atmosphere (TOA) reflectance using radiometric coefficients as recommended by Roy et al. (2016), whereby DNs were converted to reflectance representing the ratio of the radiation reflected from a surface to the radiation striking it (Han and Nelson, 2015), as shown in Figure 5.
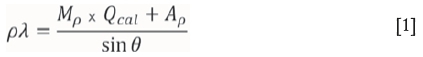
Equation [1] was used to convert DN values to TOA reflectance (Zanter, 2016):
where
Px = Top of Atmosphere Planetary Reflectance (dimensionless)
Mp= Reflectance multiplicative scaling factor for the band
Ap = Reflectance additive scaling factor for the band
Qcal = Level 1 pixel value in DN
θ = Solar elevation angle (degrees).
Reflectance spectroscopy ofsatellite imagery
The data captured by Landsat 8 represents the reflected and/or emitted spectral energy, which can be further used based on the absorption characteristics of spectra to detect different materials and features of the Earth's surface. Some minerals and mineral groups in hydrothermally altered rocks have unique absorption characteristics in the EM spectrum. For example, some alunite and clay ores have unique absorption features at approximately 2.1 μm, and their spectral responses are much higher at approximately 1.7 μm
(Sabins, 1999). Usually, minerals like iron oxide and sulphate have low and high reflectances in the ultraviolet/blue and near-infrared portion of the EM spectrum respectively (Johnson et al., 2016), hence these minerals have a rusty shade in a natural colour image.
Band-ratioing ofsatellite imagery
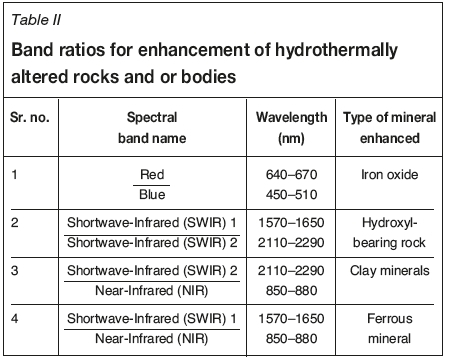
Band-ratioing is a digital image-processing technique that enhances the contrast between features by dividing a measure of reflectance for the pixels in one band by that of the pixels in another band of the same satellite image. This technique has been widely used for visualizing and mapping hydrothermally altered rocks. For example, Han and Nelson (2015) efficiently used the image ratios of Landsat Thematic Mapper (TM) band 5 (1.55-1.75 μm) over band 7 (2.092.35 μm) to differentiate areas with high concentrations of alunite and clay, where pixels in the satellite image appear bright. Another study, conducted by van der Meer (2004), used the ratio image of band 3 (0.63-0.69 μm) over band 1 (0.45-0.515 μm) to highlight areas with rich iron ores. In the current research work different band ratios, as shown in Table II, were developed and applied in order to enhance hydrothermally altered rocks and lithological units. The selection of bands is related to the spectral reflectance and position of the absorption bands of the mineral or assemblage of minerals to be mapped.
Even though the band-ratioing technique works very well for visualization, it is not capable of mapping or quantification of the land features. One of the reasons for this limitation is that most of the optical multispectral remote sensing instruments use the bandwidths > 0.05 μm, which is too wide to explicitly differentiate the unique spectral absorptions related to specific alteration minerals (van der Meer, 2004). Furthermore, many band-ratioing techniques use only two or (sometimes) three bands, whereas multispectral remote sensing instruments offer many more bands than that. Based on these limitations, there is a need to adopt another advanced digital satellite image analysis approach which can utilize all available satellite bands together, as described in the following sections.
Spectral band combination
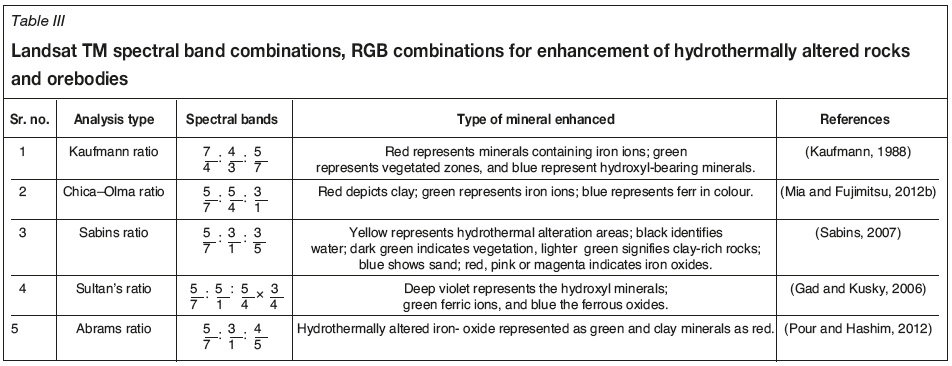
The spectral band combination technique, also known as red-green-blue (RGB) combination, is a very useful image enhancement technique which offered powerful means to visually interpret multispectral satellite data (Novak and Soulakellis, 2000). The band combinations of satellite data can be true (natural) or false-colour composites (FCC) using individual bands or band ratios. For this purpose, several band ratios and bands combinations have been developed over time to differentiate lithologies in a satellite image. A few examples are given in Table III.
In this research, the Kaufmann and Sabins ratios were applied to highlight the hydrothermally altered rocks associated with the minerals present in the study areas. Most research studies have applied these two ratios for the identification of altered areas and their associated minerals. For example, Mia and Fujimitsu (2012) and Abhary et al. (2016) applied the Kaufmann ratio for the mapping of minerals containing hydroxyl and iron ions using Landsat satellite data. Similarly, da Cunha Frutuoso (2015) used the Sabins ratio for the identification of sulphide deposits associated with the alteration areas of iron oxides.
Principal component analysis
Principal component analysis (PCA) is an advanced information extraction technique and is frequently used in the Earth sciences (Cheng et al., 2011, El-Makky, 2011). PCA is a well-known multivariate statistical method and has been generally used to study associations between variables. By orthogonal transformation, several correlated variables can be transformed into uncorrelated combinations (eigenvector loadings) of principal components (PCs) based on their covariance or correlation matrix (Horel, 1984; Loughlin, 1991). Generally, the first few PCs highlight the most variability in the original data-set (Panahi, Cheng, and Bonham-Carter, 2004). Therefore, PCA reduces the dimensionality and redundancy of data-sets and is commonly applied to enhance information interpretability (Cheng et al., 2011; Horel, 1984; Jolliffe, 2002). According to the algorithm for PCA, PCs are linear combinations of the original variables, whereas each PC incorporates the input variable uniquely and signifies only limited information within the complete dataset (Abdi and Williams, 2010). Due to its handling of multivariate data-sets, PCA has been extensively used in remote sensing for geological mapping of ores, igneous rocks, strata, etc. (Grunsky. Mueller, and Corrigan, 2014). Generally, the spectral properties of different features present in the area, i.e. vegetation, rocks, and soils, are responsible for the statistical variance mapped into each PC, which becomes the basis of the Crosta technique (Tangestani and Moore, 2001). In this study, the same technique has also been applied based on highly variable non-correlated satellite bands for hydrothermally altered rocks.
Results and discussion
The effectiveness of remote sensing-based hydrothermal minerals identification and mapping depends on the clear differentiation of the reflected spectra of altered bedrock from those of the other objects. The true colour composite of bands 3, 2, and 1 as red, green, and blue respectively highlighted the textural characteristics of the igneous rocks, which could be separated from those of sedimentary rocks. Pournamdari, Hashim, and Pour (2014) tested the same satellite band combinations and found them to be effective for differentiating igneous rocks in south Iran. The false-colour composite was assigned to bands 4, 3, and 2 as red, green, and blue respectively as shown in Figure 6 to analyse the reflected satellite spectroscopy. The false-colour composite is important to enhance the regional geological and geomorphological features, as also reported by Bedini (2009). Vegetation appeared in red shades because of the near-infrared (0.7-1.2 μm) band, which was highlighted with a red colour and vegetation reflects the maximum in this band.
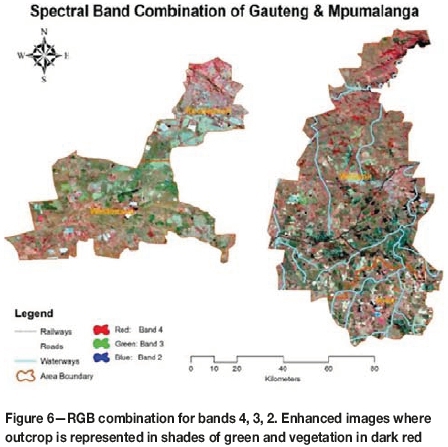
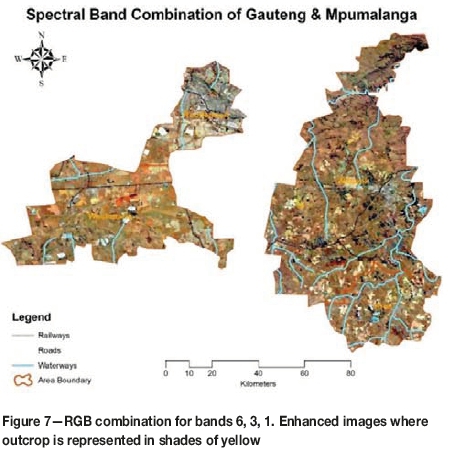
Hydrothermally altered clay and carbonate minerals are recognizable as yellow areas in crystalline igneous rocks in the Gauteng and Mpumalanga districts as shown in Figure 7. This may be due to clay and carbonate minerals having absorption in the 2.1-2.4 μm range (band 7 of Landsat 8) and reflectance at 1.55-1.75 μm (band 6 of Landsat 8) properties. Van der Meer (2004) also reported the same absorption and reflectance bands for the clay minerals using NASA's Airborne Visible/Infrared Imaging Spectrometer (AVIRIS) data. Another study, conducted by Zaini et al. (2016), concluded that clay and carbonates have the same absorption and reflectance bands and these can be effectively used to map them using reflectance spectroscopy.
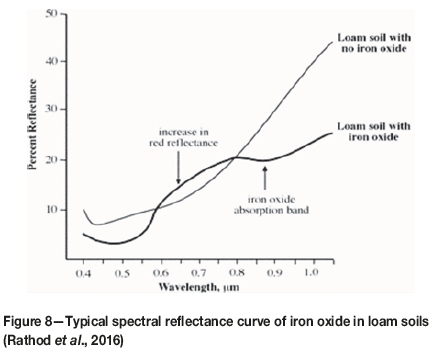
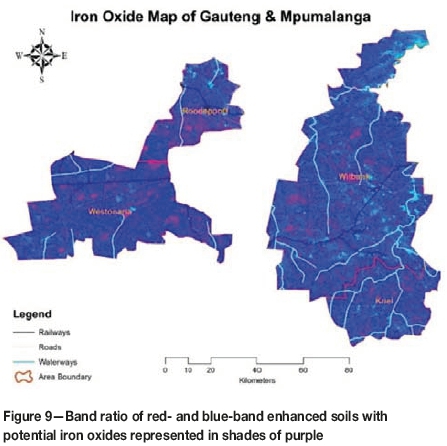
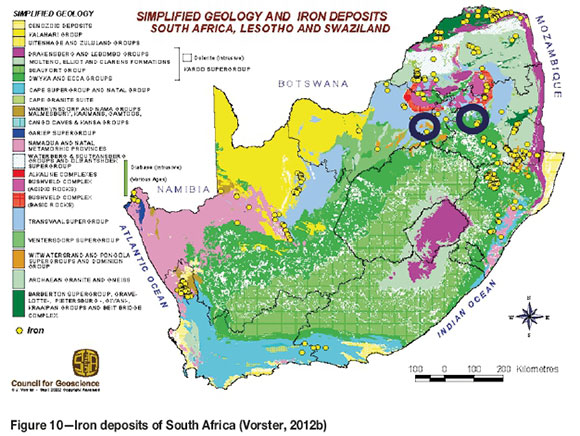
The iron oxides present within the study areas were highlighted by the spectral band ratio of red and blue bands as discussed in Table II. The soils rich in iron oxides reflect more in the red band of the spectrum, i.e. 0.64-0.67 μm and have absorption characteristics in the blue band i.e. 0.450.51 μm (Schwertmann, 1993). The typical reflectance curve of iron oxide-rich soils is shown in Figure 8. Pour and Hashim (2015) have also shown the importance of the red and blue bands of Landsat data for mapping of iron oxides in Iran. In 2017, Pour et al., also identified the iron-rich mineralized zones of remote Antarctica from Landsat imagery by using spectral band ratio techniques. The map of potential iron oxides present in the study areas derived from the band ratio of the red and blue wavelengths of the spectrum is shown in Figure 9. This map showed a good agreement with the Council for Geoscience (CGS) map of iron deposits of South Africa, as indicated in Figure 10. The areas highlighted in dark blue represent the iron deposits in Gauteng and Mpumalanga. In addition, the research conducted by Holmes and Lu (2015) supported the results of this study and highlights the potential of iron ore deposits in Gauteng and Mpumalanga.
Gold cannot be 'seen' directly in any remotely sensed satellite image. However, the presence of this precious metal can be mapped through its association with several other minerals based on their spectral reflectances (Kotnise and Chennabasappa, 2015). The group of minerals present in the alteration zones related to gold deposits generally includes the clay minerals illite-1M and illite-2M1, dioctahedral smectite, and kaolinite (Drews-Armitage, Romberger, and Whitney, 1996). These minerals have characteristic spectral signatures mostly in the shortwave infrared portion of the electromagnetic spectrum. These spectral signatures can be used to map the sites that are most favourable for the occurrence of gold deposits, which is very cost- and time-effective for mineral exploration programmes. The band combination of shortwave infrared 2 with spectral band 2.112.29 μm and near infrared with spectral band 0.85-0.88 μm in Figure 11 shows the areas which have the potential to host clay minerals in shades of red to yellow. Liu et al. (2018) applied various image-processing techniques, including false-colour composite, band ratios, and matched filtering, to process ASTER satellite data and map the distribution of hydrothermal minerals associated with gold deposits, and concluded that the SWIR and NIR bands are the most effective for this purpose.
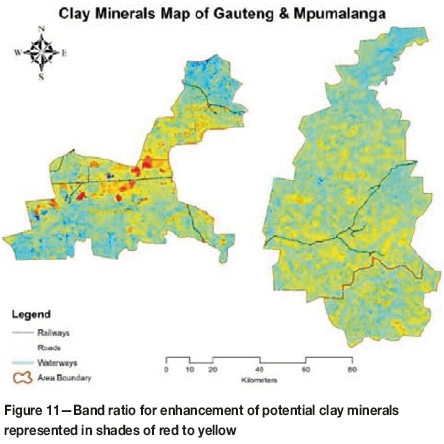
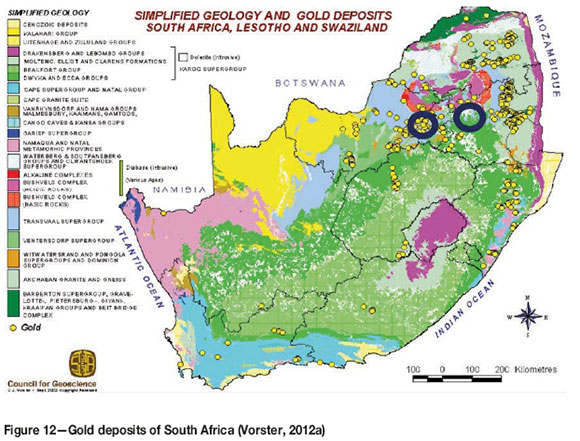
In general, clay minerals, which are associated with gold mineralization potential, are more widespread in Gauteng Province compared to Mpumalanga Province (Durand, 2012; Sutton et al, 2006; Sutton, 2013). The approach that was applied to map potential gold mineralization in this study has also been applied by several other researchers. Safari, Maghsoudi, and Pour (2017) used a similar approach to identify gold mineralization and concluded that the integration of remote sensing data with other information led to the definition of locations possibly suitable for hosting Sn-W and Au-Ag occurrences. Another study, conducted by Gabr, Ghulam, and Kusky (2010), utilized the shortwave infrared and near-infrared bands of ASTER to map highpotential gold mineralization in Egypt. However, through an optical sensor satellite, it is quite difficult to directly map any mineral located at depths of 100 m or more in the ground, as in the case of Gauteng. However, there are always indirect measurements from the surroundings, such as altered rocks or soils on the surface, which give an indirect indication of the presence of these minerals. In this study, the identified potential gold areas (Figure 11) can be associated with gold mining tailings, because no direct or indirect measurement can be used to map surface gold potential in Gauteng due to the geological setting of the region. The map of gold deposits published by the CGS (Figure 12) was used in order to verify/support the potential gold (tailings) identified in the area. The map shows that there are several gold deposits in Gauteng Province but none or very few in Mpumalanga, which supports the results of the gold (probably gold tailings) map (Figure 11) generated during this study.
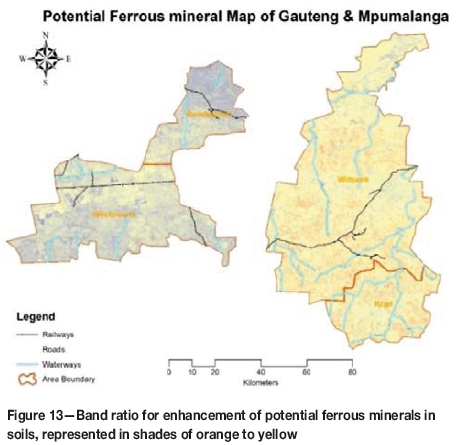
The other important band ratio comprising shortwave infrared and near infrared was applied for identification of ferrous minerals. The results showed that this band ratio technique produced good results for ferrous minerals in Gauteng but overestimated their occurrence in Mpumalanga. The soils with ferrous minerals reflect mostly in shortwave infrared 1 with spectral band 1.57-1.65 μm and near-infrared with spectral band 0.85-0.88 μm (Ducart et al., 2016) and are shown in Figure 13 in shades of orange to yellow.
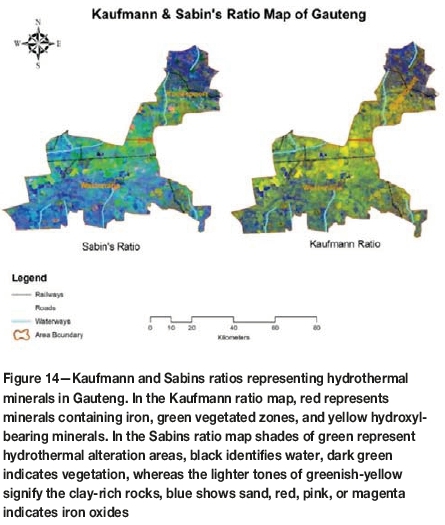
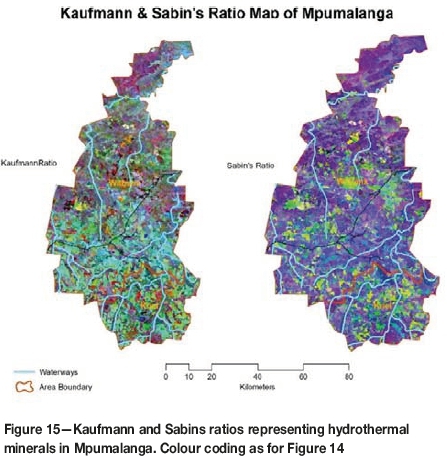
The Kaufmann and Sabins ratios were developed by combining spectral reflections of satellite bands ratios, and the results proved to be promising for mapping of hydrothermal minerals (Mahandani, 2018). Da Cunha Frutuoso (2015) applied the same ratios to map hydrothermal gold mineralization in Portugal and found them to be very effective and accurate. Figures 14 and 15 show the results obtained using these ratios for Gauteng and Mpumalanga respectively. In the Kaufmann ratio map, the red colour represents minerals containing iron; green represents vegetated zones, and yellow represents hydroxyl-bearing minerals. In the Sabins ratio map the shades of green represent hydrothermal alteration areas, black identifies water, the dark tones of green indicate vegetation, the lighter tones of greenish-yellow signify clay-rich rocks; blue shows sand, red, pink, or magenta indicates iron oxides. These colour shades for several Earth features and minerals are in accordance with the research done by Sabins (2007), and show the effectiveness of the Sabins ratio in mineral mapping.
Similarly, the outputs of PCA also revealed very good results in terms of hydrothermal mapping of minerals present in the study areas. In our study, the principal component transformation specifies that the first principal component (PC1) is composed of a negative weighing of all total bands, as shown in Table IV.
The PC1 is about 94.53% of the eigenvalue of the total variance for unstretched data of PCA. The eigenvector loadings for PC3 indicates that PC3 is dominated by vegetation, which is highly reflective in band 4; the positive loading of band 4 in this PC (0.602391) also indicates that strongly vegetated pixels will be bright in this PC image. Similar results were found by Cheng et al. (2011), as they have vegetation-dominated pixels in band 4 loadings for PC3.
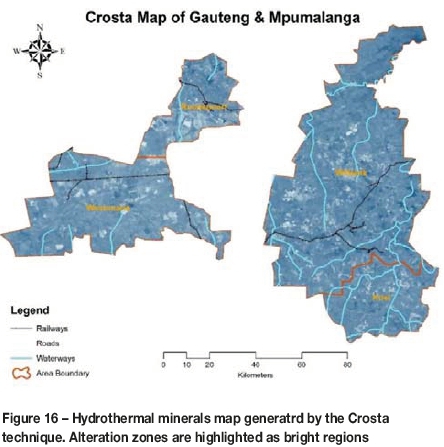
The eigenvalues for bands 2 and 4 in PC6 of Table IV are also opposite in sign, which indicates that iron oxides will be distinguished by bright pixels in PC6. PC5 can be used to map the hydroxyl-bearing minerals because of the positive and negative eigenvalues of bands 7 and 5 respectively, and these minerals appeared as dark. These selected PCs were further used in the Crosta technique; the hydroxyl (H) and iron oxide (F) images are combined with selected PCs to produce a map revealing the pixels indicating abnormal concentrations of both hydroxyls and iron oxides. The PCs having positive eigenvalues from both input bands are selected for the analysis. Figure 16 shows the Crosta images of hydroxyl (H), hydroxyl plus iron oxide (H+F), and iron oxide (F) as an RGB composite. This band combination returns a dark bluish composite image on which alteration zones are highlighted as bright regions, as also discussed by Ciampalini et al. (2013).
Validation of the results
The most common method to evaluate the results of this sort of mineral mapping is by spectrometer and/or spectral testing of samples in the laboratory. According to Clark (1999) there are two types of method for authentication of information extracted from remotely sensed imagery: virtual and in situ. If the spatial and/or spectral resolution of remotely sensed satellite data is fine and accurate then virtual verification can be done by inspecting the remote sensing data directly and comparing it with already published reports or data. In this paper, virtual verification, i.e. visual interpretation of absorption of spectral bands and comparison with the published maps by the CGS was used to evaluate the results of hydrothermal mineral exploration, along with the several similar research studies done by different researchers. Good qualitative agreement was observed for the results of PCA and the spectral reflectance of the satellite data.
Conclusions
This study confirms that Landsat reflectance spectroscopy data can be used easily and efficiently to map hydrothermal minerals. Different digital image processing algorithms and techniques were applied to assess their significance for hydrothermal mineral exploration. The principal component analysis (PCA)-based Crosta technique and band ratio techniques like the Kaufmann and Sabins ratios proved to be more significant and efficient for hydrothermal mineral exploration. Several researchers have also concluded that advanced image processing techniques like those applied and tested in the current study are quite efficient in terms of mineral mapping through remote sensing data (Manuel et al., 2017; Liu et al., 2018). The maps produced in this study are not only appropriate for any spatial queries and analysis, but also for environmental modelling such as assessing the impacts of mining activities on environmental features such as the forest, farmland, and urban areas. The hydrothermal minerals identified in this study are only the estimation based on literature-cited, proven algorithms for remotely sensed data, and should be treated as a preliminary assessment of the study areas. The other important point to consider is the resolution of the satellite data used in this study; Landsat 8 has a 30-100 m spatial and moderate spectral resolution. Data-sets with this kind of resolution may suffice for regional work but not for detailed mineral mapping. Using satellite data with higher spatial and spectral resolutions, such as that from Worldview 3 satellite (Kruse, 2015) or aerial drones, may be more suitable for detailed minerals mapping. Nevertheless, the maps developed in this research are a valuable data source for comprehensive studies to be conducted in the future. The methodology developed in this study is cost-effective and time-saving, and can be applied to inaccessible and/or new areas with limited ground-based knowledge where reliable and up-to-date minerals information is desired.
Acknowledgments
The work presented in this paper is part of a PhD research study in the School of Mining Engineering at the University of the Witwatersrand. The authors would like to acknowledge the administrative and financial support provided by School of Mining Engineering, as well as the School of Advanced Geomechanical Engineering (SAGE), at the National University of Sciences and Technology (NUST) Risalpur Campus, Pakistan.
References
Abdi, H. and Williams, L.J. 2010. Principal component analysis. Wiley Interdisciplinary Reviews: Computational Statistics, vol. 2. pp. 433-459. [ Links ]
Abhary, A. and Hassani, H. 2016. Mapping hydrothermal mineral deposits using PCA and BR methods in Baft 1: 100000 Geological Sheet, Iran. 2. http://www.academia.edu/28268172/Mapping_Hydrothermal_Mineral_Deposits_Using_PCA_and_BR_Methods_in_Baft_1_100000_Geological_Sheet_Iran [ Links ]
Bedini, E. 2009. Mapping lithology of the Sarfartoq carbonatite complex, southern West Greenland, using HyMap imaging spectrometer data. Remote Sensing of Environment, vol. 113. pp.1208-1219. [ Links ]
Bemis, S.P., Micklethwaite, S., Turner, D., James, M.R., Akciz, S., Thiele, S.T., and Bangash, H.A. 2014. Ground-based and UAV-based photogrammetry: A multi-scale, high-resolution mapping tool for structural geology and paleoseismology. Journal of Structural Geology, vol. 69, no. 1. pp. 63-178. [ Links ]
Berk, A., Bernstein, L., Anderson, G., Acharya, P., Robertson, D., Chetwynd, J., and Adler-Golden, S. 1998. MODTRAN cloud and multiple scattering upgrades with application to AVIRIS. Remote Sensing of Environment, vol. 65. pp. 367-375. [ Links ]
Bhattacharya, S., Majumdar, T., Rajawat, A., Panigrahi, M., and Das, P. 2012. Utilization of Hyperion data over Dongargarh, India, for mapping altered/weathered and clay minerals along with field spectral measurements. International Journal of Remote Sensing, vol. 33. pp. 5438-5450. [ Links ]
Calvin, W.M., Littlefield, E.F., and Kratt, C. 2015. Remote sensing of geothermal-related minerals for resource exploration in Nevada. Geothermics, vol. 53. pp. 517--526. [ Links ]
Chander, G. and Markham, B. 2003. Revised Landsat-5 TM radiometric calibration procedures and postcalibration dynamic ranges. IEEE Transactions on Geoscience and Remote Sensing, vol. 41. pp. 2674-2677. [ Links ]
Chavez, P.S. 1996. Image-based atmospheric corrections-revisited and improved. Photogrammetric Engineering and Remote Sensing, vol. 62. pp. 1025-1035. [ Links ]
Cheng, Q., Bonham-Carter, G., Wang, W., Zhang, S., Li, W., and Qinglin, X. 2011. A spatially weighted principal component analysis for multi-element geochemical data for mapping locations of felsic intrusions in the Gejiu mineral district of Yunnan, China. Computers & Geosciences, vol. 37. pp. 662-669. [ Links ]
Ciampalini, A., Garfagnoli, F., Antonielli, B., Moretti, S., and Righini, G. 2013. Remote sensing techniques using Landsat ETM+ applied to the detection of iron ore deposits in Western Africa. Arabian Journal of Geosciences, vol.6. pp. 4529-4546. [ Links ]
Clark, R.N. 1999. Spectroscopy of rocks and minerals, and principles of spectroscopy. Manual of Remote Sensing, vol. 3. pp. 2.2-2.4. [ Links ]
Clark, R.N., King, T.V., Klejwa, M., Swayze, G.A., and Vergo, N. 1990. High spectral resolution reflectance spectroscopy of minerals. Journal of Geophysical Research: Solid Earth, vol. 95. pp. 12653-12680. [ Links ]
Da Cunha Frutuoso, R.M. 2015. Mapping hydrothermal gold mineralization using Landsat 8 data. A case of study in Chaves license, Portugal. https://sigarra.up.pt/fcup/pt/pub_geral.show_file?pi_doc_id=44053 [ Links ]
Dabrowski, J.M., Ashton, P.J., Murray, K., Leaner, J.J., and Mason, R.P. 2008. Anthropogenic mercury emissions in South Africa: Coal combustion in power plants. Atmospheric Environment, vol. 42. pp. 6620-6626. [ Links ]
Di Tommaso, I. and Rubinstein, N. 2007. Hydrothermal alteration mapping using ASTER data in the Infiernillo porphyry deposit, Argentina. Ore Geology Reviews, vol. 32. pp. 275-290. [ Links ]
Drews-Armitage, S., Romberger, S., and Whitney, C. 1996. Clay alteration and gold deposition in the Genesis and Blue Star deposits, Eureka County, Nevada. Economic Geology, vol. 91. pp. 1383-1393. [ Links ]
Ducart, D.F., Silva, A.M., Toledo, C.L.B., and Assis, L.M.D. 2016. Mapping iron oxides with Landsat-8/OLI and EO-1/Hyperion imagery from the Serra Norte iron deposits in the Carajás Mineral Province, Brazil. Brazilian Journal of Geology, vol. 46. pp. 331-349. [ Links ]
Durand, J. 2012. The impact of gold mining on the Witwatersrand on the rivers and karst system of Gauteng and North West Province, South Africa. Journal of African Earth Sciences, vol. 68. pp. 24-43. [ Links ]
El-Makky, A.M. 2011. Statistical analyses of La, Ce, Nd, Y, Nb, Ti, P, and Zr in bedrocks and their significance in geochemical exploration at the Um Garayat gold mine Area, Eastern Desert, Egypt. Natural Resources Research, vol. 20. pp. 157. [ Links ]
Gabr, S., Ghulam, A., and Kusky, T. 2010. Detecting areas of high-potential gold mineralization using ASTER data. Ore Geology Reviews, vol. 38. pp. 59-69. [ Links ]
Gad, S. and Kusky, T. 2006. Lithological mapping in the Eastern Desert of Egypt, the Barramiya area, using Landsat thematic mapper (TM). Journal of African Earth Sciences, vol. 44. pp. 196-202. [ Links ]
Gale. 2017. Education, learning and research resources. https://www.gale.com/ [accessed 15 November 2017]. [ Links ]
Gholami, R., Moradzadeh, A., and Yousefi, M. 2012. Assessing the performance of independent component analysis in remote sensing data processing. Journal of the Indian Society of Remote Sensing, vol. 40. pp. 577-588. [ Links ]
Grunsky, E.C., Mueller, U.A., and Corrigan, D. 2014. A study of the lake sediment geochemistry of the Melville Peninsula using multivariate methods: applications for predictive geological mapping. Journal of Geochemical Exploration, vol. 141. pp. 15-41. [ Links ]
Han, T. and Nelson, J. 2015. Mapping hydrothermally altered rocks with Landsat 8 imagery: A case study in the KSM and Snowfield zones, northwestern British Columbia. British Columbia Geological Survey. [ Links ]
Holmes, R. and Lu, L. 2015. Introduction: Overview of the global iron ore industry. Iron Ore. Elsevier. [ Links ]
Horel, J. 1984. Complex principal component analysis: Theory and examples. Journal of Climate and Applied Meteorology, vol. 23. pp. 1660-1673. [ Links ]
Johnson, J.R., Bell Iii, J.F., Bender, S., Blaney, D., Cloutis, E., Ehlmann, B., Fraeman, A., Gasnault, O., Kinch, K., and Le Mouélic, S. 2016. Constraints on iron sulfate and iron oxide mineralogy from ChemCam visible/near-infrared reflectance spectroscopy of Mt. Sharp basal units, Gale Crater, Mars. American Mineralogist, vol. 101. pp. 1501-1514. [ Links ]
Jolliffe, I.T. 2002. Principal component analysis and factor analysis. Principal Component Analysis. Springer. pp. 150-166. [ Links ]
Kaiser, P.K., Henning, J.G., Cotesta, L., and Dasys, A. 2002. Innovations in mine planning and design utilizing collaborative immersive virtual reality (CIRV). Proceedings of the 104th CIM Annual General Meeting. CIM, Montreal. [ Links ]
Kaufmann, H. 1988. Concepts, processing and results. International Journal of Remote Sensing, vol. 9. pp. 1639-1658. [ Links ]
Kotnise, G. and Chennabasappa, S. 2015. Application of remote sensing techniques in identification of lithological rock units in southern extension of Kolar Schist Belt from Chigargunta, Chittoor District, Andhra Pradesh to Maharajagadai, Krishnagiri District, Tamil Nadu. International Journal of Innovative Science, Engineering Technology, vol. 2, no. 11. https://pdfs.semanticscholar.org/6015/c9bc313ed49aff69eace093634eeb2b978e2.pdf [ Links ]
Kruse, F.A. 2015. Comparative analysis of airborne visible/infrared imaging spectrometer (AVIRIS), and hyperspectral thermal emission spectrometer (HyTES) longwave infrared (LWIR) hyperspectral data for geologic mapping. Proceedings of Algorithms and Technologies/or Multispectral, Hyperspectral, and Ultraspectral Imagery XXI. International Society for Optics and Photonics. 94721F. doi: 10.1117/12.2176646 [ Links ]
Liu, L., Li, Y., Zhou, J., Han, L., and Xu, X. 2018. Gold-copper deposits in Wushitala, Southern Tianshan, Northwest China: Application of ASTER data for mineral exploration. Geological Journal, vol. 53. pp. 362-371. [ Links ]
Loughlin, W. 1991. Principal component analysis for alteration mapping. Photogrammetric Engineering and Remote Sensing, vol. 57. pp. 1163-1169. [ Links ]
Maduaka, A.C. 2014. Contributions of solid mineral sectors to Nigeria's economic development. Eastern Mediterranean university (EMu) and Dogu Akdeniz Üniversitesi (DAÜ [ Links ]).
Mahandani, S., Puta, I., Hirawan, A., Abbas, R., and Titisari, A. 2018. Integrated remote sensing and geological mapping to identify landslide prone zone in Loano, Purworejo, Central Java. Proceedings of EAGE-HAGI 1st Asia Pacific Meeting on Near Surface Geoscience and Engineering. doi: 10.3997/2214-4609.201800372 [ Links ]
Mahboob, M.A., Atif, I., and Iqbal, J. 2015. Remote sensing and GIS applications for assessment of urban sprawl in Karachi, Pakistan. Science, Technology and Development, vol. 34. pp. 179-188. [ Links ]
Mahboob, M.A., Iqbal, J., and Atif, I. 2015. Modeling and simulation of glacier avalanche: A case study of gayari sector glaciers hazards assessment. IEEE Transactions on Geoscience and Remote Sensing, vol. 53. pp. 5824-5834. [ Links ]
MANLEY, M. 2014. Near-infrared spectroscopy and hyperspectral imaging: nondestructive analysis of biological materials. Chemical Society Reviews, vol. 43. pp. 8200-8214. [ Links ]
Manuel, R., Brito, M.D.G., Chichorro, M., and Rosa, C. 2017. Remote sensing for mineral exploration in Central Portugal. Minerals, vol. 7. p. 184. https://pdfs.semanticscholar.org/9b8a/8073aadc6d19c5e4f14f517fe445096b8465.pdf [ Links ]
Marjoribanks, R. 2010. Geological mapping in exploration. Geological Methods in Mineral Exploration and Mining. Springer. [ Links ]
Masek, J.G., Vermote, E.F., Saleous, N.E., Wolfe, R., Hall, F.G., Huemmrich, K.F., GAo, F., KuTLER, J., and LIM, T.-K. 2006. A Landsat surface reflectance dataset for North America, 1990-2000. IEEE Geoscience and Remote Sensing Letters, vol. 3. pp. 68-72. [ Links ]
Mia, B. and Fujimitsu, Y. 2012. Mapping hydrothermal altered mineral deposits using Landsat 7 ETM+ image in and around Kuju volcano, Kyushu, Japan. Journal of Earth System Science, vol. 121. pp. 1049-1057. [ Links ]
Novak, I. and Soulakellis, N. 2000. Identifying geomorphic features using LANDSAT-5/TM data processing techniques on Lesvos, Greece. Geomorphology, vol. 34. pp. 101-109. [ Links ]
Panahi, A., Cheng, Q., and Bonham-Carter, G.F. 2004. Modelling lake sediment geochemical distribution using principal component, indicator kriging and multifractal power-spectrum analysis: A case study from Gowganda, ontario. Geochemistry: Exploration, Environment, Analysis, vol. 4. pp. 59-70. [ Links ]
Pour, A.B. and Hashim, M. 2012. The application of ASTER remote sensing data to porphyry copper and epithermal gold deposits. Ore Geology Reviews, vol. 44. pp. 1-9. [ Links ]
Pour, A.B. and Hashim, M. 2015. Regional hydrothermal alteration mapping using Landsat-8 data. Proceedings of Space Science and Communication (IconSpace) 2015. IEEE. pp. 199-202. [ Links ]
Pournamdari, M., Hashim, M. and Pour, A.B. 2014.Spectral transformation of ASTER and Landsat TM bands for lithological mapping of Soghan ophiolite complex, south Iran. Advances in Space Research, vol. 54, no. 4. pp. 694-709. [ Links ]
Ramakrishnan, D. and Bharti, R. 2015. Hyperspectral remote sensing and geological applications. Current Science, vol. 108. pp. 879-891. [ Links ]
Rathod, P.H., Müller, I., Van Der Meer, F.D., and De Smeth, B. 2016. Analysis of visible and near infrared spectral reflectance for assessing metals in soil. Environmental Monitoring and Assessment, vol. 188. pp. 558. [ Links ]
Repacholi, M. 2012. Clay Mineralogy: Spectroscopic and Chemical Determinative Methods. Springer Science & Business Media. [ Links ]
Richter, R. 1997. Correction of atmospheric and topographic effects for high spatial resolution satellite imagery. International Journal of Remote Sensing, vol. 18. pp. 1099-1111. [ Links ]
Roy, D.P., Kovalskyy, V., Zhang, H., Vermote, E.F., Yan, L., Kumar, S., and Egorov, A. 2016. Characterization of Landsat-7 to Landsat-8 reflective wavelength and normalized difference vegetation index continuity. Remote Sensing of Environment, vol. 185. pp. 57-70. [ Links ]
Sabins, F. F. 1999. Remote sensing for mineral exploration. Ore Geology Reviews, vol. 14. pp. 157-183. [ Links ]
Sabins, F.F. 2007. Remote Sensing: Principles and Applications, Waveland Press. [ Links ]
Safari, M., Maghsoudi, A., and Pour, A.B. 2017. Application of Landsat-8 and ASTER satellite remote sensing data for porphyry copper exploration: a case study from Shahr-e-Babak, Kerman, south of Iran. Geocarto International, May 2017. pp. 1-16. [ Links ]
Schroeder, T. A., Cohen, W.B., Song, C., Canty, M.J., and YANG, Z. 2006. Radiometric correction of multi-temporal Landsat data for characterization of early successional forest patterns in western oregon. Remote Sensing of Environment, vol. 103. pp. 16-26. [ Links ]
Schwertmann, U. 1993. Relations between iron oxides, soil color, and soil formation. Soil Color. Bigham, J.M. and Ciolkosz, E.J. (eds.). Soil Science Society of America. pp. 51-69. [ Links ]
Short, N.M. and Lowman Jr, P.D. 1973. Earth Observations from Space: outlook for the Geological Sciences. Goddard Space Flight Center, Greenbelt, MD. [ Links ]
Song, C. and Woodcock, C.E. 2003. Monitoring forest succession with multitemporal Landsat images: Factors of uncertainty. IEEE Transactions on Geoscience and Remote Sensing, vol. 41. pp. 2557-2567. [ Links ]
Song, C., Woodcock, C.E., Seto, K. C., Lenney, M.P., and Macomber, S.A. 2001. Classification and change detection using Landsat TM data: When and how to correct atmospheric effects? Remote Sensing of Environment, vol. 75. pp. 230-244. [ Links ]
Sutton, M., Weiersbye, I., Galpin, J., and Heller, D. 2006. A GIS-based history of gold mine residue deposits and risk assessment of post-mining land uses on the Witwatersrand Basin, South Africa. Proceedings of Mine Closure 3006. Fourie, A. and Tibbett, M. (eds.) Australian Centre for Geomechanics, Perth pp. 667-678. [ Links ]
Sutton, M.W. 2013. Use of remote sensing and GIS in a risk assessment of gold and uranium mine residue deposits and identification of vulnerable land use. MSc dissertation, University of the Witwatersrand. http://wiredspace.wits.ac.za/handle/10539/12692 [ Links ]
Tangestani, M. and Moore, F. 2001. Comparison of three principal component analysis techniques to porphyry copper alteration mapping: a case study, Meiduk area, Kerman, Iran. Canadian Journal of Remote Sensing, vol. 27. pp. 176-182. [ Links ]
Tedesco, S.A. 2012. Surface Geochemistry in Petroleum Exploration. Springer Science & Business Media. [ Links ]
Udvardi, B., KovAcs, I.J., Fancsik, T., Kónya, P., BAtori, M., Stercel, F., Falus, G., and Szalai, Z. 2017. Effects of particle size on the attenuated total reflection spectrum of minerals. Applied Spectroscopy, vol. 71. pp. 1157-1168. [ Links ]
Van Der Meer, F. 2004. Analysis of spectral absorption features in hyperspectral imagery. International Journal of Applied Earth Observation and Geoinformation, vol. 5. pp. 55-68. [ Links ]
Vermote, E., Justice, C., Claverie, M., and Franch, B. 2016. Preliminary analysis of the performance of the Landsat 8/OLI land surface reflectance product. Remote Sensing of Environment, vol. 185. pp. 46-56. [ Links ]
Vermote, E. F., Tanré, D., Deuze, J. L., Herman, M., and Morcette, J.-J. 1997. Second simulation of the satellite signal in the solar spectrum, 6S: An overview. IEEE Transactions on Geoscience and Remote Sensing, vol. 35. pp. 675-686. [ Links ]
Vorster, C. 2012a. Simplified geology and gold deposits, South Africa Lesotho and Swaziland. Council for Geoscience, Pretoria, South Africa. http://www.geoscience.org.za/images/Maps/gold.gif [ Links ]
Vorster, C. 2012b. Simplified geology and iron deposits, South Africa Lesotho and Swaziland. Council for Geoscience, Pretoria, South Africa. http://www.geoscience.org.za/images/Maps/iron.gif [ Links ]
Wessels, R L., Vaughan, R.G., Patrick, M.R., and Coombs, M.L. 2013. Highresolution satellite and airborne thermal infrared imaging of precursory unrest and 2009 eruption at Redoubt Volcano, Alaska. Journal of Volcanology and Geothermal Research, vol. 259. pp. 248-269. [ Links ]
Zaini, N., Van Der Meer, F., Van Ruitenbeek, F., De Smeth, B., Amri, F., and Lievens, C. 2016. An alternative quality control technique for mineral chemistry analysis of Portland cement-grade limestone using shortwave infrared spectroscopy. Remote Sensing, vol. 8. p. 950. [ Links ]
Zanter, K. 2016. Landsat 8 (L8) data users handbook. https://landsat.usgs.gov/landsat-8-l8-data-users-handbook [accessed 20 January 2018]. [ Links ]
Zhang, X., Pazner, M., and Duke, N. 2007. Lithologic and mineral information extraction for gold exploration using ASTER data in the south Chocolate Mountains (California). ISPRS Journal of Photogrammetry and Remote Sensing, vol. 62. pp. 271-282. [ Links ]
Paper received Sepc. 2018
revised paper received Mar. 2019

