


Services on Demand
Article
 English (pdf)
 Article in xml format
 Article references
Indicators

Related links
-
 Cited by Google
 -
 Similars in Google
Share

 Permalink
Journal of the Southern African Institute of Mining and Metallurgy
On-line version ISSN 2411-9717
Print version ISSN 2225-6253
J. S. Afr. Inst. Min. Metall. vol.119 n.3 Johannesburg Mar. 2019
http://dx.doi.org/10.17159/2411-9717/2019/v119n3a6
PROFESSOR DICK MINNITT SPECIAL EDITION
Benefits of including resistivity data in a resource model - an example from the Postmasburg Manganese Field
J. Perold; C. Birch
School of Mining Engineering, University of the Witwatersrand, South Africa
SYNOPSIS
Due to the challenging geological environment of the Postmasburg Manganese Field (PMF), a study was conducted to determine if any benefits would derive from the inclusion of resistivity data during three-dimensional (3D) modelling of the manganese resource. This was achieved by estimating manganese resources from 2011/2012 drilling data and comparing them with manganese resources estimated from the same drilling data and resistivity data collected during 2013 and 2017.
Both models were adjusted to limit their extent to the same 3D modelling space. Significant volume and tonnage differences were observed for all lithological units. The greatest differences were noted in the manganiferous zones of alteration - 7.200 Mt for the geological model versus 3.700 Mt for the geoelectric model.
This study showed that the inclusion of resistivity data can reduce exploration costs significantly, as a direct consequence of the resistivity data allowing more accurate siting of boreholes. This decreases the number of boreholes, samples, and analyses required due to the 3D electrical delineation of mineralized areas prior to drilling.
An additional benefit is the ability to more correctly forecast the net present value of an operation due to more accurate estimation of manganese resources and stripping ratios. This is clearly demonstrated by the estimated gross profit estimation of R409 million for the geological resource model versus R264 million for the geoelectric resource model.
The addition of resistivity data can, therefore, reduce exploration costs and can increase confidence in geological and financial modelling. It would be reasonable to conclude that this approach could also be used for karst-hosted massive sulphide deposits.
Keywords: resource estimation, manganese, resistivity data, financial modelling.
Introduction
According to Corathers (2014) and Gajigo, Mutambatsere. and Adjei (2011), South Africa holds between 75-80% of global manganese reserves, followed by Ukraine (10%), Australia (3%), India (3%), and Gabon (2%). The known, land-based, manganese resources located elsewhere are estimated at 2%.
The majority of economically important sedimentary manganese ore deposits in South Africa are situated in the Northern Cape Province (Gutzmer, 1996). Manganese ores of the Postmasburg Manganese Field (PMF) were discovered in 1922, and the Kalahari Manganese Field (KMF) in 1940. According to Astrup and Tsikos (1998) and Gutzmer (1996), mining of manganese ore from the PMF ceased during 1989 in favour of the superior quality of manganese ore from the KMF.
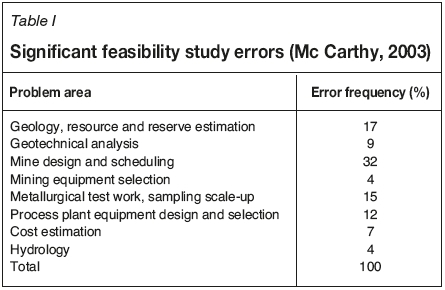
Gutzmer (1996) also stated that the irregular size and shape of the deposits, shortage of remaining reserves, and ore composition, are the chief factors that stopped the exploitation of the PMF orebodies. The shortage of remaining ore reserves might be ascribed to insufficient geological input, resulting in incorrect geological understanding and modelling of these orebodies. This likelihood is based on the findings of McCarthy (2003), who identified problem areas with associated error frequencies from 105 completed mine feasibility studies analysed (Table I). A significant portion of identifiable errors is directly linked to insufficient geological input, resulting in incorrect geological understanding and modelling of orebodies. Mine design and scheduling using incorrect orebody models will surely contribute to business risks, negatively impacting on potential profitability.
The critical role of manganese in the global economy and the fact that mining in the PMF ceased prior to the development of current levels of geophysical prospecting techniques and 3D modelling software are sufficient reason to apply these technologies during prospecting in the PMF. The purpose of this paper is to highlight the impact of resistivity data on the accuracy of PMF mineral resource estimation. This was established by comparing differences in geological interpretation by constructing two 3D resource models; one with and one without resistivity data.
The Postmasburg Manganese Field (PMF)
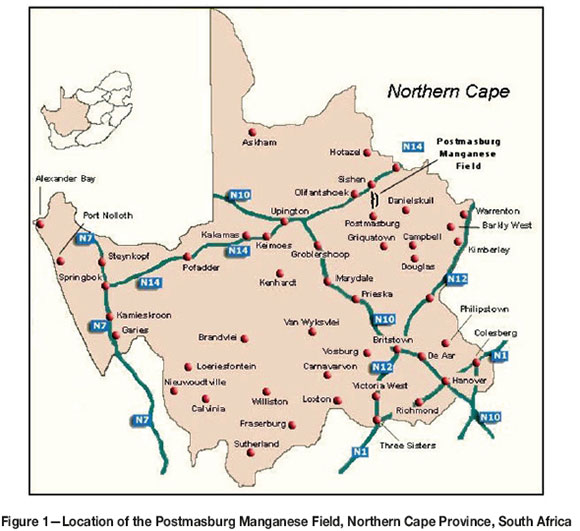
The PMF is situated on the Maremane Dome (Eriksson, Altermann, and Hartzer; 2006), and is located immediately to the north of the town of Postmasburg, extending northwards towards Sishen (Figure 1). The Maremane Dome (Figure 2) is a 'domed anticline with strata dipping at less than 1:100 in an arc to the north, east and south' (Cairncross, Beukes, and Gutzmer 1997). Rocks of the Transvaal Supergroup, Griqualand West Basin, were deposited onto the basement rock of the Maremane Dome.
The study area is underlain by manganese ore of the Western Belt (Gutzmer, 1996) of the PMF. The orebody is associated with shale, overlain by quartzite and basaltic lava of the Gamagara Formation, Olifantshoek Supergroup. The irregular size and shape of the orebodies (Gutzmer, 1996) resulted primarily from deposition onto a weathered, Reivilo Formation dolomite paleosurface. The Reivilo Formation is a subdivision of the Ghaap Group, Campbell Rand Subgroup, Transvaal Supergroup. Dolomite that resisted weathering formed unevenly spaced pinnacles when the softer rocks were eroded away. Accurate delineation of the dolomitic floor topography and manganese orebody is of utmost importance for precise geological modelling and mineral resource estimation.
A clear understanding of the mineral content and textural relationships within the rocks of the Western Belt of the PMF is also required prior to constructing a 3D geological model as shown in Figure 3. Gutzmer (1996) and Gutzmer and Beukes (1997) suggest that the ferruginous manganese ores formed through the following sequence of events:
1. Deposition of a mixture of aluminous clay and ferruginous manganiferous wad in depressions in the karst topography of the paleodolomite surface of the Reivilo Formation.
2. The deposition of haematite pebbles, shale, and quartzite of the Gamagara Formation.
3. Low-angle thrusting causing lower level greenschist facies metamorphism, resulting in the formation of braunite (Mn2+,Mn63+SiO12) and partridgeite (Mn2O3), as well as coarse crystalline bixbyite-rich (Mn23+O3) ferruginous ores (Mindat, 2017).
4. Exposure and erosion producing:
(a) Supergene mineralization resulting from secondary karstification, slumping, and brecciation, leading to the formation of romanechite ((Ba, H2O)2(Mn4+,Mn3+)5O10) (Mindat, 2017) crusts and wad
(b) Placer (canga) deposits resulting from accumulation.
Application of resistivity survey data
Research results related to the findings of resistivity studies conducted on the rocks of the PMF are not available in the public domain. Research by Ramazi and Mostafaic (2012) on manganese deposits associated with the Uremich-Dokhtar volcanic belt in the northwest of Iran showed that resistivity results can be used to accurately differentiate between manganese interbeds and limestone. The manganese mineralization underlying their study area correlated well with areas of low resistivity. Moreira et al. (2014) used low resistivity values to accurately differentiate between manganese mineralized zones, soil, and saprolite associated with supergene manganese deposits in southern Brazil. Both publications concluded that the inclusion of resistivity data can result in much greater detail than is usually assimilated from drilling and sampling alone.
To construct a 3D geoelectric model, the relationship between identified geological domains and georeferenced resistivity values has to be defined. Identification of consistent apparent resistivity ranges depends entirely on the order of magnitude of the variability in electrical conductivity for a specific rock domain (Oldenburg and Jones, 2007). Guidelines used to determine apparent resistivity ranges were based primarily on their research.
Oldenburg and Jones's (2007) generalized comparison for different rock types (Figure 4) clearly indicates that the expected resistivity ranges for metallic minerals (0.01 to 1 Ω .m) should differ significantly from that for shale (7 to 50 Ω .m), sandstone (60 to 10 000 Ω .m) and dolomite (1000 to 100 000 Ω .m). Braunite (Mn2+Mn3+6[O8iSiO4]), bixbyite (Mn,Fe)2O3, partridgeite (Mn2O3), haematite (Fe2O3), and specularite (Fe2O3) are the economically important ore minerals associated with the PMF (Gutzmer, 1996; Gutzmer and Beukes, 1997). Smith (2002) records the resistivity of haematite as 3.5 χ 10-3 - 107 Ω .m. and that of specularite averaging 6 χ 10-3 Ω .m. Srigutomo, Trimadona, and Prihandhanu (2016) concluded that manganese ore of a mudrock-hosted manganese deposit is associated with resistivity values less than 5 Ω .m and that the resistivity of the mudrock rarely exceeds 100 Ω .m. The 2D resistivity surveyed conducted comprised 70 lines, each 550 m in length.
Differences between project-specific selected resistivity ranges and the published resistivity ranges cited are mainly ascribed to differences in conductivity. Oldenburg and Jones (2007) stated that conductivity is mainly dependent on clay content, moisture content, hydraulic permeability, porosity, temperature and phase of pore fluid, and the concentration of dissolved electrolytes.
Interpretation and modelling
The impact of resistivity data on the accuracy of PMF mineral resource estimation was tested by constructing two 3D resource models, for comparison in Geovia Surpac 6.7. A primary geological model was created from data gathered during geological mapping, drilling, and sampling within the study area. A second 3D geoelectrical model was created by using resistivity data to guide the interpretation of the data used during construction of the primary model.
Primary geological model
Construction of the geological model commenced (Turner and Gable, 2006), by creating 15 west-east geological cross-sections perpendicular to the strike of the orebody. Interpretation of the geology was limited to the sectional areas between boreholes drilled. The range of influence of data from individual holes was limited to half the distance between holes unless geological contacts could be accurately recognized on the surface.
Delineation of manganiferous zones of alteration (manganore) was restricted to areas with reported Mn values equal to or greater than 11% and/or combined Mn and Fe values of 21% or greater. This resulted in the inclusion of areas with low manganese concentrations when iron concentrations were close to or higher than 21%. Additional zones of higher grade Mn mineralization, [Mn] > 24% and [Mn] > 28%, were then delineated within the manganore zone.
Resistivity (geoelectrical) model
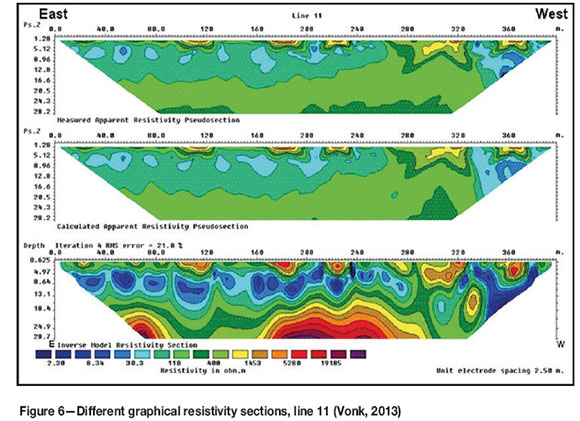
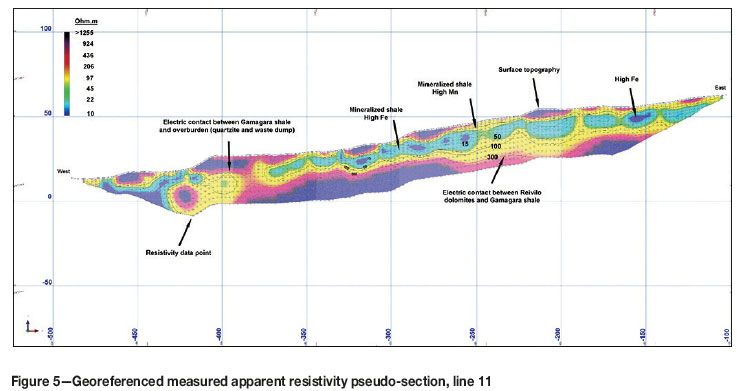
The resistivity data was imported into Geovia Surpac 6.7. Care was taken to ensure that the resultant dispersion patterns compared favourably with the inverse model resistivity sections, which accompanied the data. This is evident when comparing the georeferenced, measured apparent resistivity pseudo-section for line 11 (Figure 5) with the graphical resistivity section presented for line 11 (Figure 6). Georeferencing of the data resulted in the actual 3D orientation of each data-point, thus ensuring that it represents its physical location.
When constructing the 3D geoelectrical model, relationships between identified geological domains underlying the project area and the georeferenced resistivity values had to be defined (Loke, 2000). Table II summarizes the resistivity ranges selected for identified lithological units underlying the project area. This was achieved by draping the georeferenced resistivity data over borehole geological logs and analytical data contained in the project database. Resistivity ranges were found to be fairly constant but showed some variation between lines. Two lines showed reduced resistance, approximately 50 Ω .m, for mineralized areas compared to the other lines surveyed.
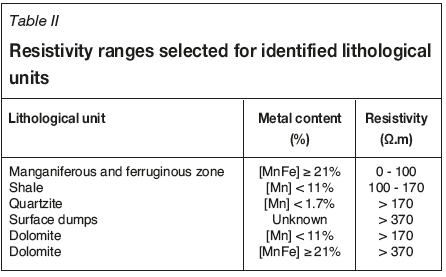
The resolution of the resistivity values is unfortunately not high enough to conclusively deduce whether ferruginous shale with low concentrations of manganese is associated with areas of low resistivity (< 50 Ω .m). As Mn and Fe mineralization are uncorrelated, zones of alteration (Table II) were subdivided into mostly manganiferous (50-100 Ω .m) and mostly ferruginous (< 50 Ω .m). Solid models were constructed from the created geoelectrical sections to demarcate geoelectric lithological units inside the model.
Results and discussion
Geological interpretation
Table III compare volumetric differences for lithological domains that resulted from the modelling regimes employed, based on geological interpretation as shown in Figure 7. The differences are expressed as percentage change, based on the modelled volume of individual lithological units of the geological model. The differences observed are significant and relate to:
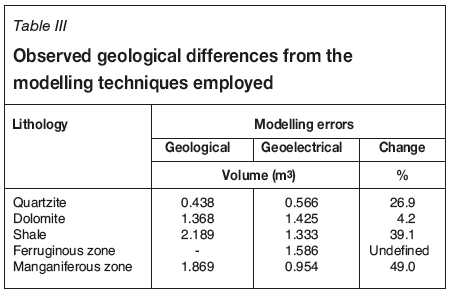
> The shape, position, and orientation of the dolomite floor and associated pinnacles
> Areas of mineralization and differentiation of areas with ferruginous and manganiferous alteration created for the geoelectrical model
> The inability to delineate a separate ferruginous zone of the alteration domain in the geological model, due to insufficient geological and chemical data
> The shape, position, and orientation of the overlying quartzite
> The shape, position, and orientation of the unaltered shale.
The principal reason for the volumetric differences is the high resolution of the sectional resistivity data, which allows detailed modelling on a very small scale. Results obtained from the resistivity data and associated geoelectrical model resemble the model of origin proposed by Gutzmer (1996) and Gutzmer and Beukes (1997) more closely than the geological model derived from drilling results alone.
Stripping ratios and mineral resource estimates
Applying a cut-off grade (Pittuck, 2015) to the created geological and geoelectric models resulted in mineral resource statements suitable for comparison. This was achieved by applying financial constraints to determine if 'a reasonable and realistic prospect for eventual economic extraction' exists (SAMREC, 2016).
Estimated differences are shown in Table IV, expressed as percentage changes, based on the modelled tonnage of individual lithological units related to the geological resource model. The impact of the different modelling techniques on manganese resources and stripping ratios is drastic. The reduction in economically extractable ore and subsequent increase in total waste tonnage in the geoelectrical model resulted in a 208.9% increase in stripping ratio.
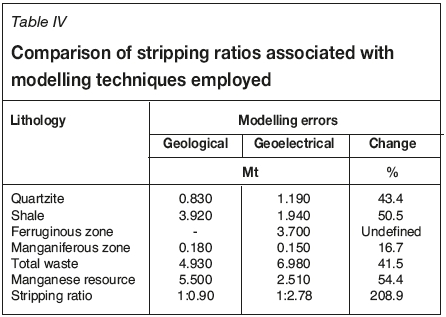
The incorporation of the resistivity results survey undoubtedly increased the geoscientific confidence and level of knowledge regarding the challenging spatial orientation and extent of the drilled portion of the mineral deposit. The following parameters are recommended for classification of manganese mineral resources associated with the PMF.
> Inferred Resource-A resistivity line spacing of 100 m and a core drilling grid of 100 χ 200 m located on resistivity lows
> Indicated Resources-A resistivity line spacing of 50 m and a core drilling grid of 50 χ 50 mters located on resistivity lows
> Measured Resources-A resistivity line spacing of 25 m and a core drilling grid of 25 χχ 25 m located on resistivity lows.
Financial impact
The magnitudes of financial risks and rewards stemming from resistivity modelling of PMF exploration were defined by comparing exploration expenditure and the impact of stripping ratios on gross profit. These financial indicators were chosen as they directly impact on affordability, cash flow, and the return on capital invested.
Exploration
During exploration, non-invasive resistivity surveys are critical prior to siting boreholes. Areas of low resistivity (< 150 Ω .m) showing horizontal continuity in excess of 100 m should be chosen as drilling targets.
The unfortunate fact that exploration drilling was conducted before resistivity surveys were undertaken presented a unique opportunity for cost comparison. This was done by using the results of the resistivity survey to determine any errors made during the initial drilling programme. The following was observed from a total of 32 boreholes drilled in the study area:
> Drilling too deep - 81.6 m
> Percentage of boreholes correctly sited: 56%
> Percentage correct sampling: 48%.
Exploration activities were costed by using actual costs from a geophysicist and drilling contractor on site during 2017. Table V clearly shows that results from a resistivity programme conducted prior to drilling would have reduced associated drilling expenditure by approximately 46% and expenditure on chemical analyses by approximately 52%. The total cost estimate for prospecting with resistivity data is 47% lower than without resistivity data.
Costs associated with quality control and quality assurance, core logging, and sampling will most probably be incrementally lower due to the reduced workload. Costs associated with 3D modelling will be fairly similar, as the additional time spent on georeferencing of resistivity data is offset by the reduced time spent on deducing geological and geochemical contacts during 3D modelling of the mineral deposit.
Exploitation
The effect of different stripping ratios, from the created resource models, on monthly gross profit is illustrated in Table VI. Stripping ratio is the only variable considered when the cost of production (lump ore product) is calculated. If the stripping ratios for the created models were the same, the estimated costs would have been equal. This caused the cost of waste mining associated with the geoelectrical model to be 209% higher than that estimated for the geological model. Gross profit for the geoelectrical model reduces by 41% compared to the geological model based on drilling data alone.
Assuming that the geoelectrical model is more accurate, the monthly estimated gross profit of the geological model is overestimated by R3 million. This equates to R409 million for the declared mineral resources.
Validation of the hypothesis
To confirm the conclusions drawn and endorse the recommendations made, 16 core boreholes were drilled in the study area during November/December 2017, the first drilling since completion of the initial prospecting phase (without resistivity data) during 2011/2012. Boreholes were sited on an approximate 50 χ 50 m grid covering an area 150 m by 175 m in extent. Boreholes were deliberately placed on resistivity lines surveyed earlier during 2017 or 2013. The area chosen showed continuity of resistance levels <150 Ω .m over distances exceeding 120 m.
The results of the 2017 drilling campaign were very encouraging. All 16 boreholes drilled intersected manganese mineralization. The ore intersections in 15 of the boreholes averaged above 28% Mn. The average in situ manganese grade of the area drilled during 2017 is 8% higher than the average grade of the project estimated from the 2011/2012 drilling data. The average estimated iron grade is 6.5% higher than in 2011/2012, while the total average metal concentration (MnFe) increased by 14.5%.
A similar grade comparison confined to the area drilled during 2017 showed that the average in situ manganese grade estimated from the 2017 data is 2.54 % higher than that estimated from the 2011/2012 drilling data. The average estimated iron grade is 4.49% higher than in 2011/2012, while total average metal concentration (MnFe) increased by 7.03%.
Conclusions
The aim of this study was to determine if any benefits will derive from the inclusion of resistivity data in a manganese resource model for the PMF. This was achieved by estimating manganese resources from 2011/2012 drilling data for comparison with resources estimated from the same drilling data plus resistivity data collected during 2013 and 2017.
It was established that the addition of resistivity data can reduce exploration costs significantly in this challenging geological environment. The reduction in costs is a direct consequence of the application of resistivity data allowing more accurate placing of boreholes. This lessens the number of boreholes, samples, and analyses required due to the 3D electric delineation of mineralized areas prior to drilling.
An additional benefit is the ability to more correctly forecast the net present value of an operation due to more accurate estimation of manganese resources and stripping ratios. This is clearly demonstrated by the estimated gross profit difference of R409 million for the geological resource model and R264 million for the geoelectrical resource model.
The addition of resistivity data can, therefore, reduce exploration costs and can increase confidence in geological and financial modelling. It would be reasonable to conclude that this approach could also be used for karst-hosted massive sulphide deposits.
Acknowledgements
This paper is based on the MSc research project by Perold (2018), supervised by C. Birch from the School of Mining Engineering, University of the Witwatersrand.
References
Astrup, J. and Tsikos, H. 1998. Manganese. The Mineral Resources of South Africa. Wilson, M.G.C. and Anhaeusser, C.R. (eds). Handbook 16. Council for Geoscience, Pretoria. pp. 450-460. [ Links ]
Cairncross, B., Beukes, N.J., and Gutzmer, J. 1997: The Manganese Adventure: The South African Manganese Fields. Associated Ore & Metal Corporation Limited, Johannesburg. 236 pp. [ Links ]
Corathers, L.A. 2014. Manganese. US Geological Survey Mineral Commodity Summaries. February 2014. http://minerals.usgs.gov/minerals/pubs/commodity/manganese/ [ Links ]
Eriksson, P.G., Alterman, W., and Hartzer, F.J. 2006. The Transvaal Supergroup and its precursors. The Geology of South Africa. Johnson, M.R., Anhaeusser, C.R., and Thomas, R.J. (eds.). Geological Society of South Africa, Johannesburg and Council for Geoscience, Pretoria. pp. 237-260. [ Links ]
Gajigo, O., Mutambatsere, E., and Adjei, E. 2011. Manganese industry analysis: Implications for project finance. Working Paper Series no. 132. African Development Bank Group. https://www.afdb.org/en/documents/document/working-paper-132-manganese-industry-analysis-implications-for-project-finance-24162/ [ Links ]
Gutzmer, J. 1996. Genesis and alteration of the Kalahari and Postmasburg manganese deposits, Griqualand West, South Africa. PhD thesis, Faculty of Science, University of Johannesburg. [ Links ]
Gutzmer, J. and Beukes, N.J. 1997. Mineralogy and mineral chemistry of oxide facies manganese ores of the Postmasburg manganese field, South Africa. MineralogicalMagazine no. 61. pp. 213-230. [ Links ]
Loke, M.H. 2000. Electrical imaging surveys for environmental and engineering studies. A practical guide to 2-D and 3-D surveys. http://www.heritagegeophysics.com/images/lokenote.pdf [ Links ]
Mc Carthy, P. 2003. Managing technical risk for mine feasibility studies. Proceedings of the Mining Risk Management Conference. Australasian Institute of Mining and Metallurgy, Melbourne, Australia. Mindat.org. 2017. https://wwww.mindat.org/ [ Links ]
Moreira, C.A., Borges, M.R., Vieira, G.M.L., Filho, W.M., and Montanheiro, M.A.F. 2014. Geological and geophysical data integration for delimitation of mineralized areas in a supergene manganese deposit. Geofisica Internacional, vol. 53, no. 1. pp. 199-210. [ Links ]
Oldenburg, D.W. and Jones, F.H.M. 2007. Inversion for applied geophysics; Learning resources about geophysical inversion. Geophysical Inversion Facility, University of British Colombia. https://www.eoas.ubc.ca/ubcgif/iag/foundations/properties/resistivity.htm [ Links ]
Pittuck, M. 2015. Cut-off grades for mineral resource reporting: going the extra rare earth mile. SRK Consulting International Newsletter, no. 51. http://www.srk.com/files/File/newsletters/srknews51-MRE_A4-LR.pdf [ Links ]
Ramazi, H. and Mostafaic, K. 2012. Application of integrated geoelectrical methods in Marand (Iran) manganese deposit exploration. Arabian Journal of Geosciences, vol. 6. pp. 2961-2970. doi 10.1007/s12517-012-0537-2. [ Links ]
SAMREC. 2016. South African Mineral Resource Committee. The South African Code for the Reporting of Exploration Results, Mineral Resources and Mineral Reserves (the SAMREC Code. 2016 Edition. http://www.samcode.co.za/codes/category/8-reporting-codes?download=120:samrec [ Links ]
Smith, R.J. 2002. Geophysics of iron oxide copper-gold deposits. Hydrothermal iron Oxide Copper-Gold & Related Deposits: A Global Perspective. Volume 2. Porter, T.M. (ed.). PGC Publishing, Adelaide. pp 357-367. [ Links ]
Srigutomo, W. Trimadona, and Prihandhanu, M.P. 2016. 2D resistivity and induced polarization measurement for manganese ore exploration. Proceedings of the 6th Asian Physics Symposium, Bandung, Indonesia, 19-20 August 2015. Journal of Physics: Conference Series, vol. 739, no. 1. 0121385. IOP Publishing. https://iopscience.iop.org/article/10.1088/1742-6596/739/1/012138/pdf [ Links ]
Turner, A.K. and Gable, C.W. 2006. A Review of Geological Modeling. Colorado School of Mines, Golden, Co. https://pdfs.semanticscholar.org/5777/c2b949527397ac42ac9be64e5bb4fe7e8c7e.pdf [ Links ]
Paper received Sep. 2018
Revised paper received Feb. 2019

